Mga Batayang Estadistika
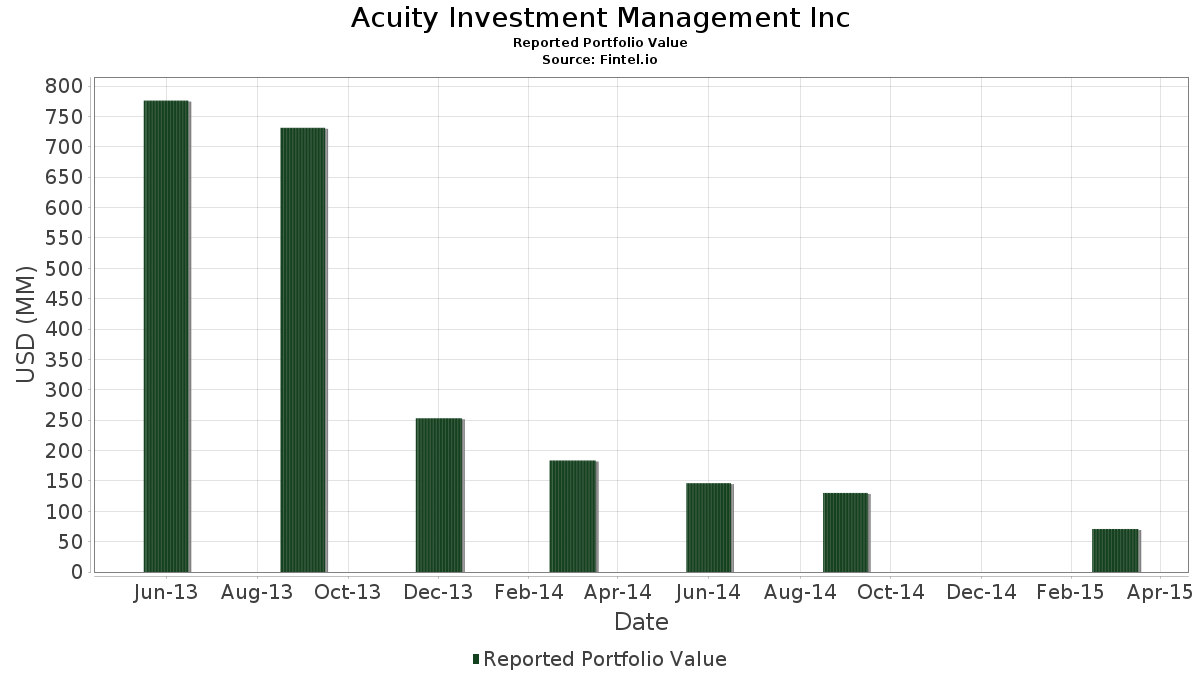
| Nilai Portofolio | $ 70,837,000 |
| Posisi Saat Ini | 145 |
Kepemilikan Terbaru, Kinerja, AUM (dari 13F, 13D)
Acuity Investment Management Inc telah mengungkapkan total kepemilikan 145 dalam pengajuan SEC terbaru mereka. Nilai portofolio terbaru dihitung sebesar $ 70,837,000 USD. Aset yang Dikelola (AUM) sebenarnya adalah nilai ini ditambah kas (yang tidak diungkapkan). Aset-aset utama Acuity Investment Management Inc adalah Royal Bank of Canada (US:RY) , The Bank of Nova Scotia (US:BNS) , The Toronto-Dominion Bank (US:TD) , Suncor Energy Inc. (US:SU) , and Manulife Financial Corporation (US:MFC) . Posisi baru Acuity Investment Management Inc meliputi: Lazard, Inc. (US:LAZ) , Las Vegas Sands Corp. (US:LVS) , CoreCivic, Inc. (US:CXW) , Ctrip.com International, Ltd. Bond 1.250%10/1 (US:22943FAD2) , and NOVELLUS SYS INC Bond (US:US670008AD31) .
Peningkatan Tertinggi Kuartal Ini
Kami menggunakan perubahan dalam alokasi portofolio karena ini adalah metrik yang paling bermakna. Perubahan dapat disebabkan oleh perdagangan atau perubahan harga saham.
| Keamanan | Saham (MM) |
Nilai (Juta Dolar AS) |
Portfolio % | ΔPorsyento ng Portfolio |
|---|---|---|---|---|
| 0.07 | 4.11 | 5.8063 | 5.8063 | |
| 0.06 | 3.10 | 4.3777 | 4.3777 | |
| 0.06 | 2.64 | 3.7311 | 3.7311 | |
| 0.08 | 2.31 | 3.2568 | 3.2568 | |
| 0.14 | 2.29 | 3.2370 | 3.2370 | |
| 0.06 | 1.85 | 2.6074 | 2.6074 | |
| 0.03 | 1.79 | 2.5241 | 2.5241 | |
| 0.02 | 1.62 | 2.2912 | 2.2912 | |
| 0.03 | 1.53 | 2.1641 | 2.1641 | |
| 0.03 | 1.41 | 1.9877 | 1.9877 |
Penurunan Tertinggi Kuartal Ini
Kami menggunakan perubahan dalam alokasi portofolio karena ini adalah metrik yang paling bermakna. Perubahan dapat disebabkan oleh perdagangan atau perubahan harga saham.
| Keamanan | Saham (MM) |
Nilai (Juta Dolar AS) |
Portfolio % | ΔPorsyento ng Portfolio |
|---|---|---|---|---|
| 0.55 | 0.7708 | -0.0866 |
Pengajuan 13F dan Dana
Formulir ini diajukan pada 2015-05-11 untuk periode pelaporan 2015-03-31. Klik ikon tautan untuk melihat riwayat transaksi selengkapnya.
Tingkatkan ke versi premium untuk membuka data premium dan ekspor ke Excel. ![]() .
.
| Keamanan | Ketik | Harga Saham Rata-rata | Saham (MM) |
ΔSaham (%) |
ΔSaham (%) |
Nilai ($MM) |
Portpolyo (%) |
ΔPortofolio (%) |
|
|---|---|---|---|---|---|---|---|---|---|
| RY / Royal Bank of Canada | 0.07 | 0.00 | 4.11 | 5.8063 | 5.8063 | ||||
| BNS / The Bank of Nova Scotia | 0.06 | 0.00 | 3.10 | 4.3777 | 4.3777 | ||||
| TD / The Toronto-Dominion Bank | 0.06 | 0.00 | 2.64 | 3.7311 | 3.7311 | ||||
| SU / Suncor Energy Inc. | 0.08 | 0.00 | 2.31 | 3.2568 | 3.2568 | ||||
| MFC / Manulife Financial Corporation | 0.14 | 0.00 | 2.29 | 3.2370 | 3.2370 | ||||
| CNQ / Canadian Natural Resources Limited | 0.06 | 0.00 | 1.85 | 2.6074 | 2.6074 | ||||
| CNI / Canadian National Railway Company | 0.03 | 0.00 | 1.79 | 2.5241 | 2.5241 | ||||
| CM / Canadian Imperial Bank of Commerce | 0.02 | 0.00 | 1.62 | 2.2912 | 2.2912 | ||||
| BAM / Brookfield Asset Management Ltd. | 0.03 | 0.00 | 1.53 | 2.1641 | 2.1641 | ||||
| MGA / Magna International Inc. | 0.03 | 0.00 | 1.41 | 1.9877 | 1.9877 | ||||
| ABBV / AbbVie Inc. | 0.02 | 0.00 | 1.36 | 1.9255 | 1.9255 | ||||
| BMO / Bank of Montreal | 0.02 | 0.00 | 1.12 | 1.5797 | 1.5797 | ||||
| ENB / Enbridge Inc. | 0.02 | 0.00 | 1.05 | 1.4809 | 1.4809 | ||||
| TU / TELUS Corporation | 0.03 | 0.00 | 1.03 | 1.4611 | 1.4611 | ||||
| CP / Canadian Pacific Kansas City Limited | 0.01 | 0.00 | 0.93 | 1.3157 | 1.3157 | ||||
| TRP / TC Energy Corporation | 0.02 | 0.00 | 0.90 | 1.2719 | 1.2719 | ||||
| LAZ / Lazard, Inc. | 0.02 | 0.85 | 1.2028 | 1.2028 | |||||
| PD / PagerDuty, Inc. | 0.13 | 0.00 | 0.85 | 1.1985 | 1.1985 | ||||
| LVS / Las Vegas Sands Corp. | 0.01 | 0.82 | 1.1576 | 1.1576 | |||||
| XLNX / Xilinx, Inc. | 0.02 | 0.00 | 0.81 | 1.1406 | 1.1406 | ||||
| LYB / LyondellBasell Industries N.V. | 0.01 | 0.00 | 0.78 | 1.1025 | 1.1025 | ||||
| OTEX / Open Text Corporation | 0.01 | 0.00 | 0.78 | 1.0941 | 1.0941 | ||||
| AAPL / Apple Inc. | 0.01 | 0.00 | 0.76 | 1.0715 | 1.0715 | ||||
| KMI / Kinder Morgan, Inc. | 0.02 | 0.00 | 0.75 | 1.0630 | 1.0630 | ||||
| PM / Philip Morris International Inc. | 0.01 | -77.55 | 0.75 | -80.60 | 1.0531 | 1.0531 | |||
| CSCO / Cisco Systems, Inc. | 0.03 | 0.00 | 0.72 | 1.0178 | 1.0178 | ||||
| GIL / Gildan Activewear Inc. | 0.02 | 0.00 | 0.69 | 0.9811 | 0.9811 | ||||
| T / AT&T Inc. | 0.02 | 0.00 | 0.68 | 0.9628 | 0.9628 | ||||
| CXW / CoreCivic, Inc. | 0.02 | 0.64 | 0.8978 | 0.8978 | |||||
| BX / Blackstone Inc. | 0.02 | 0.00 | 0.61 | 0.8611 | 0.8611 | ||||
| 22943FAD2 / Ctrip.com International, Ltd. Bond 1.250%10/1 | 0.60 | 0.0000 | |||||||
| US670008AD31 / NOVELLUS SYS INC Bond | 0.60 | -6.58 | 0.8414 | 0.3512 | |||||
| PPL / Pembina Pipeline Corporation | 0.02 | 0.00 | 0.60 | 0.8414 | 0.8414 | ||||
| APO / Apollo Global Management, Inc. | 0.03 | 0.58 | 0.8258 | 0.8258 | |||||
| GG / Goldcorp, Inc. | 0.03 | 0.00 | 0.57 | 0.8117 | 0.8117 | ||||
| COP / ConocoPhillips | 0.01 | 0.57 | 0.8089 | 0.8089 | |||||
| 595017AB0 / Microchip Technology Inc. 2.125% Convertible Bond due 2037-12-15 | 0.57 | -3.74 | 0.8004 | 0.3479 | |||||
| GIB / CGI Inc. | 0.01 | 0.00 | 0.56 | 0.7976 | 0.7976 | ||||
| CVS / CVS Health Corporation | 0.01 | 0.00 | 0.56 | 0.7863 | 0.7863 | ||||
| AEM / Agnico Eagle Mines Limited | 0.02 | 0.00 | 0.55 | 0.7750 | 0.7750 | ||||
| ORCL / Oracle Corporation | 0.01 | 0.00 | 0.55 | 0.7736 | 0.7736 | ||||
| 242309AB8 / DealerTrack Technologies, Inc. Bond | 0.55 | -51.08 | 0.7708 | -0.0866 | |||||
| SLFYF / Sun Life Financial, Inc. - 4.75% PRF PERPETUAL CAD 25 - Cls A Ser 1 | 0.02 | 0.00 | 0.54 | 0.7680 | 0.7680 | ||||
| MCK / McKesson Corporation | 0.00 | 0.00 | 0.54 | 0.7665 | 0.7665 | ||||
| ECL / Ecolab Inc. | 0.00 | 0.00 | 0.54 | 0.7651 | 0.7651 | ||||
| 929566AH0 / Wabash National Corp. Bond | 0.54 | 4.05 | 0.7623 | 0.3636 | |||||
| WFC / Wells Fargo & Company | 0.01 | 0.00 | 0.53 | 0.7454 | 0.7454 | ||||
| TAC / TransAlta Corporation | 0.05 | 0.00 | 0.49 | 0.6988 | 0.6988 | ||||
| Market Vectors High Yield Municipal Index ETF / ETF (57060U878) | 0.02 | 0.00 | 0.49 | 0.0000 | |||||
| AGU / Agrium Inc. | 0.00 | 0.00 | 0.49 | 0.6903 | 0.6903 | ||||
| HAL / Halliburton Company | 0.01 | 0.00 | 0.47 | 0.6649 | 0.6649 | ||||
| TXN / Texas Instruments Incorporated | 0.01 | 0.00 | 0.46 | 0.6451 | 0.6451 | ||||
| TECK.B / Teck Resources Limited | 0.03 | 0.00 | 0.44 | 0.6226 | 0.6226 | ||||
| VLO / Valero Energy Corporation | 0.01 | 0.00 | 0.44 | 0.6197 | 0.6197 | ||||
| MDT / Medtronic plc | 0.01 | 0.43 | 0.6056 | 0.6056 | |||||
| GE / General Electric Company | 0.02 | 0.00 | 0.43 | 0.6028 | 0.6028 | ||||
| AMP / Ameriprise Financial, Inc. | 0.00 | 0.42 | 0.5915 | 0.5915 | |||||
| BDX / Becton, Dickinson and Company | 0.00 | 0.00 | 0.42 | 0.5873 | 0.5873 | ||||
| TMO / Thermo Fisher Scientific Inc. | 0.00 | 0.00 | 0.42 | 0.5873 | 0.5873 | ||||
| JPM / JPMorgan Chase & Co. | 0.01 | 0.00 | 0.41 | 0.5816 | 0.5816 | ||||
| IVZ / Invesco Ltd. | 0.01 | 0.00 | 0.41 | 0.5774 | 0.5774 | ||||
| UNH / UnitedHealth Group Incorporated | 0.00 | 0.00 | 0.40 | 0.5675 | 0.5675 | ||||
| MS / Morgan Stanley | 0.01 | 0.39 | 0.5548 | 0.5548 | |||||
| DSGX / The Descartes Systems Group Inc. | 0.03 | 0.00 | 0.39 | 0.5449 | 0.5449 | ||||
| RPM / RPM International Inc. | 0.01 | 0.00 | 0.38 | 0.5350 | 0.5350 | ||||
| DIS / The Walt Disney Company | 0.00 | 0.00 | 0.38 | 0.5336 | 0.5336 | ||||
| HD / The Home Depot, Inc. | 0.00 | 0.38 | 0.5294 | 0.5294 | |||||
| 897888AB9 / Trulia Llc 2.75 15 Dec 20 Bond | 0.38 | 0.0000 | |||||||
| TAHO / Tahoe Resources Inc. | 0.03 | 0.00 | 0.37 | 0.5223 | 0.5223 | ||||
| VET / Vermilion Energy Inc. | 0.01 | 0.00 | 0.37 | 0.5209 | 0.5209 | ||||
| STN / Stantec Inc. | 0.01 | 0.00 | 0.35 | 0.4884 | 0.4884 | ||||
| LEN / Lennar Corporation | 0.01 | 0.34 | 0.4828 | 0.4828 | |||||
| AMGN / Amgen Inc. | 0.00 | -27.59 | 0.34 | -6.15 | 0.4743 | 0.2793 | |||
| BCE / BCE Inc. | 0.01 | 0.00 | 0.33 | 0.4715 | 0.4715 | ||||
| INTU / Intuit Inc. | 0.00 | 0.33 | 0.4644 | 0.4644 | |||||
| POT / Potash Corp. of Saskatchewan, Inc. | 0.01 | 0.00 | 0.33 | 0.4630 | 0.4630 | ||||
| SEE / Sealed Air Corporation | 0.01 | 0.31 | 0.4433 | 0.4433 | |||||
| AMAT / Applied Materials, Inc. | 0.01 | 0.00 | 0.31 | 0.4334 | 0.4334 | ||||
| HBM / Hudbay Minerals Inc. | 0.04 | 0.00 | 0.31 | 0.4334 | 0.4334 | ||||
| M / Macy's, Inc. | 0.00 | 0.00 | 0.30 | 0.4306 | 0.4306 | ||||
| G0083B108 / Actavis | 0.00 | 0.00 | 0.30 | 0.4207 | 0.4207 | ||||
| RHI / Robert Half Inc. | 0.00 | 0.00 | 0.30 | 0.4193 | 0.4193 | ||||
| SYK / Stryker Corporation | 0.00 | 0.00 | 0.28 | 0.3910 | 0.3910 | ||||
| PGF / Invesco Exchange-Traded Fund Trust - Invesco Financial Preferred ETF | 0.09 | 0.00 | 0.27 | 0.3812 | 0.3812 | ||||
| MSFT / Microsoft Corporation | 0.01 | 0.00 | 0.27 | 0.3783 | 0.3783 | ||||
| LMT / Lockheed Martin Corporation | 0.00 | 0.26 | 0.3727 | 0.3727 | |||||
| BEP / Brookfield Renewable Partners L.P. - Limited Partnership | 0.01 | 0.00 | 0.25 | 0.3557 | 0.3557 | ||||
| NUS / Nu Skin Enterprises, Inc. | 0.00 | 0.25 | 0.3529 | 0.3529 | |||||
| ETN / Eaton Corporation plc | 0.00 | 0.00 | 0.24 | 0.3459 | 0.3459 | ||||
| FNV / Franco-Nevada Corporation | 0.01 | -83.33 | 0.24 | -82.21 | 0.3416 | 0.3416 | |||
| JNJ / Johnson & Johnson | 0.00 | 0.24 | 0.3402 | 0.3402 | |||||
| WCN / Waste Connections, Inc. | 0.01 | 0.00 | 0.24 | 0.3388 | 0.3388 | ||||
| AWK / American Water Works Company, Inc. | 0.00 | 0.00 | 0.24 | 0.3346 | 0.3346 | ||||
| CPG / Veren Inc. | 0.01 | 0.00 | 0.24 | 0.3332 | 0.3332 | ||||
| WPM / Wheaton Precious Metals Corp. | 0.01 | 0.00 | 0.23 | 0.3219 | 0.3219 | ||||
| 91911K102 / Bausch Health Companies | 0.00 | 0.00 | 0.23 | 0.3205 | 0.3205 | ||||
| ADM / Archer-Daniels-Midland Company | 0.00 | 0.00 | 0.22 | 0.3049 | 0.3049 | ||||
| EMC / Global X Funds - Global X Emerging Markets Great Consumer ETF | 0.01 | -92.75 | 0.21 | -92.74 | 0.2993 | 0.2993 | |||
| TROW / T. Rowe Price Group, Inc. | 0.00 | 0.20 | 0.2866 | 0.2866 | |||||
| WAB / Westinghouse Air Brake Technologies Corporation | 0.00 | 0.00 | 0.19 | 0.2710 | 0.2710 | ||||
| CLS / Celestica Inc. | 0.02 | 0.00 | 0.18 | 0.2598 | 0.2598 | ||||
| HSIC / Henry Schein, Inc. | 0.00 | 0.00 | 0.17 | 0.2386 | 0.2386 | ||||
| XHB / SPDR Series Trust - SPDR S&P Homebuilders ETF | 0.00 | 0.17 | 0.2372 | 0.2372 | |||||
| MX / Magnachip Semiconductor Corporation | 0.00 | 0.16 | 0.2259 | 0.2259 | |||||
| / Delphi Technologies PLC | 0.00 | 0.00 | 0.15 | 0.2132 | 0.2132 | ||||
| VMC / Vulcan Materials Company | 0.00 | 0.00 | 0.15 | 0.2118 | 0.2118 | ||||
| PRGO / Perrigo Company plc | 0.00 | 0.00 | 0.15 | 0.2103 | 0.2103 | ||||
| WETF / Wisdomtree Investments Inc | 0.01 | 0.14 | 0.2033 | 0.2033 | |||||
| IMO / Imperial Oil Limited | 0.00 | 0.00 | 0.14 | 0.2033 | 0.2033 | ||||
| CSX / CSX Corporation | 0.00 | 0.00 | 0.13 | 0.1779 | 0.1779 | ||||
| SLB / Schlumberger Limited | 0.00 | 0.00 | 0.12 | 0.1765 | 0.1765 | ||||
| SYY / Sysco Corporation | 0.00 | 0.12 | 0.1708 | 0.1708 | |||||
| EOG / EOG Resources, Inc. | 0.00 | 0.00 | 0.12 | 0.1680 | 0.1680 | ||||
| 772739207 / Rock-Tenn | 0.00 | 0.00 | 0.12 | 0.1638 | 0.1638 | ||||
| CVE / Cenovus Energy Inc. | 0.01 | 0.00 | 0.11 | 0.1539 | 0.1539 | ||||
| 81762PAB8 / ServiceNow, Inc. Bond | 0.10 | 0.0000 | |||||||
| PSMT / PriceSmart, Inc. | 0.00 | 0.10 | 0.1383 | 0.1383 | |||||
| RGORF / Randgold Resources Ltd. | 0.00 | 0.00 | 0.10 | 0.1369 | 0.1369 | ||||
| SJRWF / Shaw Communications Inc. - Class A | 0.00 | 0.00 | 0.09 | 0.1271 | 0.1271 | ||||
| SWC / Stillwater Mining Company | 0.01 | 0.00 | 0.09 | 0.1228 | 0.1228 | ||||
| NVDA / NVIDIA Corporation | 0.00 | 0.00 | 0.09 | 0.1214 | 0.1214 | ||||
| PFE / Pfizer Inc. | 0.00 | 0.00 | 0.08 | 0.1172 | 0.1172 | ||||
| TSM / Taiwan Semiconductor Manufacturing Company Limited - Depositary Receipt (Common Stock) | 0.00 | 0.00 | 0.08 | 0.1129 | 0.1129 | ||||
| V / Visa Inc. | 0.00 | 0.08 | 0.1101 | 0.1101 | |||||
| COO / The Cooper Companies, Inc. | 0.00 | 0.00 | 0.08 | 0.1073 | 0.1073 | ||||
| BA / The Boeing Company | 0.00 | 0.07 | 0.1059 | 0.1059 | |||||
| CAH / Cardinal Health, Inc. | 0.00 | 0.07 | 0.1016 | 0.1016 | |||||
| DVN / Devon Energy Corporation | 0.00 | 0.00 | 0.07 | 0.1016 | 0.1016 | ||||
| NSC / Norfolk Southern Corporation | 0.00 | 0.00 | 0.07 | 0.1016 | 0.1016 | ||||
| NOC / Northrop Grumman Corporation | 0.00 | 0.06 | 0.0903 | 0.0903 | |||||
| CVX / Chevron Corporation | 0.00 | 0.00 | 0.06 | 0.0889 | 0.0889 | ||||
| USB / U.S. Bancorp | 0.00 | 0.00 | 0.06 | 0.0861 | 0.0861 | ||||
| ZBH / Zimmer Biomet Holdings, Inc. | 0.00 | 0.00 | 0.06 | 0.0833 | 0.0833 | ||||
| SRE / Sempra | 0.00 | 0.05 | 0.0762 | 0.0762 | |||||
| D / Dominion Energy, Inc. | 0.00 | 0.05 | 0.0706 | 0.0706 | |||||
| VMW / Vmware Inc. - Class A | 0.00 | 0.05 | 0.0692 | 0.0692 | |||||
| JCOM / J2 Global Inc. | 0.00 | 0.05 | 0.0649 | 0.0649 | |||||
| KO / The Coca-Cola Company | 0.00 | 0.00 | 0.04 | 0.0579 | 0.0579 | ||||
| BMY / Bristol-Myers Squibb Company | 0.00 | 0.00 | 0.04 | 0.0551 | 0.0551 | ||||
| VZ / Verizon Communications Inc. | 0.00 | 0.00 | 0.04 | 0.0551 | 0.0551 | ||||
| QSR / Restaurant Brands International Inc. | 0.00 | 0.03 | 0.0480 | 0.0480 | |||||
| ROK / Rockwell Automation, Inc. | 0.00 | 0.00 | 0.02 | 0.0325 | 0.0325 | ||||
| BRK.B / Berkshire Hathaway Inc. | 0.00 | 0.00 | 0.02 | 0.0311 | 0.0311 | ||||
| YRI / Yamana Gold Inc | 0.00 | 0.00 | 0.00 | 0.0056 | 0.0056 | ||||
| ECA / EnCana Corp. | 0.00 | 0.00 | 0.00 | 0.0056 | 0.0056 |