Mga Batayang Estadistika
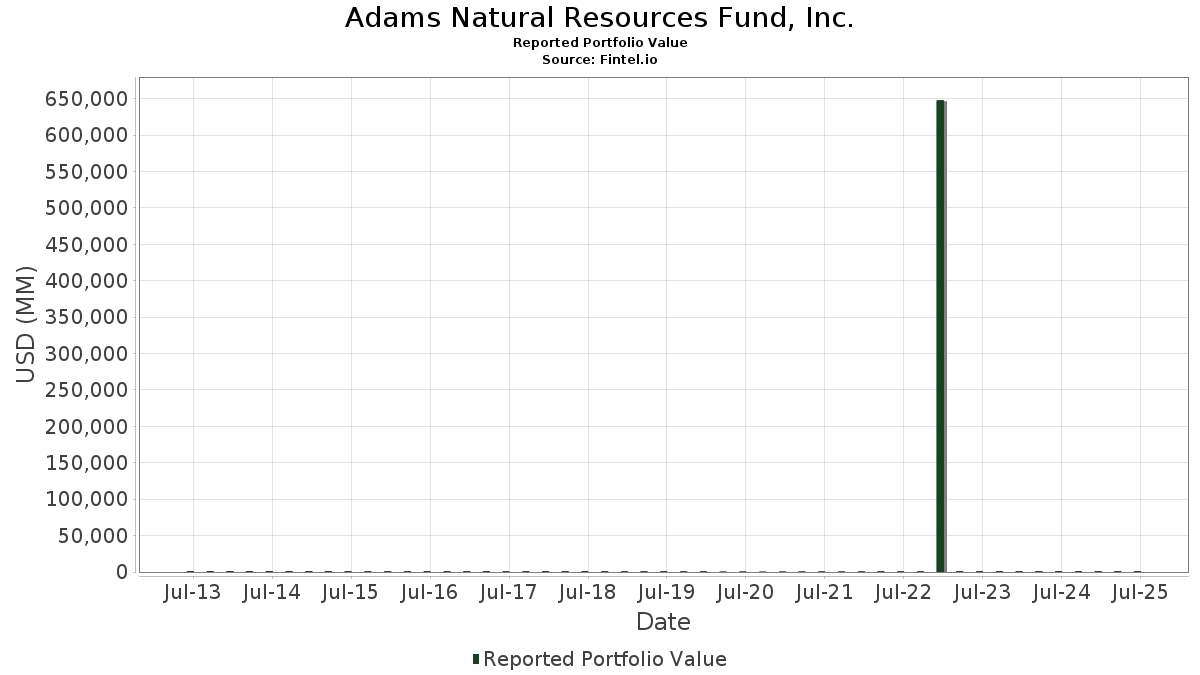
| Nilai Portofolio | $ 634,995,494 |
| Posisi Saat Ini | 57 |
Kepemilikan Terbaru, Kinerja, AUM (dari 13F, 13D)
Adams Natural Resources Fund, Inc. telah mengungkapkan total kepemilikan 57 dalam pengajuan SEC terbaru mereka. Nilai portofolio terbaru dihitung sebesar $ 634,995,494 USD. Aset yang Dikelola (AUM) sebenarnya adalah nilai ini ditambah kas (yang tidak diungkapkan). Aset-aset utama Adams Natural Resources Fund, Inc. adalah Exxon Mobil Corporation (US:XOM) , Chevron Corporation (US:CVX) , ConocoPhillips (US:COP) , Linde plc (US:LIN) , and EOG Resources, Inc. (US:EOG) .
Peningkatan Tertinggi Kuartal Ini
Kami menggunakan perubahan dalam alokasi portofolio karena ini adalah metrik yang paling bermakna. Perubahan dapat disebabkan oleh perdagangan atau perubahan harga saham.
| Keamanan | Saham (MM) |
Nilai (Juta Dolar AS) |
Portfolio % | ΔPorsyento ng Portfolio |
|---|
Penurunan Tertinggi Kuartal Ini
Kami menggunakan perubahan dalam alokasi portofolio karena ini adalah metrik yang paling bermakna. Perubahan dapat disebabkan oleh perdagangan atau perubahan harga saham.
| Keamanan | Saham (MM) |
Nilai (Juta Dolar AS) |
Portfolio % | ΔPorsyento ng Portfolio |
|---|---|---|---|---|
| 1.34 | 144.16 | 0.2271 | -22.6123 | |
| 0.51 | 73.14 | 0.1152 | -11.4723 | |
| 0.37 | 33.64 | 0.0530 | -5.2774 | |
| 0.06 | 29.84 | 0.0470 | -4.6807 | |
| 0.20 | 23.81 | 0.0375 | -3.7349 | |
| 0.37 | 22.95 | 0.0362 | -3.5996 | |
| 0.64 | 18.70 | 0.0295 | -2.9339 | |
| 0.13 | 18.65 | 0.0294 | -2.9248 | |
| 0.15 | 17.68 | 0.0278 | -2.7729 | |
| 0.10 | 17.33 | 0.0273 | -2.7180 |
Pengajuan 13F dan Dana
Formulir ini diajukan pada 2025-08-26 untuk periode pelaporan 2025-06-30. Klik ikon tautan untuk melihat riwayat transaksi selengkapnya.
Tingkatkan ke versi premium untuk membuka data premium dan ekspor ke Excel. ![]() .
.
| Keamanan | Ketik | Harga Saham Rata-rata | Saham (MM) |
ΔSaham (%) |
ΔSaham (%) |
Nilai ($MM) |
Portpolyo (%) |
ΔPortofolio (%) |
|
|---|---|---|---|---|---|---|---|---|---|
| XOM / Exxon Mobil Corporation | 1.34 | 0.00 | 144.16 | 0.00 | 0.2271 | -22.6123 | |||
| CVX / Chevron Corporation | 0.51 | 0.00 | 73.14 | 0.00 | 0.1152 | -11.4723 | |||
| COP / ConocoPhillips | 0.37 | 0.00 | 33.64 | 0.00 | 0.0530 | -5.2774 | |||
| LIN / Linde plc | 0.06 | 0.00 | 29.84 | 0.00 | 0.0470 | -4.6807 | |||
| EOG / EOG Resources, Inc. | 0.20 | 0.00 | 23.81 | 0.00 | 0.0375 | -3.7349 | |||
| WMB / The Williams Companies, Inc. | 0.37 | 0.00 | 22.95 | 0.00 | 0.0362 | -3.5996 | |||
| KMI / Kinder Morgan, Inc. | 0.64 | 0.00 | 18.70 | 0.00 | 0.0295 | -2.9339 | |||
| HES / Hess Corporation | 0.13 | 0.00 | 18.65 | 0.00 | 0.0294 | -2.9248 | |||
| PSX / Phillips 66 | 0.15 | 0.00 | 17.68 | 0.00 | 0.0278 | -2.7729 | |||
| MPC / Marathon Petroleum Corporation | 0.10 | 0.00 | 17.33 | 0.00 | 0.0273 | -2.7180 | |||
| TRGP / Targa Resources Corp. | 0.08 | 0.00 | 14.50 | 0.00 | 0.0228 | -2.2746 | |||
| BKR / Baker Hughes Company | 0.38 | 0.00 | 14.45 | 0.00 | 0.0228 | -2.2667 | |||
| OKE / ONEOK, Inc. | 0.17 | 0.00 | 14.20 | 0.00 | 0.0224 | -2.2280 | |||
| SHW / The Sherwin-Williams Company | 0.04 | 0.00 | 13.15 | 0.00 | 0.0207 | -2.0628 | |||
| EXE / Expand Energy Corporation | 0.11 | 0.00 | 12.71 | 0.00 | 0.0200 | -1.9939 | |||
| SLB / Schlumberger Limited | 0.37 | 0.00 | 12.48 | 0.00 | 0.0197 | -1.9576 | |||
| ECL / Ecolab Inc. | 0.04 | 0.00 | 12.12 | 0.00 | 0.0191 | -1.9019 | |||
| FCX / Freeport-McMoRan Inc. | 0.25 | 0.00 | 10.77 | 0.00 | 0.0170 | -1.6891 | |||
| VLO / Valero Energy Corporation | 0.08 | 0.00 | 10.53 | 0.00 | 0.0166 | -1.6510 | |||
| DVN / Devon Energy Corporation | 0.30 | 0.00 | 9.63 | 0.00 | 0.0152 | -1.5109 | |||
| NEM / Newmont Corporation | 0.13 | 0.00 | 7.39 | 0.00 | 0.0116 | -1.1588 | |||
| VMC / Vulcan Materials Company | 0.03 | 0.00 | 7.02 | 0.00 | 0.0111 | -1.1005 | |||
| CTVA / Corteva, Inc. | 0.09 | 0.00 | 6.85 | 0.00 | 0.0108 | -1.0749 | |||
| EQT / EQT Corporation | 0.11 | 0.00 | 6.53 | 0.00 | 0.0103 | -1.0237 | |||
| CTRA / Coterra Energy Inc. | 0.23 | 0.00 | 5.94 | 0.00 | 0.0094 | -0.9312 | |||
| APD / Air Products and Chemicals, Inc. | 0.02 | 0.00 | 5.90 | 0.00 | 0.0093 | -0.9247 | |||
| TPL / Texas Pacific Land Corporation | 0.01 | 0.00 | 5.76 | 0.00 | 0.0091 | -0.9031 | |||
| OXY / Occidental Petroleum Corporation | 0.13 | 0.00 | 5.42 | 0.00 | 0.0085 | -0.8497 | |||
| FANG / Diamondback Energy, Inc. | 0.04 | 0.00 | 4.93 | 0.00 | 0.0078 | -0.7737 | |||
| CF / CF Industries Holdings, Inc. | 0.05 | 0.00 | 4.74 | 0.00 | 0.0075 | -0.7442 | |||
| DD / DuPont de Nemours, Inc. | 0.06 | 0.00 | 3.89 | 0.00 | 0.0061 | -0.6103 | |||
| HAL / Halliburton Company | 0.18 | 0.00 | 3.57 | 0.00 | 0.0056 | -0.5606 | |||
| CCK / Crown Holdings, Inc. | 0.03 | 0.00 | 3.34 | 0.00 | 0.0053 | -0.5234 | |||
| US61747C7157 / Morgan Stanley Institutional Liquidity Funds - Prime Portfolio | 3.30 | -10.82 | 3.30 | -10.84 | 0.0052 | -0.5358 | |||
| LNG / Cheniere Energy, Inc. | 0.01 | 0.00 | 3.24 | 0.00 | 0.0051 | -0.5080 | |||
| CNQ / Canadian Natural Resources Limited | 0.10 | 0.00 | 3.05 | 0.00 | 0.0048 | -0.4778 | |||
| MLM / Martin Marietta Materials, Inc. | 0.01 | 0.00 | 2.96 | 0.00 | 0.0047 | -0.4650 | |||
| NUE / Nucor Corporation | 0.02 | 0.00 | 2.93 | 0.00 | 0.0046 | -0.4592 | |||
| EMN / Eastman Chemical Company | 0.03 | 0.00 | 2.47 | 0.00 | 0.0039 | -0.3876 | |||
| FTI / TechnipFMC plc | 0.06 | 0.00 | 2.16 | 0.00 | 0.0034 | -0.3393 | |||
| PPG / PPG Industries, Inc. | 0.02 | 0.00 | 2.06 | 0.00 | 0.0032 | -0.3230 | |||
| IP / International Paper Company | 0.04 | 0.00 | 1.92 | 0.00 | 0.0030 | -0.3004 | |||
| SW / Smurfit Westrock Plc | 0.04 | 0.00 | 1.78 | 0.00 | 0.0028 | -0.2795 | |||
| DOW / Dow Inc. | 0.06 | 0.00 | 1.69 | 0.00 | 0.0027 | -0.2656 | |||
| STLD / Steel Dynamics, Inc. | 0.01 | 0.00 | 1.60 | 0.00 | 0.0025 | -0.2515 | |||
| IFF / International Flavors & Fragrances Inc. | 0.02 | 0.00 | 1.49 | 0.00 | 0.0023 | -0.2331 | |||
| PKG / Packaging Corporation of America | 0.01 | 0.00 | 1.39 | 0.00 | 0.0022 | -0.2187 | |||
| BALL / Ball Corporation | 0.02 | 0.00 | 1.31 | 0.00 | 0.0021 | -0.2050 | |||
| LYB / LyondellBasell Industries N.V. | 0.02 | 0.00 | 1.19 | 0.00 | 0.0019 | -0.1870 | |||
| AVY / Avery Dennison Corporation | 0.01 | 0.00 | 1.11 | 0.00 | 0.0017 | -0.1734 | |||
| APA / APA Corporation | 0.06 | 0.00 | 1.02 | 0.00 | 0.0016 | -0.1607 | |||
| AMCR / Amcor plc | 0.09 | 0.00 | 0.85 | 0.00 | 0.0013 | -0.1332 | |||
| MOS / The Mosaic Company | 0.02 | 0.00 | 0.77 | 0.00 | 0.0012 | -0.1213 | |||
| NITXX / Northern Institutional Funds - Northern Institutional Treasury Portfolio | 0.52 | 47.59 | 0.52 | 47.74 | 0.0008 | -0.0511 | |||
| ALB / Albemarle Corporation | 0.01 | 0.00 | 0.45 | 0.00 | 0.0007 | -0.0708 | |||
| CHRD / Chord Energy Corporation | 0.00 | 0.00 | 0.02 | 0.00 | 0.0000 | -0.0034 | |||
| WLLBW / Chord Energy Corporation - Equity Warrant | 0.00 | 0.00 | 0.00 | -100.00 | 0.0000 | -0.0004 |