Mga Batayang Estadistika
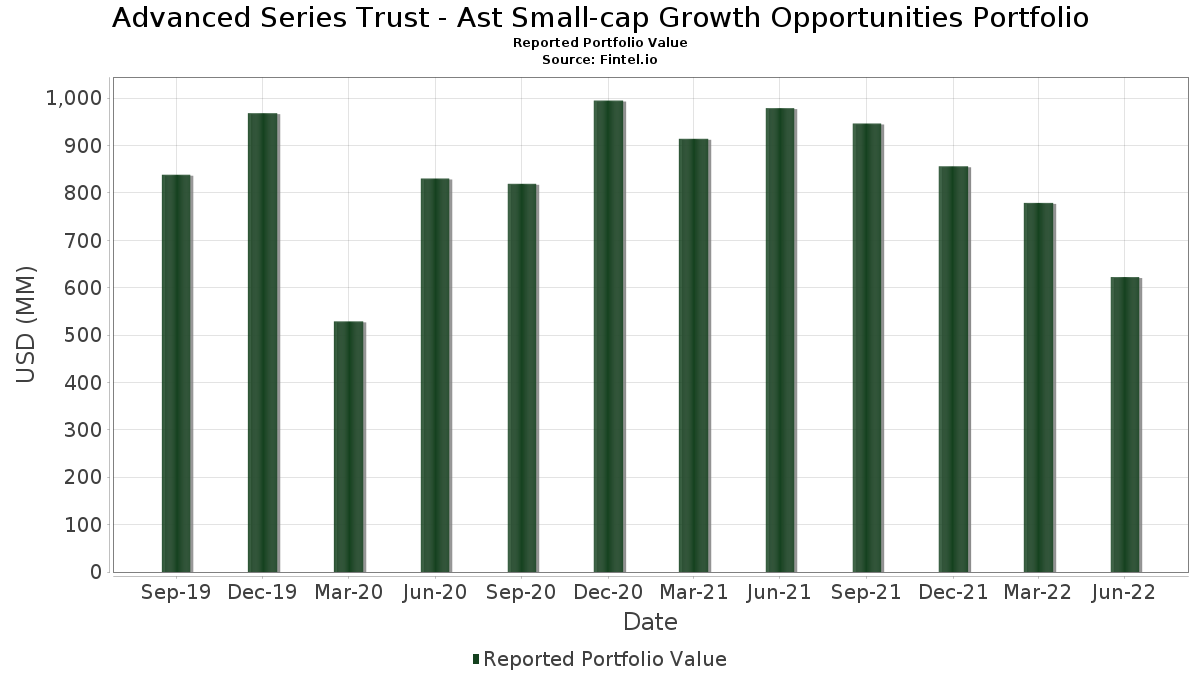
| Nilai Portofolio | $ 622,340,039 |
| Posisi Saat Ini | 216 |
Kepemilikan Terbaru, Kinerja, AUM (dari 13F, 13D)
Advanced Series Trust - Ast Small-cap Growth Opportunities Portfolio telah mengungkapkan total kepemilikan 216 dalam pengajuan SEC terbaru mereka. Nilai portofolio terbaru dihitung sebesar $ 622,340,039 USD. Aset yang Dikelola (AUM) sebenarnya adalah nilai ini ditambah kas (yang tidak diungkapkan). Aset-aset utama Advanced Series Trust - Ast Small-cap Growth Opportunities Portfolio adalah Vanguard Index Funds - Vanguard Small-Cap Growth ETF (US:VBK) , Dreyfus Government Cash Management Funds - Dreyfus Government Cash Management Fund Institutional Shares (US:DGCXX) , Chart Industries, Inc. (US:GTLS) , Applied Industrial Technologies, Inc. (US:AIT) , and Rexnord Corp (US:RXN) . Posisi baru Advanced Series Trust - Ast Small-cap Growth Opportunities Portfolio meliputi: Helmerich & Payne, Inc. (US:HP) , Chord Energy Corporation - Equity Warrant (US:WLLAW) , Phillips Edison & Company, Inc. (US:PECO) , SM Energy Company (US:SM) , and World Wrestling Entertainment, Inc. - Class A (US:WWE) .
Peningkatan Tertinggi Kuartal Ini
Kami menggunakan perubahan dalam alokasi portofolio karena ini adalah metrik yang paling bermakna. Perubahan dapat disebabkan oleh perdagangan atau perubahan harga saham.
| Keamanan | Saham (MM) |
Nilai (Juta Dolar AS) |
Portfolio % | ΔPorsyento ng Portfolio |
|---|---|---|---|---|
| 142.71 | 142.58 | 29.9487 | 28.9727 | |
| 9.07 | 9.07 | 1.9047 | 1.1463 | |
| 0.08 | 4.46 | 0.9374 | 0.6562 | |
| 0.06 | 2.73 | 0.5743 | 0.5743 | |
| 0.04 | 2.91 | 0.6103 | 0.5422 | |
| 0.04 | 2.54 | 0.5334 | 0.5334 | |
| 0.06 | 6.00 | 1.2612 | 0.5307 | |
| 0.07 | 2.50 | 0.5255 | 0.5255 | |
| 0.07 | 2.41 | 0.5065 | 0.5065 | |
| 5.46 | 5.46 | 1.1461 | 0.4982 |
Penurunan Tertinggi Kuartal Ini
Kami menggunakan perubahan dalam alokasi portofolio karena ini adalah metrik yang paling bermakna. Perubahan dapat disebabkan oleh perdagangan atau perubahan harga saham.
| Keamanan | Saham (MM) |
Nilai (Juta Dolar AS) |
Portfolio % | ΔPorsyento ng Portfolio |
|---|---|---|---|---|
| 0.00 | 0.00 | -1.1810 | ||
| 0.00 | 0.00 | -0.6807 | ||
| 0.07 | 0.17 | 0.0347 | -0.6751 | |
| 0.02 | 1.26 | 0.2656 | -0.5515 | |
| 0.16 | 4.66 | 0.9797 | -0.5438 | |
| 0.05 | 2.57 | 0.5394 | -0.4987 | |
| 0.01 | 0.56 | 0.1185 | -0.4298 | |
| 0.07 | 3.30 | 0.6922 | -0.3538 | |
| 0.02 | 2.33 | 0.4893 | -0.3330 | |
| 0.06 | 0.97 | 0.2028 | -0.2916 |
Pengajuan 13F dan Dana
Formulir ini diajukan pada 2022-08-19 untuk periode pelaporan 2022-06-30. Klik ikon tautan untuk melihat riwayat transaksi selengkapnya.
Tingkatkan ke versi premium untuk membuka data premium dan ekspor ke Excel. ![]() .
.
| Keamanan | Ketik | Harga Saham Rata-rata | Saham (MM) |
ΔSaham (%) |
ΔSaham (%) |
Nilai ($MM) |
Portpolyo (%) |
ΔPortofolio (%) |
|
|---|---|---|---|---|---|---|---|---|---|
| PGIM Institutional Money Market Fund - D / STIV (000000000) | 142.71 | 1,994.06 | 142.58 | 1,992.21 | 29.9487 | 28.9727 | |||
| VBK / Vanguard Index Funds - Vanguard Small-Cap Growth ETF | 0.05 | -2.11 | 10.61 | -22.27 | 2.2279 | 0.0158 | |||
| DGCXX / Dreyfus Government Cash Management Funds - Dreyfus Government Cash Management Fund Institutional Shares | 9.07 | 93.82 | 9.07 | 93.84 | 1.9047 | 1.1463 | |||
| GTLS / Chart Industries, Inc. | 0.04 | -2.00 | 7.04 | -4.51 | 1.4779 | 0.2835 | |||
| AIT / Applied Industrial Technologies, Inc. | 0.06 | 42.24 | 6.00 | 33.24 | 1.2612 | 0.5307 | |||
| RXN / Rexnord Corp | 0.20 | -2.15 | 5.48 | -24.70 | 1.1517 | -0.0288 | |||
| US61747C7074 / Morgan Stanley Institutional Liquidity Funds Government Portfolio, Institutional Class | 5.46 | 36.53 | 5.46 | 36.54 | 1.1461 | 0.4982 | |||
| RCM / R1 RCM Inc. | 0.24 | -12.95 | 4.97 | -31.82 | 1.0434 | -0.1376 | |||
| WSC / WillScot Holdings Corporation | 0.15 | -25.01 | 4.92 | -37.88 | 1.0344 | -0.2506 | |||
| SPT / Sprout Social, Inc. | 0.08 | 41.70 | 4.74 | 2.69 | 0.9948 | 0.2472 | |||
| VRNS / Varonis Systems, Inc. | 0.16 | -19.53 | 4.66 | -50.37 | 0.9797 | -0.5438 | |||
| CACI / CACI International Inc | 0.02 | -3.91 | 4.61 | -10.12 | 0.9680 | 0.1368 | |||
| WING / Wingstop Inc. | 0.06 | 3.11 | 4.48 | -34.30 | 0.9416 | -0.1645 | |||
| TXRH / Texas Roadhouse, Inc. | 0.06 | -3.96 | 4.48 | -16.04 | 0.9409 | 0.0760 | |||
| ITCI / Intra-Cellular Therapies, Inc. | 0.08 | 175.78 | 4.46 | 157.32 | 0.9374 | 0.6562 | |||
| PFGC / Performance Food Group Company | 0.10 | -12.52 | 4.44 | -20.99 | 0.9331 | 0.0216 | |||
| VRRM / Verra Mobility Corporation | 0.28 | -3.96 | 4.41 | -7.32 | 0.9254 | 0.1547 | |||
| YETI / YETI Holdings, Inc. | 0.10 | 22.56 | 4.31 | -11.60 | 0.9063 | 0.1152 | |||
| SMPL / The Simply Good Foods Company | 0.11 | 4.97 | 4.27 | 4.48 | 0.8968 | 0.2343 | |||
| OMCL / Omnicell, Inc. | 0.04 | -6.89 | 4.19 | -18.22 | 0.8798 | 0.0496 | |||
| DOCN / DigitalOcean Holdings, Inc. | 0.10 | 13.60 | 4.18 | -18.79 | 0.8781 | 0.0437 | |||
| EXLS / ExlService Holdings, Inc. | 0.03 | -10.19 | 4.11 | -7.64 | 0.8639 | 0.1420 | |||
| PRFT / Perficient, Inc. | 0.04 | -7.82 | 4.09 | -23.23 | 0.8595 | -0.0045 | |||
| OLLI / Ollie's Bargain Outlet Holdings, Inc. | 0.07 | 18.87 | 4.08 | 62.56 | 0.8564 | 0.4498 | |||
| IWO / iShares Trust - iShares Russell 2000 Growth ETF | 0.02 | -6.82 | 3.98 | -24.84 | 0.8365 | -0.0224 | |||
| ASGN / ASGN Incorporated | 0.04 | -14.17 | 3.94 | -33.64 | 0.8285 | -0.1350 | |||
| MTSI / MACOM Technology Solutions Holdings, Inc. | 0.08 | -2.24 | 3.90 | -24.74 | 0.8187 | -0.0207 | |||
| JBT / JBT Marel Corporation | 0.03 | -20.84 | 3.83 | -26.22 | 0.8044 | -0.0370 | |||
| POWI / Power Integrations, Inc. | 0.05 | -3.93 | 3.81 | -22.24 | 0.8004 | 0.0059 | |||
| CNXC / Concentrix Corporation | 0.03 | -4.05 | 3.78 | -21.86 | 0.7944 | 0.0098 | |||
| APLS / Apellis Pharmaceuticals, Inc. | 0.08 | -16.03 | 3.68 | -25.27 | 0.7722 | -0.0253 | |||
| AQUA / Evoqua Water Technologies Corp | 0.11 | 5.86 | 3.51 | -26.75 | 0.7369 | -0.0395 | |||
| MANH / Manhattan Associates, Inc. | 0.03 | 12.05 | 3.46 | -7.43 | 0.7273 | 0.1209 | |||
| NSP / Insperity, Inc. | 0.03 | -3.64 | 3.36 | -4.21 | 0.7068 | 0.1373 | |||
| LSCC / Lattice Semiconductor Corporation | 0.07 | -35.81 | 3.30 | -48.93 | 0.6922 | -0.3538 | |||
| IRT / Independence Realty Trust, Inc. | 0.16 | -18.62 | 3.27 | -36.21 | 0.6877 | -0.1442 | |||
| JCOM / J2 Global Inc. | 0.04 | -3.83 | 3.27 | -25.95 | 0.6859 | -0.0289 | |||
| RHP / Ryman Hospitality Properties, Inc. | 0.04 | -3.97 | 3.26 | -21.30 | 0.6838 | 0.0133 | |||
| AEIS / Advanced Energy Industries, Inc. | 0.04 | -24.29 | 3.21 | -35.81 | 0.6745 | -0.1365 | |||
| WNS / WNS (Holdings) Limited | 0.04 | -4.46 | 3.20 | -16.59 | 0.6719 | 0.0502 | |||
| SLAB / Silicon Laboratories Inc. | 0.02 | 80.30 | 3.17 | 68.28 | 0.6664 | 0.3609 | |||
| OMI / Owens & Minor, Inc. | 0.10 | 5.74 | 3.13 | -24.47 | 0.6570 | -0.0142 | |||
| FOXF / Fox Factory Holding Corp. | 0.04 | -29.09 | 3.09 | -41.70 | 0.6496 | -0.2103 | |||
| RPD / Rapid7, Inc. | 0.05 | -3.91 | 3.08 | -42.30 | 0.6476 | -0.2186 | |||
| IART / Integra LifeSciences Holdings Corporation | 0.06 | -3.55 | 3.07 | -18.90 | 0.6453 | 0.0312 | |||
| GMED / Globus Medical, Inc. | 0.05 | 9.06 | 3.06 | -17.02 | 0.6420 | 0.0449 | |||
| CHDN / Churchill Downs Incorporated | 0.02 | -11.66 | 3.04 | -23.73 | 0.6383 | -0.0075 | |||
| US7846351044 / SPX Corp | 0.06 | -2.35 | 3.03 | 4.42 | 0.6359 | 0.1659 | |||
| KRTX / Karuna Therapeutics, Inc. | 0.02 | 54.38 | 3.02 | 54.06 | 0.6334 | 0.3161 | |||
| SYNA / Synaptics Incorporated | 0.03 | 23.30 | 3.01 | -27.03 | 0.6312 | -0.0365 | |||
| MGY / Magnolia Oil & Gas Corporation | 0.14 | -3.34 | 2.99 | -14.22 | 0.6286 | 0.0631 | |||
| INSP / Inspire Medical Systems, Inc. | 0.02 | 9.36 | 2.97 | -22.17 | 0.6231 | 0.0052 | |||
| LITE / Lumentum Holdings Inc. | 0.04 | -1.64 | 2.96 | -19.96 | 0.6227 | 0.0222 | |||
| SKIN / The Beauty Health Company | 0.23 | 5.10 | 2.94 | -19.92 | 0.6172 | 0.0223 | |||
| AXTA / Axalta Coating Systems Ltd. | 0.13 | -3.92 | 2.93 | -13.58 | 0.6164 | 0.0660 | |||
| FN / Fabrinet | 0.04 | 795.73 | 2.91 | 591.67 | 0.6103 | 0.5422 | |||
| OVV / Ovintiv Inc. | 0.07 | -2.89 | 2.88 | -20.63 | 0.6046 | 0.0166 | |||
| SOVO / Sovos Brands, Inc. | 0.18 | -1.99 | 2.83 | 9.70 | 0.5939 | 0.1760 | |||
| ACLS / Axcelis Technologies, Inc. | 0.05 | -4.03 | 2.82 | -30.33 | 0.5926 | -0.0638 | |||
| CW / Curtiss-Wright Corporation | 0.02 | -2.26 | 2.81 | -14.07 | 0.5904 | 0.0603 | |||
| GOLF / Acushnet Holdings Corp. | 0.07 | 16.26 | 2.77 | 20.35 | 0.5815 | 0.2086 | |||
| BLD / TopBuild Corp. | 0.02 | -3.98 | 2.76 | -11.53 | 0.5801 | 0.0741 | |||
| MTG / MGIC Investment Corporation | 0.22 | -3.23 | 2.76 | -10.03 | 0.5788 | 0.0824 | |||
| EPRT / Essential Properties Realty Trust, Inc. | 0.13 | -14.14 | 2.75 | -27.08 | 0.5777 | -0.0337 | |||
| HP / Helmerich & Payne, Inc. | 0.06 | 2.73 | 0.5743 | 0.5743 | |||||
| NSIT / Insight Enterprises, Inc. | 0.03 | -13.44 | 2.68 | -30.41 | 0.5625 | -0.0614 | |||
| SF / Stifel Financial Corp. | 0.05 | -3.73 | 2.62 | -20.59 | 0.5509 | 0.0156 | |||
| LANC / Lancaster Colony Corporation | 0.02 | -1.52 | 2.58 | -14.96 | 0.5411 | 0.0500 | |||
| BLKB / Blackbaud, Inc. | 0.04 | -2.43 | 2.58 | -5.37 | 0.5409 | 0.0998 | |||
| FRPT / Freshpet, Inc. | 0.05 | -20.68 | 2.57 | -59.90 | 0.5394 | -0.4987 | |||
| LTHM / Livent Corporation | 0.11 | -46.63 | 2.55 | 41.68 | 0.5363 | 0.3083 | |||
| ALRM / Alarm.com Holdings, Inc. | 0.04 | -1.57 | 2.55 | -8.37 | 0.5357 | 0.0844 | |||
| LHCG / LHC Group Inc | 0.02 | -35.41 | 2.54 | -40.35 | 0.5343 | -0.1568 | |||
| OMF / OneMain Holdings, Inc. | 0.07 | -4.41 | 2.54 | -24.64 | 0.5340 | -0.0129 | |||
| WLLAW / Chord Energy Corporation - Equity Warrant | 0.04 | 2.54 | 0.5334 | 0.5334 | |||||
| EXPO / Exponent, Inc. | 0.03 | -6.14 | 2.54 | -20.56 | 0.5332 | 0.0153 | |||
| ITT / ITT Inc. | 0.04 | -2.33 | 2.53 | -12.69 | 0.5317 | 0.0617 | |||
| DECK / Deckers Outdoor Corporation | 0.01 | 2.04 | 2.52 | -4.83 | 0.5294 | 0.1001 | |||
| CWST / Casella Waste Systems, Inc. | 0.03 | -3.30 | 2.51 | -19.81 | 0.5264 | 0.0197 | |||
| PECO / Phillips Edison & Company, Inc. | 0.07 | 2.50 | 0.5255 | 0.5255 | |||||
| MTDR / Matador Resources Company | 0.05 | -8.74 | 2.50 | -19.77 | 0.5253 | 0.0201 | |||
| HQY / HealthEquity, Inc. | 0.04 | -20.33 | 2.49 | -27.48 | 0.5229 | -0.0336 | |||
| HAE / Haemonetics Corporation | 0.04 | 93.72 | 2.41 | 41.03 | 0.5069 | 0.2446 | |||
| SM / SM Energy Company | 0.07 | 2.41 | 0.5065 | 0.5065 | |||||
| PATK / Patrick Industries, Inc. | 0.05 | -1.98 | 2.40 | -15.74 | 0.5049 | 0.0425 | |||
| TTEK / Tetra Tech, Inc. | 0.02 | -44.53 | 2.33 | -54.08 | 0.4893 | -0.3330 | |||
| CRUS / Cirrus Logic, Inc. | 0.03 | -9.71 | 2.31 | -22.77 | 0.4848 | 0.0004 | |||
| TBK / Triumph Bancorp Inc | 0.04 | -3.22 | 2.31 | -35.61 | 0.4847 | -0.0962 | |||
| SNV / Synovus Financial Corp. | 0.06 | -1.63 | 2.29 | -27.62 | 0.4817 | -0.0320 | |||
| AWI / Armstrong World Industries, Inc. | 0.03 | -2.40 | 2.28 | -18.70 | 0.4785 | 0.0242 | |||
| ACHC / Acadia Healthcare Company, Inc. | 0.03 | 197.84 | 2.24 | 207.55 | 0.4705 | 0.3523 | |||
| RPAY / Repay Holdings Corporation | 0.17 | -3.12 | 2.23 | -15.70 | 0.4690 | 0.0395 | |||
| BMBL / Bumble Inc. | 0.08 | -1.04 | 2.23 | -3.84 | 0.4678 | 0.0922 | |||
| WTFC / Wintrust Financial Corporation | 0.03 | 14.07 | 2.22 | -1.64 | 0.4667 | 0.1006 | |||
| BPMC / Blueprint Medicines Corporation | 0.04 | 15.77 | 2.19 | -8.44 | 0.4600 | 0.0722 | |||
| PTCT / PTC Therapeutics, Inc. | 0.05 | -13.82 | 2.18 | -7.45 | 0.4569 | 0.0758 | |||
| NARI / Inari Medical, Inc. | 0.03 | 4.68 | 2.15 | -21.47 | 0.4525 | 0.0077 | |||
| THO / THOR Industries, Inc. | 0.03 | -20.30 | 2.15 | -24.33 | 0.4509 | -0.0089 | |||
| CROX / Crocs, Inc. | 0.04 | 16.30 | 2.13 | -25.91 | 0.4464 | -0.0186 | |||
| NVRO / Nevro Corp. | 0.05 | 4.47 | 2.12 | -36.70 | 0.4449 | -0.0975 | |||
| CYTK / Cytokinetics, Incorporated | 0.05 | -29.18 | 2.08 | -24.41 | 0.4365 | -0.0092 | |||
| MCW / Mister Car Wash, Inc. | 0.19 | 1.39 | 2.07 | -25.42 | 0.4358 | -0.0151 | |||
| WWE / World Wrestling Entertainment, Inc. - Class A | 0.03 | 2.06 | 0.4325 | 0.4325 | |||||
| FOUR / Shift4 Payments, Inc. | 0.06 | 17.78 | 2.05 | -37.14 | 0.4303 | -0.0979 | |||
| CVET / Covetrus Inc | 0.10 | -4.86 | 2.04 | 17.59 | 0.4284 | 0.1472 | |||
| / BELLRING BRANDS INC 0.00000000 | 0.08 | 2.04 | 0.4283 | 0.4283 | |||||
| FIVN / Five9, Inc. | 0.02 | 49.34 | 2.01 | 23.26 | 0.4232 | 0.1583 | |||
| GKOS / Glaukos Corporation | 0.04 | 0.31 | 2.01 | -21.23 | 0.4226 | 0.0087 | |||
| PCRX / Pacira BioSciences, Inc. | 0.03 | -0.36 | 2.01 | -23.86 | 0.4216 | -0.0059 | |||
| ARVN / Arvinas, Inc. | 0.05 | 30.16 | 2.01 | -18.62 | 0.4215 | 0.0219 | |||
| TENB / Tenable Holdings, Inc. | 0.04 | 71.66 | 1.98 | 34.90 | 0.4165 | 0.1782 | |||
| ELF / e.l.f. Beauty, Inc. | 0.06 | -58.06 | 1.88 | -50.17 | 0.3943 | -0.2165 | |||
| CLH / Clean Harbors, Inc. | 0.02 | 3.49 | 1.86 | -18.75 | 0.3906 | 0.0197 | |||
| WAL / Western Alliance Bancorporation | 0.03 | -3.40 | 1.85 | -17.64 | 0.3884 | 0.0244 | |||
| / Voya Prime Rate Trust | 0.07 | 3.92 | 1.85 | -14.58 | 0.3877 | 0.0375 | |||
| SGRY / Surgery Partners, Inc. | 0.06 | -3.22 | 1.81 | -49.16 | 0.3796 | -0.1966 | |||
| HALO / Halozyme Therapeutics, Inc. | 0.04 | 1.80 | 0.3773 | 0.3773 | |||||
| BCRX / BioCryst Pharmaceuticals, Inc. | 0.17 | 46.83 | 1.79 | -4.48 | 0.3761 | 0.0723 | |||
| BJRI / BJ's Restaurants, Inc. | 0.08 | -11.57 | 1.78 | -32.25 | 0.3729 | -0.0519 | |||
| CYRX / Cryoport, Inc. | 0.06 | -8.59 | 1.77 | -18.89 | 0.3717 | 0.0180 | |||
| JAMF / Jamf Holding Corp. | 0.07 | 14.36 | 1.75 | -18.62 | 0.3672 | 0.0189 | |||
| PDCE / PDC Energy Inc | 0.03 | -5.50 | 1.74 | -19.90 | 0.3662 | 0.0134 | |||
| GO / Grocery Outlet Holding Corp. | 0.04 | 1.73 | 0.3630 | 0.3630 | |||||
| SWAV / Shockwave Medical, Inc. | 0.01 | -24.54 | 1.73 | -30.43 | 0.3630 | -0.0397 | |||
| PENN / PENN Entertainment, Inc. | 0.06 | -4.49 | 1.71 | -31.53 | 0.3600 | -0.0457 | |||
| HRMY / Harmony Biosciences Holdings, Inc. | 0.04 | 210.96 | 1.71 | 212.02 | 0.3599 | 0.2708 | |||
| HCAT / Health Catalyst, Inc. | 0.12 | -3.83 | 1.68 | -46.68 | 0.3530 | -0.1579 | |||
| PI / Impinj, Inc. | 0.03 | 34.43 | 1.67 | 24.13 | 0.3512 | 0.1328 | |||
| AIMC / Altra Industrial Motion Corp | 0.05 | -7.03 | 1.63 | -15.83 | 0.3419 | 0.0284 | |||
| CBT / Cabot Corporation | 0.03 | 1.62 | 0.3405 | 0.3405 | |||||
| PVAC / Penn Virginia Corp. | 0.05 | -17.56 | 1.61 | -21.54 | 0.3384 | 0.0056 | |||
| PRAA / PRA Group, Inc. | 0.04 | 11.65 | 1.61 | -9.90 | 0.3382 | 0.0483 | |||
| SUM / Summit Materials, Inc. | 0.07 | -20.10 | 1.61 | -40.10 | 0.3380 | -0.0974 | |||
| TNDM / Tandem Diabetes Care, Inc. | 0.03 | 0.48 | 1.60 | -48.88 | 0.3352 | -0.1706 | |||
| ALKS / Alkermes plc | 0.05 | 1.58 | 0.3323 | 0.3323 | |||||
| CLDX / Celldex Therapeutics, Inc. | 0.06 | -25.86 | 1.58 | -41.32 | 0.3309 | -0.1043 | |||
| FOCS / Focus Financial Partners Inc - Class A | 0.05 | -23.32 | 1.57 | -42.91 | 0.3293 | -0.1158 | |||
| WK / Workiva Inc. | 0.02 | -0.77 | 1.57 | -44.52 | 0.3289 | -0.1285 | |||
| BOOT / Boot Barn Holdings, Inc. | 0.02 | 35.77 | 1.55 | -1.27 | 0.3258 | 0.0710 | |||
| LIVN / LivaNova PLC | 0.02 | 55.11 | 1.54 | 18.43 | 0.3228 | 0.1124 | |||
| SSTK / Shutterstock, Inc. | 0.03 | -25.78 | 1.53 | -54.32 | 0.3219 | -0.2218 | |||
| RVMD / Revolution Medicines, Inc. | 0.08 | 26.38 | 1.53 | -3.48 | 0.3205 | 0.0643 | |||
| SNDX / Syndax Pharmaceuticals, Inc. | 0.08 | -14.03 | 1.50 | -4.83 | 0.3143 | 0.0594 | |||
| MORF / Morphic Holding, Inc. | 0.07 | 378.72 | 1.50 | 158.65 | 0.3142 | 0.2205 | |||
| NSA / National Storage Affiliates Trust | 0.03 | -21.95 | 1.49 | -37.71 | 0.3126 | -0.0749 | |||
| SSD / Simpson Manufacturing Co., Inc. | 0.01 | -8.84 | 1.48 | -15.94 | 0.3115 | 0.0257 | |||
| OPCH / Option Care Health, Inc. | 0.05 | 1.39 | 0.2923 | 0.2923 | |||||
| JRVR / James River Group Holdings, Ltd. | 0.06 | -9.02 | 1.39 | -8.88 | 0.2913 | 0.0446 | |||
| NGVT / Ingevity Corporation | 0.02 | -28.65 | 1.38 | -29.66 | 0.2899 | -0.0283 | |||
| THRM / Gentherm Incorporated | 0.02 | -30.68 | 1.38 | -40.76 | 0.2894 | -0.0877 | |||
| ATRC / AtriCure, Inc. | 0.03 | -7.71 | 1.38 | -42.58 | 0.2893 | -0.0996 | |||
| UTHR / United Therapeutics Corporation | 0.01 | -17.52 | 1.33 | 8.37 | 0.2801 | 0.0805 | |||
| ACRS / Aclaris Therapeutics, Inc. | 0.10 | -20.99 | 1.33 | -36.00 | 0.2789 | -0.0575 | |||
| AVNT / Avient Corporation | 0.03 | 14.49 | 1.33 | -4.39 | 0.2787 | 0.0537 | |||
| TPTX / Turning Point Therapeutics Inc | 0.02 | -37.63 | 1.32 | 74.87 | 0.2777 | 0.1551 | |||
| ZIP / ZipRecruiter, Inc. | 0.09 | 9.45 | 1.31 | -29.42 | 0.2752 | -0.0257 | |||
| CRNX / Crinetics Pharmaceuticals, Inc. | 0.07 | 1.31 | 0.2744 | 0.2744 | |||||
| OLO / Olo Inc. | 0.13 | -5.06 | 1.30 | -29.32 | 0.2736 | -0.0250 | |||
| SAM / The Boston Beer Company, Inc. | 0.00 | -1.21 | 1.29 | -22.93 | 0.2704 | -0.0005 | |||
| US9021041085 / II-VI, Inc. | 0.02 | -64.31 | 1.26 | -74.92 | 0.2656 | -0.5515 | |||
| CCSI / Consensus Cloud Solutions, Inc. | 0.03 | -0.41 | 1.25 | -27.68 | 0.2636 | -0.0176 | |||
| BCC / Boise Cascade Company | 0.02 | -9.37 | 1.25 | -22.35 | 0.2619 | 0.0014 | |||
| FATE / Fate Therapeutics, Inc. | 0.05 | -18.30 | 1.24 | -47.79 | 0.2610 | -0.1247 | |||
| BOX / Box, Inc. | 0.05 | 1.24 | 0.2598 | 0.2598 | |||||
| NBIX / Neurocrine Biosciences, Inc. | 0.01 | -5.59 | 1.22 | -1.85 | 0.2560 | 0.0547 | |||
| CDLX / Cardlytics, Inc. | 0.05 | -4.20 | 1.21 | -61.15 | 0.2552 | -0.2514 | |||
| AMED / Amedisys, Inc. | 0.01 | 11.84 | 1.21 | -31.79 | 0.2544 | -0.0333 | |||
| WD / Walker & Dunlop, Inc. | 0.01 | -22.72 | 1.21 | -42.46 | 0.2540 | -0.0868 | |||
| CUBI / Customers Bancorp, Inc. | 0.04 | -5.77 | 1.20 | -38.75 | 0.2511 | -0.0652 | |||
| AXNX / Axonics, Inc. | 0.02 | -13.09 | 1.17 | -21.33 | 0.2465 | 0.0047 | |||
| IMGN / ImmunoGen, Inc. | 0.26 | -5.45 | 1.15 | -10.61 | 0.2425 | 0.0331 | |||
| SWTX / SpringWorks Therapeutics, Inc. | 0.05 | 39.88 | 1.13 | -39.00 | 0.2376 | -0.0629 | |||
| AIR / AAR Corp. | 0.03 | 1.13 | 0.2371 | 0.2371 | |||||
| KZR / Kezar Life Sciences, Inc. | 0.13 | 93.86 | 1.11 | -3.57 | 0.2326 | 0.0465 | |||
| ZNTL / Zentalis Pharmaceuticals, Inc. | 0.04 | 1.08 | 0.2266 | 0.2266 | |||||
| MKSI / MKS Inc. | 0.01 | -10.05 | 1.07 | -38.46 | 0.2253 | -0.0572 | |||
| PZZA / Papa John's International, Inc. | 0.01 | -29.68 | 1.04 | -44.23 | 0.2195 | -0.0842 | |||
| CPE / Callon Petroleum Company | 0.03 | 1.04 | 0.2189 | 0.2189 | |||||
| SMAR / Smartsheet Inc. | 0.03 | -13.12 | 1.04 | -50.14 | 0.2181 | -0.1196 | |||
| LPX / Louisiana-Pacific Corporation | 0.02 | -50.90 | 1.04 | -58.59 | 0.2177 | -0.1879 | |||
| PVH / PVH Corp. | 0.02 | -47.60 | 1.00 | -61.08 | 0.2103 | -0.2067 | |||
| QTWO / Q2 Holdings, Inc. | 0.03 | -46.79 | 1.00 | -66.73 | 0.2102 | -0.2771 | |||
| APPS / Digital Turbine, Inc. | 0.06 | -20.60 | 0.97 | -68.36 | 0.2028 | -0.2916 | |||
| MODV / ModivCare Inc. | 0.01 | -24.74 | 0.94 | -44.92 | 0.1983 | -0.0794 | |||
| RAMP / LiveRamp Holdings, Inc. | 0.03 | -10.65 | 0.88 | -38.35 | 0.1859 | -0.0467 | |||
| FNKO / Funko, Inc. | 0.04 | 0.88 | 0.1857 | 0.1857 | |||||
| RNA / Avidity Biosciences, Inc. | 0.06 | -7.14 | 0.84 | -27.00 | 0.1768 | -0.0100 | |||
| MRCY / Mercury Systems, Inc. | 0.01 | -54.67 | 0.84 | -56.01 | 0.1761 | -0.0609 | |||
| GTLB / GitLab Inc. | 0.02 | 0.82 | 0.1727 | 0.1727 | |||||
| VCYT / Veracyte, Inc. | 0.04 | -8.92 | 0.79 | -34.22 | 0.1660 | -0.0289 | |||
| TLS / Telos Corporation | 0.09 | 14.40 | 0.77 | -7.26 | 0.1612 | 0.0270 | |||
| FLYW / Flywire Corporation | 0.04 | 178.80 | 0.77 | 60.80 | 0.1612 | 0.0838 | |||
| KYMR / Kymera Therapeutics, Inc. | 0.04 | -9.02 | 0.76 | -57.70 | 0.1600 | -0.1318 | |||
| STOK / Stoke Therapeutics, Inc. | 0.06 | -6.81 | 0.76 | -41.54 | 0.1597 | -0.0511 | |||
| MRTX / Mirati Therapeutics, Inc. | 0.01 | -7.56 | 0.76 | -24.58 | 0.1594 | -0.0036 | |||
| NSTG / NanoString Technologies, Inc. | 0.06 | -6.03 | 0.74 | -65.66 | 0.1555 | -0.1940 | |||
| CNMD / CONMED Corporation | 0.01 | -47.06 | 0.71 | -65.89 | 0.1484 | -0.1873 | |||
| PACK / Ranpak Holdings Corp. | 0.10 | 52.12 | 0.68 | -47.94 | 0.1434 | -0.0689 | |||
| EVH / Evolent Health, Inc. | 0.02 | 0.67 | 0.1398 | 0.1398 | |||||
| SLGN / Silgan Holdings Inc. | 0.02 | 0.65 | 0.1361 | 0.1361 | |||||
| MQ / Marqeta, Inc. | 0.08 | 0.65 | 0.1358 | 0.1358 | |||||
| SITM / SiTime Corporation | 0.00 | -31.49 | 0.65 | -54.96 | 0.1356 | -0.0966 | |||
| TREX / Trex Company, Inc. | 0.01 | -34.34 | 0.64 | -65.04 | 0.1351 | -0.0937 | |||
| TWNK / Hostess Brands Inc - Class A | 0.03 | -76.67 | 0.64 | -69.48 | 0.1348 | -0.1264 | |||
| KURA / Kura Oncology, Inc. | 0.03 | -62.33 | 0.63 | -66.88 | 0.1321 | -0.1042 | |||
| PAYA / Paya Holdings Inc - Class A | 0.09 | -24.85 | 0.62 | -15.83 | 0.1297 | 0.0109 | |||
| ARWR / Arrowhead Pharmaceuticals, Inc. | 0.02 | 0.00 | 0.57 | -23.43 | 0.1202 | -0.0010 | |||
| NTLA / Intellia Therapeutics, Inc. | 0.01 | -76.59 | 0.56 | -83.35 | 0.1185 | -0.4298 | |||
| PAY / Paymentus Holdings, Inc. | 0.04 | -19.22 | 0.53 | -48.79 | 0.1108 | -0.0561 | |||
| EVOP / EVO Payments Inc - Class A | 0.02 | -54.42 | 0.51 | -60.29 | 0.1078 | -0.0480 | |||
| OPT / Opthea Limited - Depositary Receipt (Common Stock) | 0.07 | 0.03 | 0.47 | -5.48 | 0.0980 | 0.0180 | |||
| GAN / GAN Limited | 0.14 | -31.42 | 0.40 | -57.92 | 0.0849 | -0.0707 | |||
| HYFM / Hydrofarm Holdings Group, Inc. | 0.10 | -6.26 | 0.35 | -78.47 | 0.0735 | -0.1901 | |||
| EQ / Equillium, Inc. | 0.16 | 3.00 | 0.32 | -33.26 | 0.0679 | -0.0107 | |||
| DMTK / DermTech, Inc. | 0.05 | 11.57 | 0.30 | -57.86 | 0.0620 | -0.0516 | |||
| AVYA / Avaya Holdings Corp. | 0.07 | -78.68 | 0.17 | -96.23 | 0.0347 | -0.6751 | |||
| KALV / KalVista Pharmaceuticals, Inc. | 0.00 | -100.00 | 0.00 | -100.00 | -0.2026 | ||||
| BHVN / Biohaven Ltd. | 0.00 | -100.00 | 0.00 | -100.00 | -0.2563 | ||||
| PSB / PS Business Parks, Inc. | 0.00 | -100.00 | 0.00 | -100.00 | -0.6807 | ||||
| CMPS / COMPASS Pathways plc - Depositary Receipt (Common Stock) | 0.00 | -100.00 | 0.00 | -100.00 | -0.0861 | ||||
| RCM / R1 RCM Inc. | 0.00 | -100.00 | 0.00 | -100.00 | -1.1810 | ||||
| RUBY / Rubius Therapeutics, Inc. | 0.00 | -100.00 | 0.00 | -100.00 | -0.1214 | ||||
| BCYC / Bicycle Therapeutics plc - Depositary Receipt (Common Stock) | 0.00 | -100.00 | 0.00 | -100.00 | -0.1475 |