Mga Batayang Estadistika
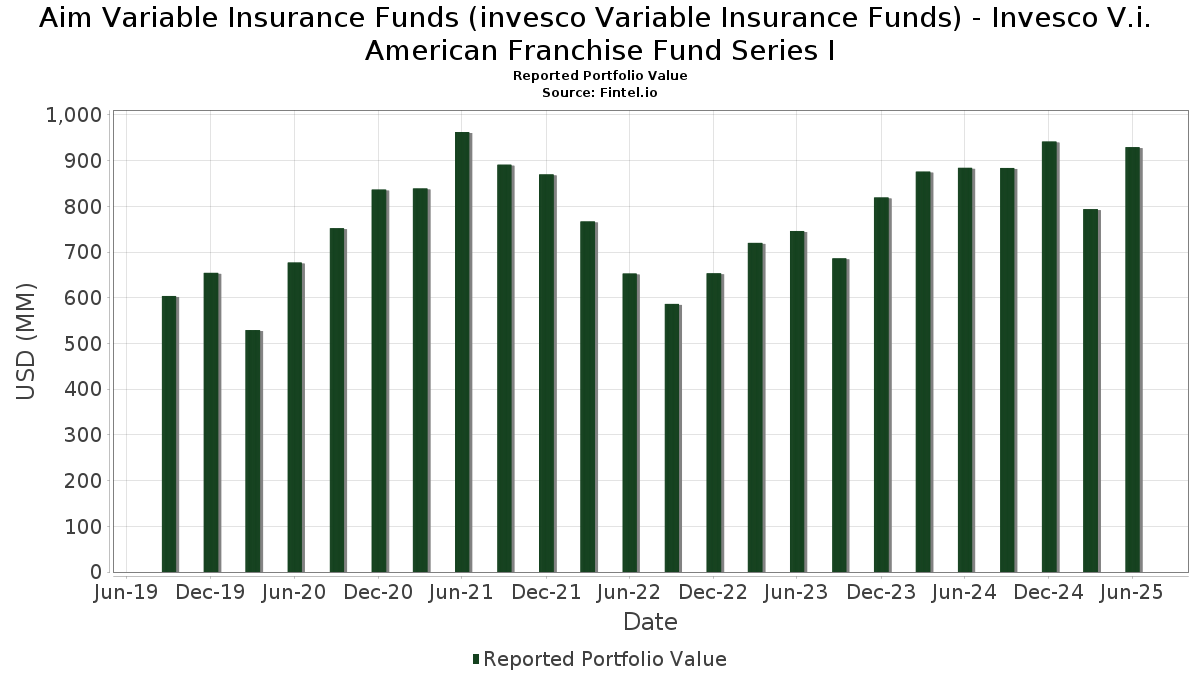
| Nilai Portofolio | $ 929,496,604 |
| Posisi Saat Ini | 62 |
Kepemilikan Terbaru, Kinerja, AUM (dari 13F, 13D)
Aim Variable Insurance Funds (invesco Variable Insurance Funds) - Invesco V.i. American Franchise Fund Series I telah mengungkapkan total kepemilikan 62 dalam pengajuan SEC terbaru mereka. Nilai portofolio terbaru dihitung sebesar $ 929,496,604 USD. Aset yang Dikelola (AUM) sebenarnya adalah nilai ini ditambah kas (yang tidak diungkapkan). Aset-aset utama Aim Variable Insurance Funds (invesco Variable Insurance Funds) - Invesco V.i. American Franchise Fund Series I adalah NVIDIA Corporation (US:NVDA) , Microsoft Corporation (US:MSFT) , Amazon.com, Inc. (US:AMZN) , Meta Platforms, Inc. (US:META) , and Broadcom Inc. (US:AVGO) . Posisi baru Aim Variable Insurance Funds (invesco Variable Insurance Funds) - Invesco V.i. American Franchise Fund Series I meliputi: Vistra Corp. (US:VST) , Robinhood Markets, Inc. (US:HOOD) , GE Vernova Inc. (US:GEV) , Axon Enterprise, Inc. (US:AXON) , and Palantir Technologies Inc. (US:PLTR) .
Peningkatan Tertinggi Kuartal Ini
Kami menggunakan perubahan dalam alokasi portofolio karena ini adalah metrik yang paling bermakna. Perubahan dapat disebabkan oleh perdagangan atau perubahan harga saham.
| Keamanan | Saham (MM) |
Nilai (Juta Dolar AS) |
Portfolio % | ΔPorsyento ng Portfolio |
|---|---|---|---|---|
| 0.17 | 83.59 | 9.1976 | 2.2696 | |
| 0.65 | 101.97 | 11.2192 | 1.8555 | |
| 14.83 | 14.83 | 1.6321 | 1.6321 | |
| 0.07 | 13.43 | 1.4782 | 1.4782 | |
| 0.04 | 6.89 | 0.7576 | 0.7576 | |
| 0.14 | 37.93 | 4.1734 | 0.7257 | |
| 0.07 | 6.54 | 0.7197 | 0.7197 | |
| 0.03 | 8.68 | 0.9553 | 0.6937 | |
| 0.03 | 12.78 | 1.4058 | 0.6619 | |
| 5.72 | 5.72 | 0.6299 | 0.6299 |
Penurunan Tertinggi Kuartal Ini
Kami menggunakan perubahan dalam alokasi portofolio karena ini adalah metrik yang paling bermakna. Perubahan dapat disebabkan oleh perdagangan atau perubahan harga saham.
| Keamanan | Saham (MM) |
Nilai (Juta Dolar AS) |
Portfolio % | ΔPorsyento ng Portfolio |
|---|---|---|---|---|
| 0.15 | 31.60 | 3.4766 | -2.0721 | |
| 0.05 | 7.25 | 0.7979 | -1.1184 | |
| 0.01 | 4.22 | 0.4644 | -0.9573 | |
| 0.29 | 64.68 | 7.1161 | -0.8732 | |
| 0.10 | 13.70 | 1.5077 | -0.8492 | |
| 0.01 | 10.35 | 1.1390 | -0.5730 | |
| 0.06 | 23.00 | 2.5302 | -0.5045 | |
| 0.03 | 3.80 | 0.4186 | -0.4882 | |
| 0.37 | 9.61 | 1.0572 | -0.4265 | |
| 1.27 | 1.27 | 0.1399 | -0.3414 |
Pengajuan 13F dan Dana
Formulir ini diajukan pada 2025-08-27 untuk periode pelaporan 2025-06-30. Klik ikon tautan untuk melihat riwayat transaksi selengkapnya.
Tingkatkan ke versi premium untuk membuka data premium dan ekspor ke Excel. ![]() .
.
| Keamanan | Ketik | Harga Saham Rata-rata | Saham (MM) |
ΔSaham (%) |
ΔSaham (%) |
Nilai ($MM) |
Portpolyo (%) |
ΔPortofolio (%) |
|
|---|---|---|---|---|---|---|---|---|---|
| NVDA / NVIDIA Corporation | 0.65 | -1.17 | 101.97 | 44.07 | 11.2192 | 1.8555 | |||
| MSFT / Microsoft Corporation | 0.17 | 20.48 | 83.59 | 59.64 | 9.1976 | 2.2696 | |||
| AMZN / Amazon.com, Inc. | 0.29 | -7.12 | 64.68 | 7.10 | 7.1161 | -0.8732 | |||
| META / Meta Platforms, Inc. | 0.08 | 0.38 | 60.29 | 28.54 | 6.6339 | 0.4282 | |||
| AVGO / Broadcom Inc. | 0.14 | -11.59 | 37.93 | 45.56 | 4.1734 | 0.7257 | |||
| AAPL / Apple Inc. | 0.15 | -18.43 | 31.60 | -24.66 | 3.4766 | -2.0721 | |||
| NFLX / Netflix, Inc. | 0.02 | -3.39 | 30.94 | 38.73 | 3.4044 | 0.4536 | |||
| GOOGL / Alphabet Inc. | 0.16 | -4.08 | 27.53 | 9.31 | 3.0295 | -0.3029 | |||
| V / Visa Inc. | 0.06 | -1.04 | 23.00 | 0.26 | 2.5302 | -0.5045 | |||
| NOW / ServiceNow, Inc. | 0.02 | 0.46 | 22.03 | 29.73 | 2.4240 | 0.1773 | |||
| ISRG / Intuitive Surgical, Inc. | 0.04 | 0.68 | 19.63 | 10.47 | 2.1599 | -0.1911 | |||
| BKNG / Booking Holdings Inc. | 0.00 | 14.10 | 18.98 | 43.38 | 2.0880 | 0.3369 | |||
| TSLA / Tesla, Inc. | 0.05 | 0.72 | 17.45 | 23.46 | 1.9198 | 0.0499 | |||
| JCI / Johnson Controls International plc | 0.14 | 28.24 | 15.08 | 69.08 | 1.6587 | 0.4790 | |||
| Invesco Private Prime Fund / STIV (N/A) | 14.83 | 14.83 | 1.6321 | 1.6321 | |||||
| APP / AppLovin Corporation | 0.04 | 25.10 | 14.57 | 65.29 | 1.6026 | 0.4367 | |||
| SPOT / Spotify Technology S.A. | 0.02 | 19.96 | 13.87 | 67.37 | 1.5259 | 0.4295 | |||
| KKR / KKR & Co. Inc. | 0.10 | -33.15 | 13.70 | -23.08 | 1.5077 | -0.8492 | |||
| BSX / Boston Scientific Corporation | 0.13 | 0.81 | 13.53 | 7.33 | 1.4888 | -0.1791 | |||
| NET / Cloudflare, Inc. | 0.07 | 13.43 | 1.4782 | 1.4782 | |||||
| ANET / Arista Networks Inc | 0.13 | -11.93 | 13.34 | 16.30 | 1.4676 | -0.0498 | |||
| SNOW / Snowflake Inc. | 0.06 | 1.62 | 13.28 | 55.58 | 1.4615 | 0.3319 | |||
| CRWD / CrowdStrike Holdings, Inc. | 0.03 | 57.30 | 12.78 | 127.23 | 1.4058 | 0.6619 | |||
| PM / Philip Morris International Inc. | 0.07 | 82.89 | 11.86 | 109.87 | 1.3055 | 0.5574 | |||
| TSM / Taiwan Semiconductor Manufacturing Company Limited - Depositary Receipt (Common Stock) | 0.05 | -1.37 | 11.30 | 34.56 | 1.2436 | 0.1323 | |||
| MPWR / Monolithic Power Systems, Inc. | 0.02 | -9.54 | 11.06 | 14.07 | 1.2170 | -0.0659 | |||
| GS / The Goldman Sachs Group, Inc. | 0.01 | -38.25 | 10.35 | -20.00 | 1.1390 | -0.5730 | |||
| MELI / MercadoLibre, Inc. | 0.00 | -0.13 | 10.22 | 33.80 | 1.1247 | 0.1139 | |||
| FLUT / Flutter Entertainment plc | 0.04 | 0.16 | 10.21 | 29.19 | 1.1236 | 0.0778 | |||
| BAESF / BAE Systems plc | 0.37 | -33.34 | 9.61 | -14.32 | 1.0572 | -0.4265 | |||
| TTWO / Take-Two Interactive Software, Inc. | 0.04 | 20.79 | 8.80 | 41.53 | 0.9685 | 0.1457 | |||
| ALNY / Alnylam Pharmaceuticals, Inc. | 0.03 | 263.68 | 8.68 | 339.37 | 0.9553 | 0.6937 | |||
| MCHP / Microchip Technology Incorporated | 0.12 | 26.47 | 8.48 | -2.73 | 0.9331 | -0.0883 | |||
| ETN / Eaton Corporation plc | 0.02 | 1.11 | 8.17 | 32.79 | 0.8988 | 0.0849 | |||
| APO / Apollo Global Management, Inc. | 0.06 | -9.12 | 7.85 | -5.84 | 0.8635 | -0.2393 | |||
| TDG / TransDigm Group Incorporated | 0.01 | -0.06 | 7.63 | 9.86 | 0.8396 | -0.0793 | |||
| BX / Blackstone Inc. | 0.05 | -53.21 | 7.25 | -49.94 | 0.7979 | -1.1184 | |||
| WAB / Westinghouse Air Brake Technologies Corporation | 0.03 | -3.25 | 7.11 | 11.68 | 0.7828 | -0.0600 | |||
| CTAS / Cintas Corporation | 0.03 | 14.54 | 7.09 | 24.20 | 0.7799 | 0.0248 | |||
| 7974 / Nintendo Co., Ltd. | 0.07 | 0.00 | 7.09 | 41.27 | 0.7798 | 0.1160 | |||
| VST / Vistra Corp. | 0.04 | 6.89 | 0.7576 | 0.7576 | |||||
| SU / Suncor Energy Inc. | 0.18 | -0.43 | 6.62 | -3.70 | 0.7283 | -0.1811 | |||
| DASH / DoorDash, Inc. | 0.03 | 1.11 | 6.60 | 36.37 | 0.7262 | 0.0859 | |||
| HOOD / Robinhood Markets, Inc. | 0.07 | 6.54 | 0.7197 | 0.7197 | |||||
| PH / Parker-Hannifin Corporation | 0.01 | -0.32 | 6.24 | 14.55 | 0.6868 | -0.0342 | |||
| VRT / Vertiv Holdings Co | 0.05 | -35.82 | 5.98 | 14.14 | 0.6582 | -0.0352 | |||
| Invesco Private Government Fund / STIV (N/A) | 5.72 | 5.72 | 0.6299 | 0.6299 | |||||
| URI / United Rentals, Inc. | 0.01 | 33.30 | 5.38 | 60.26 | 0.5920 | 0.1478 | |||
| GEV / GE Vernova Inc. | 0.01 | 5.32 | 0.5850 | 0.5850 | |||||
| LLY / Eli Lilly and Company | 0.01 | 2.66 | 5.24 | -3.11 | 0.5766 | -0.1390 | |||
| USFD / US Foods Holding Corp. | 0.06 | -0.56 | 4.82 | 16.97 | 0.5302 | -0.0148 | |||
| AJG / Arthur J. Gallagher & Co. | 0.01 | 519.66 | 4.76 | 1,036.52 | 0.5240 | 0.4687 | |||
| HUBS / HubSpot, Inc. | 0.01 | -59.69 | 4.22 | -60.73 | 0.4644 | -0.9573 | |||
| AXON / Axon Enterprise, Inc. | 0.00 | 3.87 | 0.4261 | 0.4261 | |||||
| DKNG / DraftKings Inc. | 0.09 | -3.79 | 3.85 | 24.23 | 0.4231 | 0.0136 | |||
| CBRE / CBRE Group, Inc. | 0.03 | -48.19 | 3.80 | -44.50 | 0.4186 | -0.4882 | |||
| PLTR / Palantir Technologies Inc. | 0.03 | 3.47 | 0.3821 | 0.3821 | |||||
| MLM / Martin Marietta Materials, Inc. | 0.00 | -5.76 | 2.64 | 8.24 | 0.2906 | -0.0323 | |||
| DXCM / DexCom, Inc. | 0.03 | 0.00 | 2.63 | 27.81 | 0.2893 | 0.0172 | |||
| COST / Costco Wholesale Corporation | 0.00 | -5.20 | 2.15 | -0.74 | 0.2363 | -0.0500 | |||
| US8252524066 / Invesco Treasury Portfolio, Institutional Class | 1.27 | -65.04 | 1.27 | -65.05 | 0.1399 | -0.3414 | |||
| US8252528851 / Invesco Government & Agency Portfolio, Institutional Class | 0.68 | -65.04 | 0.68 | -65.07 | 0.0754 | -0.1838 |