Mga Batayang Estadistika
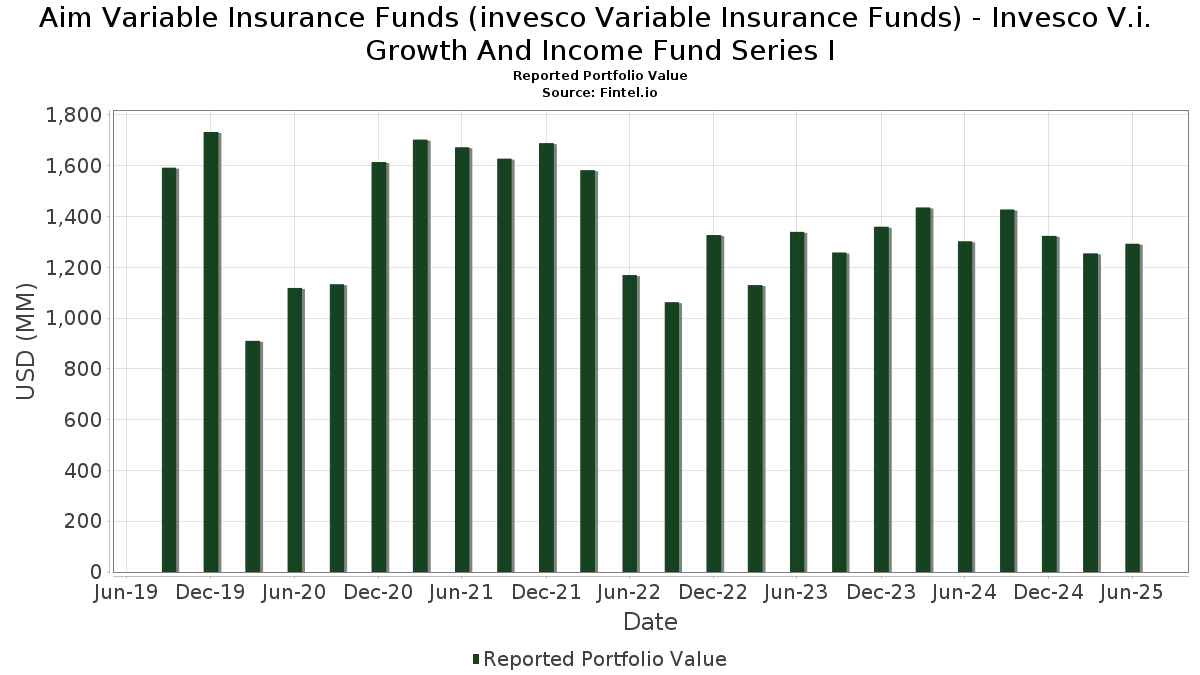
| Nilai Portofolio | $ 1,292,051,156 |
| Posisi Saat Ini | 99 |
Kepemilikan Terbaru, Kinerja, AUM (dari 13F, 13D)
Aim Variable Insurance Funds (invesco Variable Insurance Funds) - Invesco V.i. Growth And Income Fund Series I telah mengungkapkan total kepemilikan 99 dalam pengajuan SEC terbaru mereka. Nilai portofolio terbaru dihitung sebesar $ 1,292,051,156 USD. Aset yang Dikelola (AUM) sebenarnya adalah nilai ini ditambah kas (yang tidak diungkapkan). Aset-aset utama Aim Variable Insurance Funds (invesco Variable Insurance Funds) - Invesco V.i. Growth And Income Fund Series I adalah Invesco Treasury Portfolio, Institutional Class (US:US8252524066) , Wells Fargo & Company (US:WFC) , Bank of America Corporation (US:BAC) , Microsoft Corporation (US:MSFT) , and Amazon.com, Inc. (US:AMZN) . Posisi baru Aim Variable Insurance Funds (invesco Variable Insurance Funds) - Invesco V.i. Growth And Income Fund Series I meliputi: NVIDIA Corporation (US:NVDA) , The Procter & Gamble Company (US:PG) , Vertiv Holdings Co (US:VRT) , Ralliant Corporation (US:RAL) , and .
Peningkatan Tertinggi Kuartal Ini
Kami menggunakan perubahan dalam alokasi portofolio karena ini adalah metrik yang paling bermakna. Perubahan dapat disebabkan oleh perdagangan atau perubahan harga saham.
| Keamanan | Saham (MM) |
Nilai (Juta Dolar AS) |
Portfolio % | ΔPorsyento ng Portfolio |
|---|---|---|---|---|
| 46.37 | 46.37 | 3.6267 | 2.7073 | |
| 24.97 | 24.97 | 1.9528 | 1.4578 | |
| 0.12 | 18.45 | 1.4431 | 1.4431 | |
| 0.09 | 14.76 | 1.1543 | 1.1543 | |
| 0.21 | 15.01 | 1.1743 | 0.8809 | |
| 0.08 | 10.82 | 0.8463 | 0.8463 | |
| 0.41 | 28.82 | 2.2543 | 0.8414 | |
| 10.56 | 10.56 | 0.8262 | 0.8262 | |
| 0.07 | 32.41 | 2.5348 | 0.5201 | |
| 0.08 | 18.26 | 1.4279 | 0.4008 |
Penurunan Tertinggi Kuartal Ini
Kami menggunakan perubahan dalam alokasi portofolio karena ini adalah metrik yang paling bermakna. Perubahan dapat disebabkan oleh perdagangan atau perubahan harga saham.
| Keamanan | Saham (MM) |
Nilai (Juta Dolar AS) |
Portfolio % | ΔPorsyento ng Portfolio |
|---|---|---|---|---|
| 0.00 | 0.00 | -1.0337 | ||
| 0.03 | 8.09 | 0.6324 | -0.6602 | |
| 0.21 | 22.25 | 1.7399 | -0.6046 | |
| 0.19 | 9.39 | 0.7347 | -0.5677 | |
| 0.11 | 18.66 | 1.4592 | -0.5560 | |
| 0.12 | 17.31 | 1.3543 | -0.5467 | |
| 0.55 | 44.38 | 3.4708 | -0.4703 | |
| 0.48 | 16.62 | 1.2996 | -0.4648 | |
| 0.05 | 9.55 | 0.7473 | -0.3645 | |
| 0.08 | 23.08 | 1.8051 | -0.3396 |
Pengajuan 13F dan Dana
Formulir ini diajukan pada 2025-08-28 untuk periode pelaporan 2025-06-30. Klik ikon tautan untuk melihat riwayat transaksi selengkapnya.
Tingkatkan ke versi premium untuk membuka data premium dan ekspor ke Excel. ![]() .
.
| Keamanan | Ketik | Harga Saham Rata-rata | Saham (MM) |
ΔSaham (%) |
ΔSaham (%) |
Nilai ($MM) |
Portpolyo (%) |
ΔPortofolio (%) |
|
|---|---|---|---|---|---|---|---|---|---|
| US8252524066 / Invesco Treasury Portfolio, Institutional Class | 46.37 | 310.44 | 46.37 | 310.45 | 3.6267 | 2.7073 | |||
| WFC / Wells Fargo & Company | 0.55 | -17.89 | 44.38 | -8.36 | 3.4708 | -0.4703 | |||
| BAC / Bank of America Corporation | 0.90 | -4.53 | 42.70 | 8.25 | 3.3400 | 0.1296 | |||
| MSFT / Microsoft Corporation | 0.07 | -1.20 | 32.41 | 30.92 | 2.5348 | 0.5201 | |||
| AMZN / Amazon.com, Inc. | 0.14 | -1.54 | 31.52 | 13.53 | 2.4652 | 0.2057 | |||
| MCHP / Microchip Technology Incorporated | 0.41 | 14.22 | 28.82 | 66.03 | 2.2543 | 0.8414 | |||
| PM / Philip Morris International Inc. | 0.15 | -5.83 | 27.55 | 8.05 | 2.1549 | 0.0797 | |||
| DIS / The Walt Disney Company | 0.20 | -1.19 | 25.40 | 24.14 | 1.9866 | 0.3214 | |||
| US8252528851 / Invesco Government & Agency Portfolio, Institutional Class | 24.97 | 310.45 | 24.97 | 310.44 | 1.9528 | 1.4578 | |||
| JNJ / Johnson & Johnson | 0.16 | -1.20 | 24.96 | -8.99 | 1.9519 | -0.2799 | |||
| SCHW / The Charles Schwab Corporation | 0.27 | -1.20 | 24.90 | 15.16 | 1.9472 | 0.1878 | |||
| PH / Parker-Hannifin Corporation | 0.04 | -5.55 | 24.65 | 8.53 | 1.9283 | 0.0795 | |||
| WTW / Willis Towers Watson Public Limited Company | 0.08 | -3.43 | 23.08 | -12.42 | 1.8051 | -0.3396 | |||
| MDT / Medtronic plc | 0.26 | -1.19 | 22.97 | -4.15 | 1.7964 | -0.1538 | |||
| SYY / Sysco Corporation | 0.30 | 4.32 | 22.51 | 5.29 | 1.7608 | 0.0206 | |||
| JCI / Johnson Controls International plc | 0.21 | -41.43 | 22.25 | -22.78 | 1.7399 | -0.6046 | |||
| USFD / US Foods Holding Corp. | 0.27 | -1.20 | 20.55 | 16.23 | 1.6074 | 0.1685 | |||
| CFG / Citizens Financial Group, Inc. | 0.46 | -1.19 | 20.42 | 7.92 | 1.5974 | 0.0572 | |||
| FERG / Ferguson Enterprises Inc. | 0.09 | -19.60 | 19.46 | 9.27 | 1.5222 | 0.0726 | |||
| PPL / PPL Corporation | 0.57 | 4.63 | 19.45 | -1.80 | 1.5215 | -0.0907 | |||
| EMR / Emerson Electric Co. | 0.14 | -7.33 | 19.25 | 12.69 | 1.5057 | 0.1154 | |||
| CBRE / CBRE Group, Inc. | 0.14 | -20.22 | 19.05 | -14.52 | 1.4899 | -0.3238 | |||
| CVS / CVS Health Corporation | 0.27 | 2.44 | 18.67 | 4.30 | 1.4601 | 0.0034 | |||
| FI / Fiserv, Inc. | 0.11 | -3.49 | 18.66 | -24.65 | 1.4592 | -0.5560 | |||
| CVX / Chevron Corporation | 0.13 | -1.20 | 18.51 | -15.43 | 1.4475 | -0.3335 | |||
| NVDA / NVIDIA Corporation | 0.12 | 18.45 | 1.4431 | 1.4431 | |||||
| ORCL / Oracle Corporation | 0.08 | -7.49 | 18.26 | 44.66 | 1.4279 | 0.4008 | |||
| XOM / Exxon Mobil Corporation | 0.17 | -1.19 | 18.22 | -10.44 | 1.4251 | -0.2307 | |||
| COP / ConocoPhillips | 0.20 | 3.08 | 17.95 | -11.92 | 1.4036 | -0.2546 | |||
| CSCO / Cisco Systems, Inc. | 0.26 | -1.20 | 17.78 | 11.08 | 1.3905 | 0.0880 | |||
| AIG / American International Group, Inc. | 0.20 | -1.20 | 17.44 | -2.73 | 1.3637 | -0.0951 | |||
| RTX / RTX Corporation | 0.12 | -32.75 | 17.31 | -25.87 | 1.3543 | -0.5467 | |||
| PNC / The PNC Financial Services Group, Inc. | 0.09 | -1.19 | 17.19 | 4.79 | 1.3442 | 0.0094 | |||
| FIS / Fidelity National Information Services, Inc. | 0.21 | -1.19 | 17.00 | 7.71 | 1.3300 | 0.0451 | |||
| GS / The Goldman Sachs Group, Inc. | 0.02 | -15.23 | 16.78 | 9.82 | 1.3125 | 0.0689 | |||
| G80827101 / Shell PLC | 0.48 | -20.04 | 16.62 | -23.36 | 1.2996 | -0.4648 | |||
| GOOGL / Alphabet Inc. | 0.09 | -25.56 | 16.53 | -15.17 | 1.2928 | -0.2929 | |||
| SAN / Santander UK plc - Preferred Stock | 0.17 | -1.19 | 16.32 | -13.61 | 1.2767 | -0.2610 | |||
| KKR / KKR & Co. Inc. | 0.12 | 7.66 | 16.08 | 23.88 | 1.2574 | 0.2012 | |||
| SBUX / Starbucks Corporation | 0.17 | 13.53 | 15.32 | 6.06 | 1.1986 | 0.0226 | |||
| NSC / Norfolk Southern Corporation | 0.06 | -15.87 | 15.06 | -9.08 | 1.1776 | -0.1701 | |||
| NKE / NIKE, Inc. | 0.21 | 272.10 | 15.01 | 316.48 | 1.1743 | 0.8809 | |||
| NXPI / NXP Semiconductors N.V. | 0.07 | -1.19 | 14.96 | 13.59 | 1.1701 | 0.0982 | |||
| LRCX / Lam Research Corporation | 0.15 | -1.19 | 14.94 | 32.29 | 1.1682 | 0.2494 | |||
| PG / The Procter & Gamble Company | 0.09 | 14.76 | 1.1543 | 1.1543 | |||||
| FTV / Fortive Corporation | 0.27 | 18.93 | 14.21 | -15.29 | 1.1118 | -0.2538 | |||
| FDX / FedEx Corporation | 0.06 | -1.20 | 14.21 | -7.87 | 1.1112 | -0.1439 | |||
| CRM / Salesforce, Inc. | 0.05 | 8.53 | 14.13 | 10.28 | 1.1053 | 0.0623 | |||
| COHR / Coherent Corp. | 0.16 | -1.19 | 13.95 | 35.73 | 1.0911 | 0.2546 | |||
| CNC / Centene Corporation | 0.26 | -1.20 | 13.88 | -11.66 | 1.0854 | -0.1931 | |||
| TMUS / T-Mobile US, Inc. | 0.06 | -1.19 | 13.50 | -11.74 | 1.0560 | -0.1889 | |||
| UNH / UnitedHealth Group Incorporated | 0.04 | 50.78 | 12.99 | -10.19 | 1.0156 | -0.1611 | |||
| CTVA / Corteva, Inc. | 0.16 | -1.19 | 12.29 | 17.03 | 0.9612 | 0.1065 | |||
| META / Meta Platforms, Inc. | 0.02 | -32.29 | 12.07 | -13.29 | 0.9444 | -0.1890 | |||
| AEP / American Electric Power Company, Inc. | 0.11 | -1.20 | 11.75 | -6.18 | 0.9191 | -0.1002 | |||
| ZBRA / Zebra Technologies Corporation | 0.04 | -1.19 | 11.69 | 7.83 | 0.9143 | 0.0320 | |||
| EQT / EQT Corporation | 0.20 | -1.20 | 11.42 | 7.85 | 0.8930 | 0.0314 | |||
| CTSH / Cognizant Technology Solutions Corporation | 0.14 | -1.20 | 11.20 | 0.78 | 0.8760 | -0.0285 | |||
| SU / Suncor Energy Inc. | 0.29 | -1.20 | 10.91 | -4.41 | 0.8531 | -0.0756 | |||
| VRT / Vertiv Holdings Co | 0.08 | 10.82 | 0.8463 | 0.8463 | |||||
| BMY / Bristol-Myers Squibb Company | 0.23 | -1.20 | 10.71 | -25.01 | 0.8379 | -0.3248 | |||
| Invesco Private Prime Fund / STIV (N/A) | 10.56 | 10.56 | 0.8262 | 0.8262 | |||||
| TXT / Textron Inc. | 0.12 | -1.19 | 9.75 | 9.80 | 0.7625 | 0.0399 | |||
| FE / FirstEnergy Corp. | 0.24 | -1.20 | 9.57 | -1.58 | 0.7484 | -0.0429 | |||
| ALL / The Allstate Corporation | 0.05 | -28.06 | 9.55 | -30.06 | 0.7473 | -0.3645 | |||
| GM / General Motors Company | 0.19 | -43.90 | 9.39 | -41.30 | 0.7347 | -0.5677 | |||
| MRK / Merck & Co., Inc. | 0.12 | 5.18 | 9.32 | -7.25 | 0.7288 | -0.0888 | |||
| PPG / PPG Industries, Inc. | 0.08 | -1.20 | 9.15 | 2.79 | 0.7153 | -0.0089 | |||
| GEHC / GE HealthCare Technologies Inc. | 0.12 | -1.20 | 8.61 | -9.33 | 0.6737 | -0.0994 | |||
| ELV / Elevance Health, Inc. | 0.02 | -21.03 | 8.59 | -29.38 | 0.6719 | -0.3181 | |||
| DD / DuPont de Nemours, Inc. | 0.12 | -1.19 | 8.51 | -9.26 | 0.6656 | -0.0976 | |||
| HUM / Humana Inc. | 0.03 | -44.90 | 8.09 | -49.10 | 0.6324 | -0.6602 | |||
| PFE / Pfizer Inc. | 0.33 | -14.30 | 7.89 | -18.03 | 0.6174 | -0.1663 | |||
| RAL / Ralliant Corporation | 0.09 | 4.41 | 0.3447 | 0.3447 | |||||
| Invesco Private Government Fund / STIV (N/A) | 4.05 | 4.05 | 0.3170 | 0.3170 | |||||
| Forward Foreign Currency Contract / DFE (N/A) | 0.02 | 0.0012 | 0.0012 | ||||||
| Forward Foreign Currency Contract / DFE (N/A) | 0.01 | 0.0006 | 0.0006 | ||||||
| Forward Foreign Currency Contract / DFE (N/A) | 0.01 | 0.0005 | 0.0005 | ||||||
| Forward Foreign Currency Contract / DFE (N/A) | 0.01 | 0.0004 | 0.0004 | ||||||
| Forward Foreign Currency Contract / DFE (N/A) | 0.00 | 0.0003 | 0.0003 | ||||||
| Forward Foreign Currency Contract / DFE (N/A) | 0.00 | 0.0002 | 0.0002 | ||||||
| Forward Foreign Currency Contract / DFE (N/A) | 0.00 | 0.0002 | 0.0002 | ||||||
| Forward Foreign Currency Contract / DFE (N/A) | 0.00 | 0.0001 | 0.0001 | ||||||
| Forward Foreign Currency Contract / DFE (N/A) | 0.00 | 0.0001 | 0.0001 | ||||||
| Forward Foreign Currency Contract / DFE (N/A) | 0.00 | 0.0001 | 0.0001 | ||||||
| Forward Foreign Currency Contract / DFE (N/A) | 0.00 | 0.0000 | 0.0000 | ||||||
| MRVL / Marvell Technology, Inc. | 0.00 | -100.00 | 0.00 | -100.00 | -1.0337 | ||||
| CVE / Cenovus Energy Inc. | 0.00 | -100.00 | 0.00 | -100.00 | -0.2498 | ||||
| Forward Foreign Currency Contract / DFE (N/A) | -0.00 | -0.0000 | -0.0000 | ||||||
| Forward Foreign Currency Contract / DFE (N/A) | -0.00 | -0.0001 | -0.0001 | ||||||
| Forward Foreign Currency Contract / DFE (N/A) | -0.00 | -0.0001 | -0.0001 | ||||||
| Forward Foreign Currency Contract / DFE (N/A) | -0.00 | -0.0001 | -0.0001 | ||||||
| Forward Foreign Currency Contract / DFE (N/A) | -0.00 | -0.0003 | -0.0003 | ||||||
| Forward Foreign Currency Contract / DFE (N/A) | -0.00 | -0.0004 | -0.0004 | ||||||
| Forward Foreign Currency Contract / DFE (N/A) | -0.00 | -0.0004 | -0.0004 | ||||||
| Forward Foreign Currency Contract / DFE (N/A) | -0.01 | -0.0005 | -0.0005 | ||||||
| Forward Foreign Currency Contract / DFE (N/A) | -0.01 | -0.0005 | -0.0005 | ||||||
| Forward Foreign Currency Contract / DFE (N/A) | -0.02 | -0.0014 | -0.0014 | ||||||
| Forward Foreign Currency Contract / DFE (N/A) | -0.04 | -0.0029 | -0.0029 | ||||||
| Forward Foreign Currency Contract / DFE (N/A) | -0.15 | -0.0118 | -0.0118 | ||||||
| Forward Foreign Currency Contract / DFE (N/A) | -0.35 | -0.0277 | -0.0277 |