Mga Batayang Estadistika
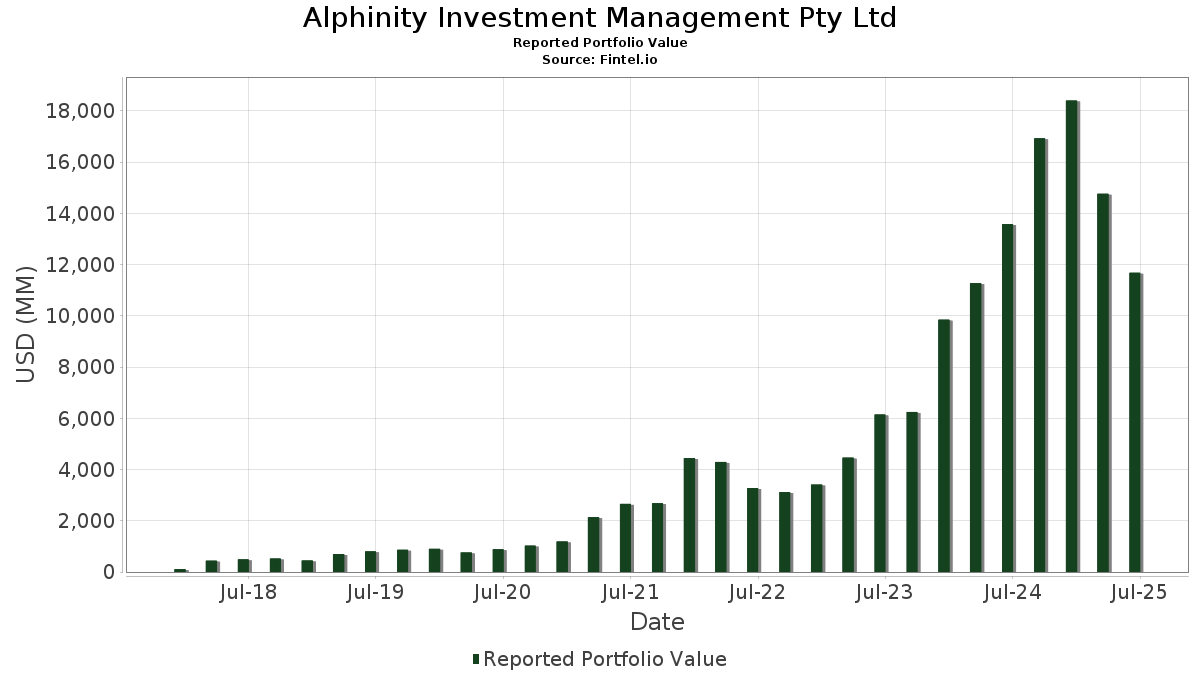
| Nilai Portofolio | $ 11,681,958,363 |
| Posisi Saat Ini | 30 |
Kepemilikan Terbaru, Kinerja, AUM (dari 13F, 13D)
Alphinity Investment Management Pty Ltd telah mengungkapkan total kepemilikan 30 dalam pengajuan SEC terbaru mereka. Nilai portofolio terbaru dihitung sebesar $ 11,681,958,363 USD. Aset yang Dikelola (AUM) sebenarnya adalah nilai ini ditambah kas (yang tidak diungkapkan). Aset-aset utama Alphinity Investment Management Pty Ltd adalah Microsoft Corporation (US:MSFT) , NVIDIA Corporation (US:NVDA) , Netflix, Inc. (US:NFLX) , ServiceNow, Inc. (US:NOW) , and The Coca-Cola Company (US:KO) . Posisi baru Alphinity Investment Management Pty Ltd meliputi: Amphenol Corporation (US:APH) , Booking Holdings Inc. (US:BKNG) , Deere & Company (US:DE) , .
Peningkatan Tertinggi Kuartal Ini
Kami menggunakan perubahan dalam alokasi portofolio karena ini adalah metrik yang paling bermakna. Perubahan dapat disebabkan oleh perdagangan atau perubahan harga saham.
| Keamanan | Saham (MM) |
Nilai (Juta Dolar AS) |
Portfolio % | ΔPorsyento ng Portfolio |
|---|---|---|---|---|
| 5.43 | 536.18 | 4.5898 | 4.5898 | |
| 0.07 | 412.72 | 3.5330 | 3.5330 | |
| 1.65 | 479.72 | 2.6484 | 2.6484 | |
| 1.86 | 592.41 | 5.0712 | 0.8426 | |
| 5.06 | 799.67 | 4.4147 | 0.1596 | |
| 0.03 | 3.22 | 0.0178 | 0.0178 | |
| 0.00 | 1.80 | 0.0154 | 0.0154 | |
| 0.01 | 4.45 | 0.0246 | 0.0017 | |
| 0.02 | 3.05 | 0.0169 | 0.0012 |
Penurunan Tertinggi Kuartal Ini
Kami menggunakan perubahan dalam alokasi portofolio karena ini adalah metrik yang paling bermakna. Perubahan dapat disebabkan oleh perdagangan atau perubahan harga saham.
| Keamanan | Saham (MM) |
Nilai (Juta Dolar AS) |
Portfolio % | ΔPorsyento ng Portfolio |
|---|---|---|---|---|
| 0.00 | 0.00 | -3.5297 | ||
| 9.02 | 638.38 | 3.5243 | -3.4344 | |
| 1.28 | 602.88 | 3.3283 | -2.5533 | |
| 0.72 | 505.50 | 2.7907 | -2.5004 | |
| 1.25 | 524.53 | 2.8958 | -2.2275 | |
| 5.25 | 481.66 | 2.6591 | -1.8308 | |
| 3.69 | 517.56 | 2.8573 | -1.8008 | |
| 0.94 | 323.83 | 1.7878 | -1.6758 | |
| 0.50 | 673.74 | 3.7195 | -1.6011 | |
| 3.05 | 569.69 | 3.1451 | -1.4880 |
Pengajuan 13F dan Dana
Formulir ini diajukan pada 2025-08-13 untuk periode pelaporan 2025-06-30. Klik ikon tautan untuk melihat riwayat transaksi selengkapnya.
Tingkatkan ke versi premium untuk membuka data premium dan ekspor ke Excel. ![]() .
.
| Keamanan | Ketik | Harga Saham Rata-rata | Saham (MM) |
ΔSaham (%) |
ΔSaham (%) |
Nilai ($MM) |
Portpolyo (%) |
ΔPortofolio (%) |
|
|---|---|---|---|---|---|---|---|---|---|
| MSFT / Microsoft Corporation | 2.10 | -21.60 | 1,046.57 | 3.88 | 5.7778 | -1.0449 | |||
| NVDA / NVIDIA Corporation | 5.06 | -12.69 | 799.67 | 27.27 | 4.4147 | 0.1596 | |||
| NFLX / Netflix, Inc. | 0.50 | -40.28 | 673.74 | -14.25 | 3.7195 | -1.6011 | |||
| NOW / ServiceNow, Inc. | 0.65 | -15.30 | 664.86 | 9.38 | 3.6705 | -0.4461 | |||
| KO / The Coca-Cola Company | 9.02 | -37.11 | 638.38 | -37.87 | 3.5243 | -3.4344 | |||
| LIN / Linde plc | 1.28 | -31.11 | 602.88 | -30.58 | 3.3283 | -2.5533 | |||
| AXP / American Express Company | 1.86 | -19.97 | 592.41 | -5.12 | 5.0712 | 0.8426 | |||
| MS / Morgan Stanley | 4.17 | -22.00 | 587.63 | -5.83 | 3.2441 | -0.9818 | |||
| TSM / Taiwan Semiconductor Manufacturing Company Limited - Depositary Receipt (Common Stock) | 2.54 | -13.98 | 574.91 | 17.37 | 3.1739 | -0.1433 | |||
| WCN / Waste Connections, Inc. | 3.05 | -12.95 | 569.69 | -16.73 | 3.1451 | -1.4880 | |||
| APH / Amphenol Corporation | 5.43 | 536.18 | 4.5898 | 4.5898 | |||||
| COST / Costco Wholesale Corporation | 0.54 | -17.57 | 533.57 | -13.72 | 2.9457 | -1.2423 | |||
| MSI / Motorola Solutions, Inc. | 1.25 | -27.80 | 524.53 | -30.67 | 2.8958 | -2.2275 | |||
| CBRE / CBRE Group, Inc. | 3.69 | -29.77 | 517.56 | -24.75 | 2.8573 | -1.8008 | |||
| PH / Parker-Hannifin Corporation | 0.72 | -43.69 | 505.50 | -35.30 | 2.7907 | -2.5004 | |||
| CRH / CRH plc | 5.25 | -30.38 | 481.66 | -27.35 | 2.6591 | -1.8308 | |||
| JPM / JPMorgan Chase & Co. | 1.65 | 479.72 | 2.6484 | 2.6484 | |||||
| ISRG / Intuitive Surgical, Inc. | 0.88 | -27.96 | 478.04 | -20.96 | 2.6391 | -1.4569 | |||
| BKNG / Booking Holdings Inc. | 0.07 | 412.72 | 3.5330 | 3.5330 | |||||
| SHW / The Sherwin-Williams Company | 0.94 | -35.61 | 323.83 | -36.68 | 1.7878 | -1.6758 | |||
| AMZN / Amazon.com, Inc. | 0.48 | -12.65 | 105.07 | 0.72 | 0.5800 | -0.1264 | |||
| MA / Mastercard Incorporated | 0.01 | -15.03 | 5.49 | -12.89 | 0.0303 | -0.0124 | |||
| VLTO / Veralto Corporation | 0.05 | -2.58 | 4.72 | 0.92 | 0.0260 | -0.0056 | |||
| SPOT / Spotify Technology S.A. | 0.01 | -5.57 | 4.45 | 31.75 | 0.0246 | 0.0017 | |||
| CTAS / Cintas Corporation | 0.02 | 3.01 | 4.06 | 11.71 | 0.0224 | -0.0022 | |||
| CB / Chubb Limited | 0.01 | -2.58 | 3.47 | -6.52 | 0.0191 | -0.0060 | |||
| WMT / Walmart Inc. | 0.03 | 3.22 | 0.0178 | 0.0178 | |||||
| SFM / Sprouts Farmers Market, Inc. | 0.02 | 22.39 | 3.05 | 31.98 | 0.0169 | 0.0012 | |||
| MCO / Moody's Corporation | 0.01 | -22.80 | 2.61 | -16.87 | 0.0144 | -0.0069 | |||
| DE / Deere & Company | 0.00 | 1.80 | 0.0154 | 0.0154 | |||||
| AAPL / Apple Inc. | 0.00 | -100.00 | 0.00 | -100.00 | -3.5297 | ||||
| CMG / Chipotle Mexican Grill, Inc. | 0.00 | -100.00 | 0.00 | 0.0000 | |||||
| GOOGL / Alphabet Inc. | 0.00 | -100.00 | 0.00 | 0.0000 | |||||
| PG / The Procter & Gamble Company | 0.00 | -100.00 | 0.00 | 0.0000 | |||||
| BAC / Bank of America Corporation | 0.00 | -100.00 | 0.00 | 0.0000 | |||||
| MMC / Marsh & McLennan Companies, Inc. | 0.00 | -100.00 | 0.00 | 0.0000 | |||||
| TMO / Thermo Fisher Scientific Inc. | 0.00 | -100.00 | 0.00 | 0.0000 |