Mga Batayang Estadistika
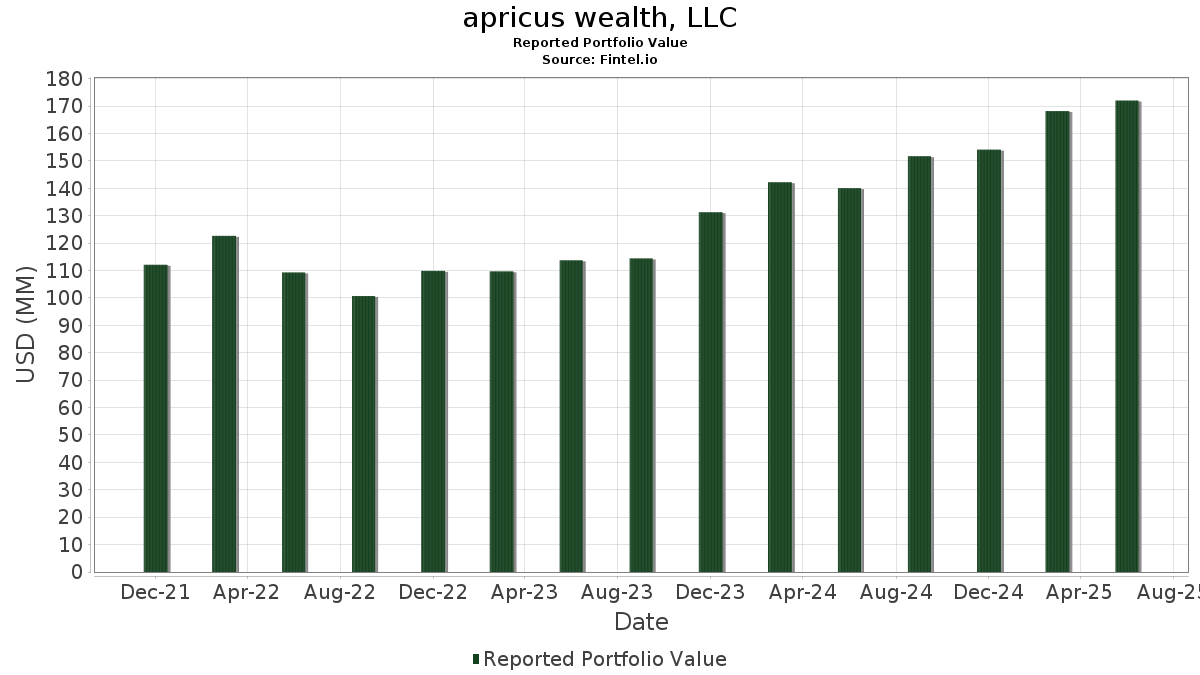
| Nilai Portofolio | $ 171,999,865 |
| Posisi Saat Ini | 116 |
Kepemilikan Terbaru, Kinerja, AUM (dari 13F, 13D)
apricus wealth, LLC telah mengungkapkan total kepemilikan 116 dalam pengajuan SEC terbaru mereka. Nilai portofolio terbaru dihitung sebesar $ 171,999,865 USD. Aset yang Dikelola (AUM) sebenarnya adalah nilai ini ditambah kas (yang tidak diungkapkan). Aset-aset utama apricus wealth, LLC adalah Chevron Corporation (US:CVX) , State Street Corporation (US:STT) , Merck & Co., Inc. (US:MRK) , Bunge Global SA (US:BG) , and Citigroup Inc. (US:C) . Posisi baru apricus wealth, LLC meliputi: Barrick Mining Corporation (US:B) , Grayscale Bitcoin Trust (BTC) (US:GBTC) , Vanguard Whitehall Funds - Vanguard International High Dividend Yield ETF (US:VYMI) , Veru Inc. (US:VERU) , and .
Peningkatan Tertinggi Kuartal Ini
Kami menggunakan perubahan dalam alokasi portofolio karena ini adalah metrik yang paling bermakna. Perubahan dapat disebabkan oleh perdagangan atau perubahan harga saham.
| Keamanan | Saham (MM) |
Nilai (Juta Dolar AS) |
Portfolio % | ΔPorsyento ng Portfolio |
|---|---|---|---|---|
| 0.11 | 2.25 | 1.3070 | 1.3070 | |
| 0.06 | 4.66 | 2.7122 | 1.1089 | |
| 0.02 | 2.98 | 1.7337 | 0.4797 | |
| 0.04 | 4.67 | 2.7157 | 0.4541 | |
| 0.07 | 3.45 | 2.0071 | 0.4311 | |
| 0.05 | 4.12 | 2.3947 | 0.3552 | |
| 0.00 | 2.34 | 1.3632 | 0.3110 | |
| 0.01 | 1.36 | 0.7926 | 0.2907 | |
| 0.00 | 1.38 | 0.8026 | 0.2898 | |
| 0.05 | 4.37 | 2.5434 | 0.2639 |
Penurunan Tertinggi Kuartal Ini
Kami menggunakan perubahan dalam alokasi portofolio karena ini adalah metrik yang paling bermakna. Perubahan dapat disebabkan oleh perdagangan atau perubahan harga saham.
| Keamanan | Saham (MM) |
Nilai (Juta Dolar AS) |
Portfolio % | ΔPorsyento ng Portfolio |
|---|---|---|---|---|
| 0.00 | 0.23 | 0.1354 | -0.7896 | |
| 0.09 | 2.93 | 1.7058 | -0.5627 | |
| 0.03 | 4.70 | 2.7340 | -0.4991 | |
| 0.45 | 2.76 | 1.6055 | -0.4370 | |
| 0.03 | 2.81 | 1.6329 | -0.3585 | |
| 0.03 | 1.91 | 1.1093 | -0.3395 | |
| 0.11 | 2.83 | 1.6478 | -0.3032 | |
| 0.01 | 2.98 | 1.7352 | -0.2978 | |
| 0.02 | 3.82 | 2.2198 | -0.2695 | |
| 0.02 | 2.12 | 1.2353 | -0.2629 |
Pengajuan 13F dan Dana
Formulir ini diajukan pada 2025-07-30 untuk periode pelaporan 2025-06-30. Klik ikon tautan untuk melihat riwayat transaksi selengkapnya.
Tingkatkan ke versi premium untuk membuka data premium dan ekspor ke Excel. ![]() .
.
| Keamanan | Ketik | Harga Saham Rata-rata | Saham (MM) |
ΔSaham (%) |
ΔSaham (%) |
Nilai ($MM) |
Portpolyo (%) |
ΔPortofolio (%) |
|
|---|---|---|---|---|---|---|---|---|---|
| CVX / Chevron Corporation | 0.03 | 1.05 | 4.70 | -13.52 | 2.7340 | -0.4991 | |||
| STT / State Street Corporation | 0.04 | 3.40 | 4.67 | 22.80 | 2.7157 | 0.4541 | |||
| MRK / Merck & Co., Inc. | 0.06 | 96.19 | 4.66 | 73.00 | 2.7122 | 1.1089 | |||
| BG / Bunge Global SA | 0.05 | 8.63 | 4.37 | 14.11 | 2.5434 | 0.2639 | |||
| C / Citigroup Inc. | 0.05 | 0.16 | 4.12 | 20.09 | 2.3947 | 0.3552 | |||
| JPM / JPMorgan Chase & Co. | 0.01 | -3.76 | 4.09 | 13.72 | 2.3761 | 0.2396 | |||
| EXE / Expand Energy Corporation | 0.03 | -1.88 | 4.06 | 3.09 | 2.3629 | 0.0183 | |||
| KT / KT Corporation - Depositary Receipt (Common Stock) | 0.19 | -2.42 | 3.92 | 14.50 | 2.2815 | 0.2434 | |||
| BAC / Bank of America Corporation | 0.08 | -6.18 | 3.87 | 6.38 | 2.2502 | 0.0869 | |||
| ABBV / AbbVie Inc. | 0.02 | 2.95 | 3.82 | -8.79 | 2.2198 | -0.2695 | |||
| AMGN / Amgen Inc. | 0.01 | 2.77 | 3.81 | -7.89 | 2.2123 | -0.2445 | |||
| CSCO / Cisco Systems, Inc. | 0.05 | -1.29 | 3.73 | 10.98 | 2.1691 | 0.1701 | |||
| KR / The Kroger Co. | 0.05 | -0.42 | 3.69 | 5.54 | 2.1479 | 0.0661 | |||
| UL / Unilever PLC - Depositary Receipt (Common Stock) | 0.06 | -2.15 | 3.52 | 0.51 | 2.0440 | -0.0359 | |||
| ADM / Archer-Daniels-Midland Company | 0.07 | 18.49 | 3.45 | 30.26 | 2.0071 | 0.4311 | |||
| ABNB / Airbnb, Inc. | 0.03 | 0.00 | 3.42 | 10.78 | 1.9900 | 0.1528 | |||
| TSN / Tyson Foods, Inc. | 0.06 | 3.01 | 3.28 | -9.69 | 1.9067 | -0.2527 | |||
| CB / Chubb Limited | 0.01 | 2.39 | 3.10 | -1.74 | 1.8013 | -0.0742 | |||
| NEM / Newmont Corporation | 0.05 | -2.79 | 3.03 | 17.31 | 1.7612 | 0.2255 | |||
| JNJ / Johnson & Johnson | 0.02 | -1.05 | 3.02 | -8.84 | 1.7571 | -0.2147 | |||
| AAPL / Apple Inc. | 0.01 | -5.49 | 2.98 | -12.70 | 1.7352 | -0.2978 | |||
| NUE / Nucor Corporation | 0.02 | 31.36 | 2.98 | 41.46 | 1.7337 | 0.4797 | |||
| SO / The Southern Company | 0.03 | -0.22 | 2.94 | -0.34 | 1.7077 | -0.0450 | |||
| SLB / Schlumberger Limited | 0.09 | -4.89 | 2.93 | -23.07 | 1.7058 | -0.5627 | |||
| KMI / Kinder Morgan, Inc. | 0.10 | -4.33 | 2.89 | -1.40 | 1.6808 | -0.0630 | |||
| UNM / Unum Group | 0.04 | 1.40 | 2.89 | 0.52 | 1.6807 | -0.0292 | |||
| NVS / Novartis AG - Depositary Receipt (Common Stock) | 0.02 | 1.97 | 2.88 | 10.70 | 1.6722 | 0.1271 | |||
| CTRA / Coterra Energy Inc. | 0.11 | -1.64 | 2.83 | -13.62 | 1.6478 | -0.3032 | |||
| TM / Toyota Motor Corporation - Depositary Receipt (Common Stock) | 0.02 | 12.81 | 2.82 | 10.07 | 1.6404 | 0.1163 | |||
| SJM / The J. M. Smucker Company | 0.03 | 1.12 | 2.81 | -16.13 | 1.6329 | -0.3585 | |||
| WEC / WEC Energy Group, Inc. | 0.03 | 6.76 | 2.80 | 2.08 | 1.6266 | -0.0032 | |||
| MDXG / MiMedx Group, Inc. | 0.45 | 0.00 | 2.76 | -19.60 | 1.6055 | -0.4370 | |||
| TRP / TC Energy Corporation | 0.06 | 1.70 | 2.73 | 5.13 | 1.5855 | 0.0426 | |||
| PFE / Pfizer Inc. | 0.11 | -3.21 | 2.60 | -7.41 | 1.5113 | -0.1581 | |||
| DUK / Duke Energy Corporation | 0.02 | 5.13 | 2.56 | 1.71 | 1.4895 | -0.0083 | |||
| CVS / CVS Health Corporation | 0.04 | 0.37 | 2.52 | 2.19 | 1.4638 | -0.0012 | |||
| PNC / The PNC Financial Services Group, Inc. | 0.01 | 1.31 | 2.49 | 7.46 | 1.4491 | 0.0697 | |||
| MSFT / Microsoft Corporation | 0.00 | 0.00 | 2.34 | 32.50 | 1.3632 | 0.3110 | |||
| SHEL / Shell plc - Depositary Receipt (Common Stock) | 0.03 | 8.15 | 2.30 | 3.93 | 1.3388 | 0.0211 | |||
| B / Barrick Mining Corporation | 0.11 | 2.25 | 1.3070 | 1.3070 | |||||
| CMCSA / Comcast Corporation | 0.06 | 21.38 | 2.14 | 17.38 | 1.2453 | 0.1604 | |||
| COP / ConocoPhillips | 0.02 | -1.31 | 2.12 | -15.68 | 1.2353 | -0.2629 | |||
| VZ / Verizon Communications Inc. | 0.05 | 0.42 | 2.10 | -4.20 | 1.2187 | -0.0824 | |||
| SOBO / South Bow Corporation | 0.07 | 2.26 | 1.94 | 3.80 | 1.1282 | 0.0168 | |||
| LYB / LyondellBasell Industries N.V. | 0.03 | -4.72 | 1.91 | -21.72 | 1.1093 | -0.3395 | |||
| CEG / Constellation Energy Corporation | 0.00 | 0.00 | 1.38 | 60.09 | 0.8026 | 0.2898 | |||
| PLTR / Palantir Technologies Inc. | 0.01 | 0.00 | 1.36 | 61.49 | 0.7926 | 0.2907 | |||
| GOOG / Alphabet Inc. | 0.01 | 0.00 | 1.24 | 13.50 | 0.7238 | 0.0718 | |||
| T / AT&T Inc. | 0.04 | -1.58 | 1.04 | 0.68 | 0.6022 | -0.0093 | |||
| EBGEF / Enbridge Inc. - Preferred Stock | 0.02 | 11.69 | 1.02 | 14.24 | 0.5927 | 0.0621 | |||
| BRK.B / Berkshire Hathaway Inc. | 0.00 | -4.69 | 0.99 | -13.05 | 0.5736 | -0.1013 | |||
| WTRG / Essential Utilities, Inc. | 0.03 | 0.00 | 0.98 | -6.07 | 0.5671 | -0.0502 | |||
| KMB / Kimberly-Clark Corporation | 0.01 | -1.32 | 0.97 | -10.56 | 0.5617 | -0.0805 | |||
| XOM / Exxon Mobil Corporation | 0.01 | 0.04 | 0.92 | -9.28 | 0.5344 | -0.0684 | |||
| HON / Honeywell International Inc. | 0.00 | 0.27 | 0.85 | 10.22 | 0.4958 | 0.0360 | |||
| SYK / Stryker Corporation | 0.00 | 0.00 | 0.85 | 6.37 | 0.4955 | 0.0187 | |||
| HESM / Hess Midstream LP | 0.02 | 0.00 | 0.76 | -8.98 | 0.4422 | -0.0545 | |||
| AMZN / Amazon.com, Inc. | 0.00 | 0.00 | 0.75 | 15.31 | 0.4379 | 0.0495 | |||
| ABT / Abbott Laboratories | 0.01 | 0.02 | 0.74 | 2.48 | 0.4329 | 0.0011 | |||
| VTV / Vanguard Index Funds - Vanguard Value ETF | 0.00 | 11.72 | 0.72 | 14.22 | 0.4162 | 0.0438 | |||
| PRU / Prudential Financial, Inc. | 0.01 | -1.93 | 0.55 | -5.71 | 0.3171 | -0.0267 | |||
| PEP / PepsiCo, Inc. | 0.00 | 12.35 | 0.54 | -1.10 | 0.3143 | -0.0106 | |||
| CAT / Caterpillar Inc. | 0.00 | 0.00 | 0.54 | 17.69 | 0.3135 | 0.0411 | |||
| KO / The Coca-Cola Company | 0.01 | -0.44 | 0.50 | -1.59 | 0.2884 | -0.0115 | |||
| MA / Mastercard Incorporated | 0.00 | -1.69 | 0.49 | 0.82 | 0.2855 | -0.0042 | |||
| PHYS / Sprott Physical Gold Trust | 0.02 | -17.39 | 0.48 | -13.02 | 0.2800 | -0.0490 | |||
| VGT / Vanguard World Fund - Vanguard Information Technology ETF | 0.00 | 0.00 | 0.46 | 22.43 | 0.2699 | 0.0442 | |||
| GOOGL / Alphabet Inc. | 0.00 | 0.00 | 0.45 | 13.82 | 0.2638 | 0.0270 | |||
| UPS / United Parcel Service, Inc. | 0.00 | -3.29 | 0.44 | -11.20 | 0.2585 | -0.0394 | |||
| NSC / Norfolk Southern Corporation | 0.00 | 0.00 | 0.43 | 8.06 | 0.2497 | 0.0134 | |||
| CI / The Cigna Group | 0.00 | 0.00 | 0.41 | 0.49 | 0.2393 | -0.0043 | |||
| BMI / Badger Meter, Inc. | 0.00 | 0.00 | 0.41 | 28.98 | 0.2356 | 0.0484 | |||
| CBOE / Cboe Global Markets, Inc. | 0.00 | 0.00 | 0.40 | 3.10 | 0.2323 | 0.0018 | |||
| AME / AMETEK, Inc. | 0.00 | 0.00 | 0.37 | 5.10 | 0.2162 | 0.0059 | |||
| STE / STERIS plc | 0.00 | -7.63 | 0.36 | -2.16 | 0.2112 | -0.0095 | |||
| CACI / CACI International Inc | 0.00 | 0.00 | 0.36 | 29.82 | 0.2079 | 0.0442 | |||
| FDX / FedEx Corporation | 0.00 | -8.82 | 0.35 | -14.98 | 0.2048 | -0.0416 | |||
| GJR / Strats Trust For Procter & Gambel Security - Preferred Security | 0.00 | -0.76 | 0.35 | -7.39 | 0.2046 | -0.0210 | |||
| AEP / American Electric Power Company, Inc. | 0.00 | -1.51 | 0.34 | -6.37 | 0.1968 | -0.0184 | |||
| TMO / Thermo Fisher Scientific Inc. | 0.00 | 0.00 | 0.33 | -18.54 | 0.1942 | -0.0496 | |||
| HUBB / Hubbell Incorporated | 0.00 | 0.00 | 0.33 | 23.48 | 0.1900 | 0.0325 | |||
| SXI / Standex International Corporation | 0.00 | -8.88 | 0.32 | -11.85 | 0.1866 | -0.0294 | |||
| GLW / Corning Incorporated | 0.01 | 0.00 | 0.32 | 14.55 | 0.1837 | 0.0201 | |||
| GDXJ / VanEck ETF Trust - VanEck Junior Gold Miners ETF | 0.00 | -36.23 | 0.30 | -24.62 | 0.1729 | -0.0618 | |||
| IJJ / iShares Trust - iShares S&P Mid-Cap 400 Value ETF | 0.00 | 0.00 | 0.29 | 3.23 | 0.1677 | 0.0015 | |||
| JCI / Johnson Controls International plc | 0.00 | -0.73 | 0.29 | 30.73 | 0.1662 | 0.0363 | |||
| AXP / American Express Company | 0.00 | 0.00 | 0.27 | 18.94 | 0.1571 | 0.0216 | |||
| PAYX / Paychex, Inc. | 0.00 | -6.52 | 0.26 | -11.86 | 0.1516 | -0.0243 | |||
| IEMG / iShares, Inc. - iShares Core MSCI Emerging Markets ETF | 0.00 | 0.00 | 0.26 | 11.16 | 0.1509 | 0.0121 | |||
| AFL / Aflac Incorporated | 0.00 | -3.94 | 0.26 | -8.87 | 0.1495 | -0.0183 | |||
| SCHD / Schwab Strategic Trust - Schwab U.S. Dividend Equity ETF | 0.01 | 0.93 | 0.26 | -4.49 | 0.1488 | -0.0103 | |||
| CTVA / Corteva, Inc. | 0.00 | 0.00 | 0.25 | 18.84 | 0.1431 | 0.0195 | |||
| MASI / Masimo Corporation | 0.00 | 0.00 | 0.25 | 0.82 | 0.1430 | -0.0018 | |||
| ADI / Analog Devices, Inc. | 0.00 | -25.31 | 0.25 | -11.87 | 0.1429 | -0.0229 | |||
| DELL / Dell Technologies Inc. | 0.00 | 0.25 | 0.1426 | 0.1426 | |||||
| GSCE / GS Connect S&P GSCI Enhanced Commodity Total Return ETN | 0.00 | -24.44 | 0.24 | -2.04 | 0.1399 | -0.0063 | |||
| TJX / The TJX Companies, Inc. | 0.00 | -3.94 | 0.24 | -2.83 | 0.1399 | -0.0070 | |||
| DGRW / WisdomTree Trust - WisdomTree U.S. Quality Dividend Growth Fund | 0.00 | 0.00 | 0.24 | 4.85 | 0.1388 | 0.0034 | |||
| DRI / Darden Restaurants, Inc. | 0.00 | -8.44 | 0.24 | -4.07 | 0.1375 | -0.0089 | |||
| IBM / International Business Machines Corporation | 0.00 | -87.37 | 0.23 | -85.08 | 0.1354 | -0.7896 | |||
| EOG / EOG Resources, Inc. | 0.00 | -5.22 | 0.23 | -11.63 | 0.1326 | -0.0208 | |||
| PSX / Phillips 66 | 0.00 | 0.23 | 0.1318 | 0.1318 | |||||
| OKE / ONEOK, Inc. | 0.00 | 0.00 | 0.22 | -17.60 | 0.1281 | -0.0312 | |||
| NEE / NextEra Energy, Inc. | 0.00 | 0.00 | 0.22 | -2.24 | 0.1272 | -0.0057 | |||
| NDSN / Nordson Corporation | 0.00 | -2.39 | 0.22 | 3.81 | 0.1271 | 0.0018 | |||
| MMSI / Merit Medical Systems, Inc. | 0.00 | -7.75 | 0.22 | -18.56 | 0.1255 | -0.0319 | |||
| SYY / Sysco Corporation | 0.00 | -2.58 | 0.21 | -1.38 | 0.1245 | -0.0050 | |||
| GBTC / Grayscale Bitcoin Trust (BTC) | 0.00 | 0.21 | 0.1233 | 0.1233 | |||||
| ABM / ABM Industries Incorporated | 0.00 | -5.45 | 0.20 | -5.99 | 0.1191 | -0.0101 | |||
| BRC / Brady Corporation | 0.00 | -3.24 | 0.20 | -6.91 | 0.1180 | -0.0116 | |||
| VYMI / Vanguard Whitehall Funds - Vanguard International High Dividend Yield ETF | 0.00 | 0.20 | 0.1164 | 0.1164 | |||||
| MUFG / Mitsubishi UFJ Financial Group, Inc. - Depositary Receipt (Common Stock) | 0.01 | 0.00 | 0.14 | 0.74 | 0.0798 | -0.0013 | |||
| MQ / Marqeta, Inc. | 0.02 | 0.00 | 0.10 | 40.54 | 0.0610 | 0.0169 | |||
| RLMD / Relmada Therapeutics, Inc. | 0.05 | -3.06 | 0.03 | 115.38 | 0.0166 | 0.0087 | |||
| VERU / Veru Inc. | 0.04 | 0.02 | 0.0135 | 0.0135 | |||||
| CHPT / ChargePoint Holdings, Inc. | 0.03 | 0.00 | 0.02 | 18.75 | 0.0112 | 0.0014 | |||
| EPD / Enterprise Products Partners L.P. - Limited Partnership | 0.00 | -100.00 | 0.00 | 0.0000 | |||||
| BDX / Becton, Dickinson and Company | 0.00 | -100.00 | 0.00 | 0.0000 | |||||
| UFPI / UFP Industries, Inc. | 0.00 | -100.00 | 0.00 | 0.0000 | |||||
| LOW / Lowe's Companies, Inc. | 0.00 | -100.00 | 0.00 | 0.0000 | |||||
| GOLD / Barrick Mining Corporation | 0.00 | -100.00 | 0.00 | 0.0000 | |||||
| CL / Colgate-Palmolive Company | 0.00 | -100.00 | 0.00 | 0.0000 | |||||
| EXC / Exelon Corporation | 0.00 | -100.00 | 0.00 | 0.0000 |