Mga Batayang Estadistika
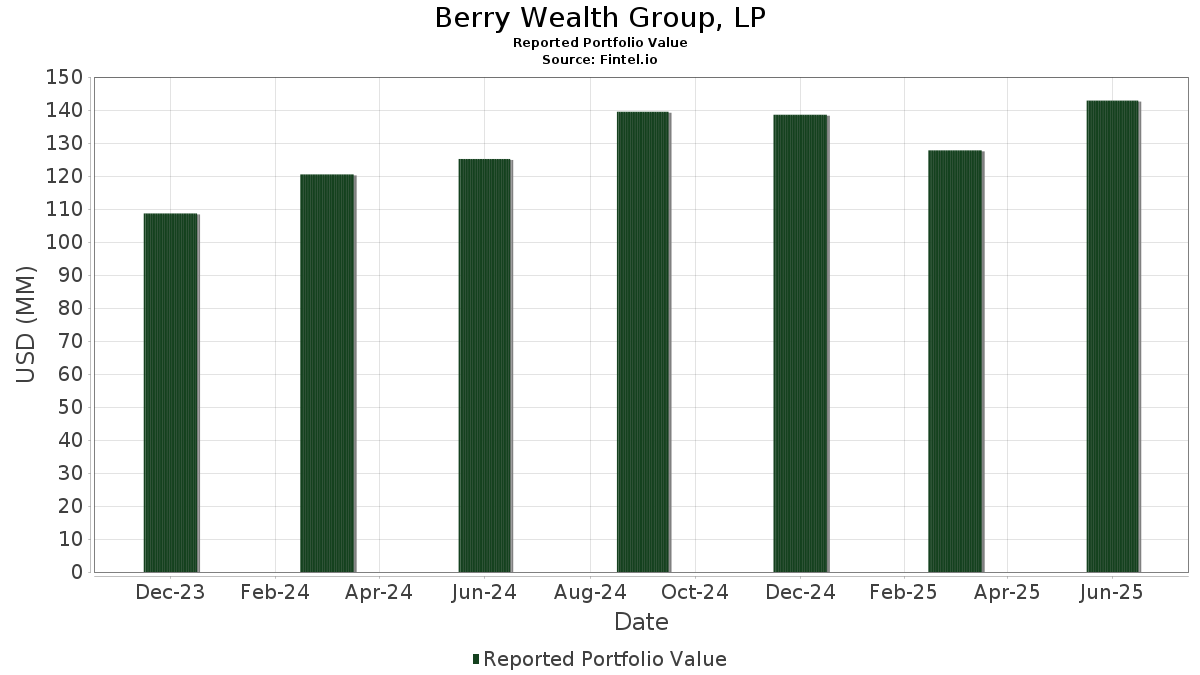
| Nilai Portofolio | $ 142,919,665 |
| Posisi Saat Ini | 107 |
Kepemilikan Terbaru, Kinerja, AUM (dari 13F, 13D)
Berry Wealth Group, LP telah mengungkapkan total kepemilikan 107 dalam pengajuan SEC terbaru mereka. Nilai portofolio terbaru dihitung sebesar $ 142,919,665 USD. Aset yang Dikelola (AUM) sebenarnya adalah nilai ini ditambah kas (yang tidak diungkapkan). Aset-aset utama Berry Wealth Group, LP adalah Broadcom Inc. (US:AVGO) , Microsoft Corporation (US:MSFT) , JPMorgan Chase & Co. (US:JPM) , Apple Inc. (US:AAPL) , and Eaton Corporation plc (US:ETN) . Posisi baru Berry Wealth Group, LP meliputi: JFrog Ltd. (US:FROG) , Mondelez International, Inc. (US:MDLZ) , GE Vernova Inc. (US:GEV) , Amgen Inc. (US:AMGN) , and Williams-Sonoma, Inc. (US:WSM) .
Peningkatan Tertinggi Kuartal Ini
Kami menggunakan perubahan dalam alokasi portofolio karena ini adalah metrik yang paling bermakna. Perubahan dapat disebabkan oleh perdagangan atau perubahan harga saham.
| Keamanan | Saham (MM) |
Nilai (Juta Dolar AS) |
Portfolio % | ΔPorsyento ng Portfolio |
|---|---|---|---|---|
| 0.05 | 12.73 | 8.9098 | 2.8943 | |
| 0.02 | 3.12 | 2.1825 | 1.7070 | |
| 0.02 | 9.18 | 6.4226 | 1.0384 | |
| 0.02 | 6.91 | 4.8363 | 0.7486 | |
| 0.01 | 1.86 | 1.3044 | 0.3360 | |
| 0.03 | 8.18 | 5.7223 | 0.3136 | |
| 0.02 | 2.53 | 1.7720 | 0.2737 | |
| 0.00 | 1.48 | 1.0382 | 0.2008 | |
| 0.01 | 0.27 | 0.1912 | 0.1912 | |
| 0.00 | 0.27 | 0.1898 | 0.1898 |
Penurunan Tertinggi Kuartal Ini
Kami menggunakan perubahan dalam alokasi portofolio karena ini adalah metrik yang paling bermakna. Perubahan dapat disebabkan oleh perdagangan atau perubahan harga saham.
| Keamanan | Saham (MM) |
Nilai (Juta Dolar AS) |
Portfolio % | ΔPorsyento ng Portfolio |
|---|---|---|---|---|
| 0.01 | 1.61 | 1.1253 | -1.1793 | |
| 0.04 | 8.16 | 5.7070 | -1.1393 | |
| 0.02 | 6.82 | 4.7744 | -0.7508 | |
| 0.01 | 3.96 | 2.7689 | -0.4649 | |
| 0.02 | 2.80 | 1.9597 | -0.4526 | |
| 0.01 | 2.51 | 1.7561 | -0.2914 | |
| 0.01 | 4.53 | 3.1666 | -0.2871 | |
| 0.04 | 2.44 | 1.7047 | -0.2584 | |
| 0.05 | 2.04 | 1.4289 | -0.2537 | |
| 0.03 | 2.26 | 1.5788 | -0.2352 |
Pengajuan 13F dan Dana
Formulir ini diajukan pada 2025-08-13 untuk periode pelaporan 2025-06-30. Klik ikon tautan untuk melihat riwayat transaksi selengkapnya.
Tingkatkan ke versi premium untuk membuka data premium dan ekspor ke Excel. ![]() .
.
| Keamanan | Ketik | Harga Saham Rata-rata | Saham (MM) |
ΔSaham (%) |
ΔSaham (%) |
Nilai ($MM) |
Portpolyo (%) |
ΔPortofolio (%) |
|
|---|---|---|---|---|---|---|---|---|---|
| AVGO / Broadcom Inc. | 0.05 | 0.59 | 12.73 | 65.60 | 8.9098 | 2.8943 | |||
| MSFT / Microsoft Corporation | 0.02 | 0.65 | 9.18 | 33.38 | 6.4226 | 1.0384 | |||
| JPM / JPMorgan Chase & Co. | 0.03 | 0.09 | 8.18 | 18.30 | 5.7223 | 0.3136 | |||
| AAPL / Apple Inc. | 0.04 | 0.90 | 8.16 | -6.80 | 5.7070 | -1.1393 | |||
| ETN / Eaton Corporation plc | 0.02 | 0.73 | 6.91 | 32.27 | 4.8363 | 0.7486 | |||
| MSI / Motorola Solutions, Inc. | 0.02 | 0.60 | 6.82 | -3.38 | 4.7744 | -0.7508 | |||
| WMT / Walmart Inc. | 0.06 | 0.06 | 5.72 | 11.45 | 4.0040 | -0.0128 | |||
| MPC / Marathon Petroleum Corporation | 0.03 | 0.16 | 4.55 | 14.20 | 3.1858 | 0.0668 | |||
| HD / The Home Depot, Inc. | 0.01 | 2.47 | 4.53 | 2.51 | 3.1666 | -0.2871 | |||
| CB / Chubb Limited | 0.01 | -0.21 | 3.96 | -4.26 | 2.7689 | -0.4649 | |||
| CME / CME Group Inc. | 0.01 | 1.19 | 3.78 | 5.14 | 2.6463 | -0.1680 | |||
| ABBV / AbbVie Inc. | 0.02 | 479.25 | 3.12 | 413.84 | 2.1825 | 1.7070 | |||
| DRI / Darden Restaurants, Inc. | 0.01 | 2.07 | 3.08 | 7.09 | 2.1552 | -0.0949 | |||
| JNJ / Johnson & Johnson | 0.02 | -1.39 | 2.80 | -9.18 | 1.9597 | -0.4526 | |||
| JCI / Johnson Controls International plc | 0.02 | 0.29 | 2.53 | 32.22 | 1.7720 | 0.2737 | |||
| APD / Air Products and Chemicals, Inc. | 0.01 | 0.26 | 2.51 | -4.13 | 1.7561 | -0.2914 | |||
| ADI / Analog Devices, Inc. | 0.01 | -2.34 | 2.47 | 15.27 | 1.7273 | 0.0519 | |||
| O / Realty Income Corporation | 0.04 | -2.24 | 2.44 | -2.91 | 1.7047 | -0.2584 | |||
| MDT / Medtronic plc | 0.03 | 0.31 | 2.26 | -2.67 | 1.5788 | -0.2352 | |||
| VZ / Verizon Communications Inc. | 0.05 | -0.47 | 2.04 | -5.02 | 1.4289 | -0.2537 | |||
| FIS / Fidelity National Information Services, Inc. | 0.02 | 0.22 | 1.94 | 9.25 | 1.3558 | -0.0317 | |||
| NVDA / NVIDIA Corporation | 0.01 | 3.32 | 1.86 | 50.69 | 1.3044 | 0.3360 | |||
| CMI / Cummins Inc. | 0.01 | 1.22 | 1.77 | 5.73 | 1.2395 | -0.0709 | |||
| CMCSA / Comcast Corporation | 0.05 | -1.14 | 1.74 | -4.39 | 1.2209 | -0.2067 | |||
| PEG / Public Service Enterprise Group Incorporated | 0.02 | 2.26 | 1.69 | 4.64 | 1.1841 | -0.0816 | |||
| UNH / UnitedHealth Group Incorporated | 0.01 | -8.36 | 1.61 | -45.40 | 1.1253 | -1.1793 | |||
| UNP / Union Pacific Corporation | 0.01 | -2.24 | 1.59 | -4.80 | 1.1116 | -0.1938 | |||
| META / Meta Platforms, Inc. | 0.00 | 8.24 | 1.48 | 38.60 | 1.0382 | 0.2008 | |||
| AMZN / Amazon.com, Inc. | 0.01 | -2.78 | 1.34 | 12.10 | 0.9398 | 0.0025 | |||
| XOM / Exxon Mobil Corporation | 0.01 | 0.45 | 1.21 | -9.00 | 0.8498 | -0.1938 | |||
| V / Visa Inc. | 0.00 | 1.52 | 1.19 | 2.77 | 0.8319 | -0.0726 | |||
| BBY / Best Buy Co., Inc. | 0.02 | -4.44 | 1.17 | -12.85 | 0.8211 | -0.2324 | |||
| NEE / NextEra Energy, Inc. | 0.02 | 0.12 | 1.17 | -1.93 | 0.8160 | -0.1146 | |||
| TT / Trane Technologies plc | 0.00 | 4.07 | 1.12 | 35.23 | 0.7817 | 0.1350 | |||
| GOOGL / Alphabet Inc. | 0.01 | 3.04 | 1.03 | 17.50 | 0.7235 | 0.0345 | |||
| TJX / The TJX Companies, Inc. | 0.01 | 19.39 | 0.81 | 21.01 | 0.5687 | 0.0434 | |||
| TXN / Texas Instruments Incorporated | 0.00 | 11.91 | 0.78 | 29.26 | 0.5474 | 0.0741 | |||
| PG / The Procter & Gamble Company | 0.00 | 2.86 | 0.70 | -3.85 | 0.4895 | -0.0796 | |||
| AMD / Advanced Micro Devices, Inc. | 0.00 | 4.71 | 0.58 | 44.61 | 0.4040 | 0.0917 | |||
| TSLA / Tesla, Inc. | 0.00 | 2.61 | 0.57 | 25.88 | 0.4019 | 0.0446 | |||
| CRM / Salesforce, Inc. | 0.00 | -20.92 | 0.55 | -19.71 | 0.3853 | -0.1508 | |||
| IBM / International Business Machines Corporation | 0.00 | 0.93 | 0.51 | 19.63 | 0.3585 | 0.0235 | |||
| VOO / Vanguard Index Funds - Vanguard S&P 500 ETF | 0.00 | -1.83 | 0.46 | 8.55 | 0.3201 | -0.0094 | |||
| GS / The Goldman Sachs Group, Inc. | 0.00 | -7.04 | 0.45 | 20.43 | 0.3140 | 0.0225 | |||
| SPGI / S&P Global Inc. | 0.00 | 3.93 | 0.45 | 7.99 | 0.3122 | -0.0113 | |||
| MCD / McDonald's Corporation | 0.00 | 1.22 | 0.41 | -5.30 | 0.2879 | -0.0521 | |||
| MS / Morgan Stanley | 0.00 | 10.30 | 0.41 | 33.33 | 0.2859 | 0.0459 | |||
| NXPI / NXP Semiconductors N.V. | 0.00 | 4.55 | 0.40 | 20.06 | 0.2810 | 0.0196 | |||
| FI / Fiserv, Inc. | 0.00 | -0.99 | 0.40 | -22.76 | 0.2784 | -0.1243 | |||
| CVX / Chevron Corporation | 0.00 | 20.74 | 0.40 | 3.40 | 0.2765 | -0.0226 | |||
| IUSV / iShares Trust - iShares Core S&P U.S. Value ETF | 0.00 | 14.68 | 0.39 | 17.58 | 0.2720 | 0.0134 | |||
| ORI / Old Republic International Corporation | 0.01 | 9.35 | 0.38 | 7.26 | 0.2690 | -0.0116 | |||
| UL / Unilever PLC - Depositary Receipt (Common Stock) | 0.01 | 8.19 | 0.37 | 11.34 | 0.2611 | -0.0016 | |||
| RTX / RTX Corporation | 0.00 | 41.71 | 0.37 | 56.60 | 0.2576 | 0.0732 | |||
| WMB / The Williams Companies, Inc. | 0.01 | 11.82 | 0.37 | 17.63 | 0.2570 | 0.0125 | |||
| KO / The Coca-Cola Company | 0.01 | 56.05 | 0.36 | 54.24 | 0.2549 | 0.0700 | |||
| FANG / Diamondback Energy, Inc. | 0.00 | 33.20 | 0.36 | 14.51 | 0.2546 | 0.0060 | |||
| PNR / Pentair plc | 0.00 | 11.87 | 0.35 | 31.58 | 0.2450 | 0.0364 | |||
| PAYX / Paychex, Inc. | 0.00 | 8.25 | 0.34 | 2.11 | 0.2377 | -0.0227 | |||
| ARES / Ares Management Corporation | 0.00 | 0.46 | 0.34 | 18.66 | 0.2361 | 0.0137 | |||
| ALL / The Allstate Corporation | 0.00 | 4.66 | 0.33 | 1.83 | 0.2340 | -0.0232 | |||
| HLI / Houlihan Lokey, Inc. | 0.00 | 0.71 | 0.33 | 12.50 | 0.2331 | 0.0008 | |||
| COP / ConocoPhillips | 0.00 | -3.08 | 0.32 | -17.28 | 0.2216 | -0.0775 | |||
| CMG / Chipotle Mexican Grill, Inc. | 0.01 | 2.20 | 0.32 | 14.55 | 0.2205 | 0.0048 | |||
| AXP / American Express Company | 0.00 | -12.89 | 0.31 | 3.38 | 0.2143 | -0.0177 | |||
| WSO / Watsco, Inc. | 0.00 | 8.15 | 0.30 | -6.17 | 0.2132 | -0.0405 | |||
| DUK / Duke Energy Corporation | 0.00 | 16.16 | 0.30 | 12.59 | 0.2131 | 0.0011 | |||
| RJF / Raymond James Financial, Inc. | 0.00 | -6.80 | 0.30 | 2.74 | 0.2104 | -0.0182 | |||
| STE / STERIS plc | 0.00 | 5.30 | 0.30 | 11.52 | 0.2102 | -0.0004 | |||
| CAT / Caterpillar Inc. | 0.00 | -7.84 | 0.29 | 8.18 | 0.2042 | -0.0064 | |||
| LAMR / Lamar Advertising Company | 0.00 | 6.30 | 0.29 | 13.49 | 0.2007 | 0.0028 | |||
| IQV / IQVIA Holdings Inc. | 0.00 | 2.83 | 0.29 | -8.06 | 0.2000 | -0.0433 | |||
| SNA / Snap-on Incorporated | 0.00 | 9.10 | 0.28 | 0.71 | 0.1984 | -0.0218 | |||
| TECH / Bio-Techne Corporation | 0.01 | 43.06 | 0.28 | 25.91 | 0.1941 | 0.0212 | |||
| SO / The Southern Company | 0.00 | 1.69 | 0.28 | 1.47 | 0.1938 | -0.0196 | |||
| FROG / JFrog Ltd. | 0.01 | 0.27 | 0.1912 | 0.1912 | |||||
| MDLZ / Mondelez International, Inc. | 0.00 | 0.27 | 0.1898 | 0.1898 | |||||
| GEV / GE Vernova Inc. | 0.00 | 0.27 | 0.1877 | 0.1877 | |||||
| MANH / Manhattan Associates, Inc. | 0.00 | 0.27 | 0.1864 | 0.1864 | |||||
| KDP / Keurig Dr Pepper Inc. | 0.01 | 9.18 | 0.26 | 5.69 | 0.1819 | -0.0109 | |||
| DXCM / DexCom, Inc. | 0.00 | 0.25 | 0.1755 | 0.1755 | |||||
| BFAM / Bright Horizons Family Solutions Inc. | 0.00 | -0.35 | 0.24 | -2.80 | 0.1701 | -0.0261 | |||
| AMGN / Amgen Inc. | 0.00 | 0.24 | 0.1690 | 0.1690 | |||||
| BIL / SPDR Series Trust - SPDR Bloomberg 1-3 Month T-Bill ETF | 0.00 | -14.95 | 0.24 | -15.25 | 0.1679 | -0.0528 | |||
| SPG / Simon Property Group, Inc. | 0.00 | 9.27 | 0.24 | 5.78 | 0.1670 | -0.0095 | |||
| LECO / Lincoln Electric Holdings, Inc. | 0.00 | 0.17 | 0.24 | 9.72 | 0.1664 | -0.0031 | |||
| COST / Costco Wholesale Corporation | 0.00 | 0.42 | 0.24 | 4.89 | 0.1655 | -0.0105 | |||
| RBC / RBC Bearings Incorporated | 0.00 | -6.69 | 0.24 | 11.85 | 0.1653 | -0.0003 | |||
| EXR / Extra Space Storage Inc. | 0.00 | 9.65 | 0.23 | 8.84 | 0.1641 | -0.0044 | |||
| CTRA / Coterra Energy Inc. | 0.01 | -2.99 | 0.23 | -14.76 | 0.1619 | -0.0506 | |||
| WSM / Williams-Sonoma, Inc. | 0.00 | 0.23 | 0.1612 | 0.1612 | |||||
| SIGI / Selective Insurance Group, Inc. | 0.00 | 0.12 | 0.23 | -5.46 | 0.1579 | -0.0284 | |||
| GOLF / Acushnet Holdings Corp. | 0.00 | 0.68 | 0.23 | 6.64 | 0.1577 | -0.0074 | |||
| EXLS / ExlService Holdings, Inc. | 0.01 | 0.32 | 0.22 | -7.17 | 0.1545 | -0.0311 | |||
| BAC / Bank of America Corporation | 0.00 | 0.22 | 0.1540 | 0.1540 | |||||
| SSD / Simpson Manufacturing Co., Inc. | 0.00 | 0.21 | 0.1502 | 0.1502 | |||||
| MA / Mastercard Incorporated | 0.00 | 0.21 | 0.1478 | 0.1478 | |||||
| GMED / Globus Medical, Inc. | 0.00 | 0.28 | 0.21 | -19.23 | 0.1471 | -0.0563 | |||
| RFG / Invesco Exchange-Traded Fund Trust - Invesco S&P MidCap 400 Pure Growth ETF | 0.00 | 0.21 | 0.1450 | 0.1450 | |||||
| RGA / Reinsurance Group of America, Incorporated | 0.00 | -31.96 | 0.21 | -31.56 | 0.1445 | -0.0912 | |||
| CRAI / CRA International, Inc. | 0.00 | 0.21 | 0.1443 | 0.1443 | |||||
| NFLX / Netflix, Inc. | 0.00 | 0.21 | 0.1443 | 0.1443 | |||||
| GOOG / Alphabet Inc. | 0.00 | -11.23 | 0.20 | 1.00 | 0.1423 | -0.0155 | |||
| EW / Edwards Lifesciences Corporation | 0.00 | 0.20 | 0.1417 | 0.1417 | |||||
| HON / Honeywell International Inc. | 0.00 | 0.20 | 0.1411 | 0.1411 | |||||
| NFJ / Virtus Dividend, Interest & Premium Strategy Fund | 0.01 | 2.11 | 0.14 | 4.51 | 0.0975 | -0.0069 | |||
| NMRK / Newmark Group, Inc. | 0.01 | 0.06 | 0.13 | 0.00 | 0.0889 | -0.0106 | |||
| LHX / L3Harris Technologies, Inc. | 0.00 | -100.00 | 0.00 | 0.0000 | |||||
| MRK / Merck & Co., Inc. | 0.00 | -100.00 | 0.00 | 0.0000 | |||||
| ACN / Accenture plc | 0.00 | -100.00 | 0.00 | 0.0000 | |||||
| CNS / Cohen & Steers, Inc. | 0.00 | -100.00 | 0.00 | 0.0000 |