Mga Batayang Estadistika
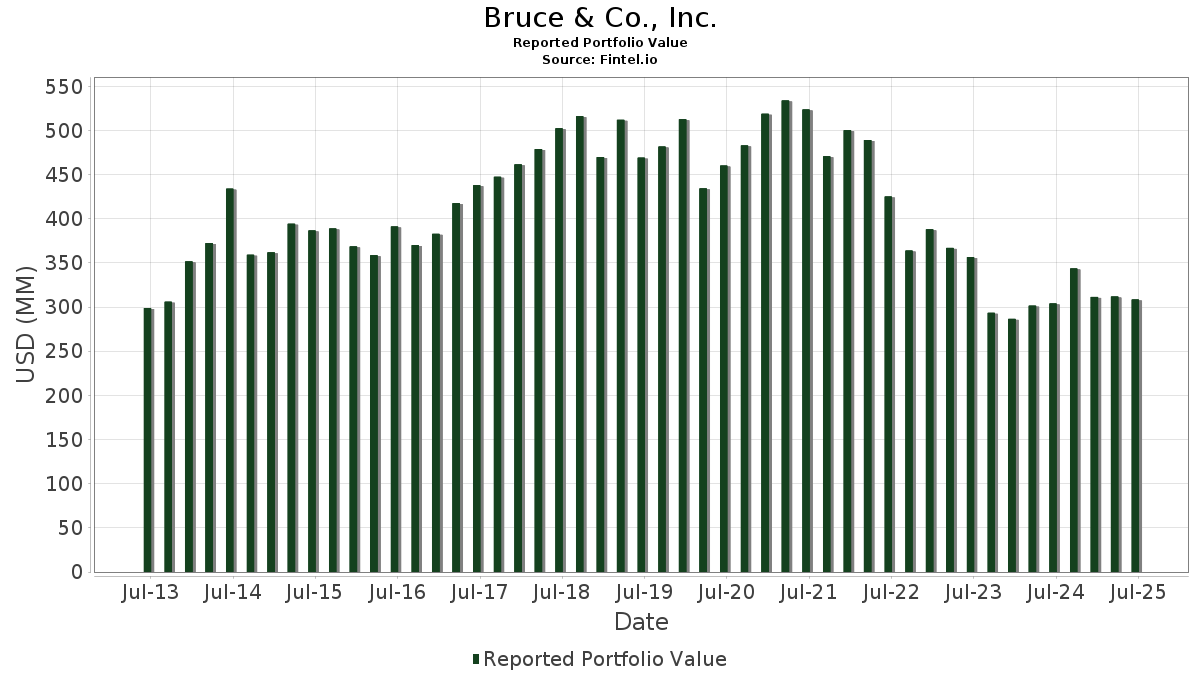
| Nilai Portofolio | $ 308,468,802 |
| Posisi Saat Ini | 41 |
Kepemilikan Terbaru, Kinerja, AUM (dari 13F, 13D)
Bruce & Co., Inc. telah mengungkapkan total kepemilikan 41 dalam pengajuan SEC terbaru mereka. Nilai portofolio terbaru dihitung sebesar $ 308,468,802 USD. Aset yang Dikelola (AUM) sebenarnya adalah nilai ini ditambah kas (yang tidak diungkapkan). Aset-aset utama Bruce & Co., Inc. adalah The Allstate Corporation (US:ALL) , U-Haul Holding Company - Series N (US:UHALB) , AbbVie Inc. (US:ABBV) , NextEra Energy, Inc. (US:NEE) , and AerCap Holdings N.V. (US:AER) . Posisi baru Bruce & Co., Inc. meliputi: LyondellBasell Industries N.V. (US:LYB) , Accelerate Diagnostics, Inc. (US:US00430HAC60) , .
Peningkatan Tertinggi Kuartal Ini
Kami menggunakan perubahan dalam alokasi portofolio karena ini adalah metrik yang paling bermakna. Perubahan dapat disebabkan oleh perdagangan atau perubahan harga saham.
| Keamanan | Saham (MM) |
Nilai (Juta Dolar AS) |
Portfolio % | ΔPorsyento ng Portfolio |
|---|---|---|---|---|
| 0.34 | 12.78 | 4.1426 | 1.2462 | |
| 0.18 | 21.47 | 6.9600 | 0.9477 | |
| 0.04 | 2.31 | 0.7503 | 0.7503 | |
| 0.10 | 5.83 | 1.8887 | 0.3404 | |
| 0.09 | 4.08 | 1.3234 | 0.2733 | |
| 0.25 | 1.66 | 0.5380 | 0.2533 | |
| 0.67 | 19.48 | 6.3140 | 0.2105 | |
| 0.13 | 18.20 | 5.8995 | 0.2077 | |
| 0.13 | 4.97 | 1.6112 | 0.1986 | |
| 0.10 | 1.56 | 0.5051 | 0.1748 |
Penurunan Tertinggi Kuartal Ini
Kami menggunakan perubahan dalam alokasi portofolio karena ini adalah metrik yang paling bermakna. Perubahan dapat disebabkan oleh perdagangan atau perubahan harga saham.
| Keamanan | Saham (MM) |
Nilai (Juta Dolar AS) |
Portfolio % | ΔPorsyento ng Portfolio |
|---|---|---|---|---|
| 0.20 | 13.58 | 4.4020 | -1.0416 | |
| 0.13 | 23.67 | 7.6723 | -0.8946 | |
| 0.19 | 15.26 | 4.9477 | -0.8899 | |
| 0.45 | 24.58 | 7.9668 | -0.6114 | |
| 0.20 | 7.65 | 2.4790 | -0.2266 | |
| 0.66 | 0.2135 | -0.2089 | ||
| 0.04 | 7.98 | 2.5873 | -0.1837 | |
| 0.18 | 20.75 | 6.7256 | -0.1514 | |
| 0.13 | 25.26 | 8.1903 | -0.1436 | |
| 0.19 | 13.25 | 4.2939 | -0.1215 |
Pengajuan 13F dan Dana
Formulir ini diajukan pada 2025-08-14 untuk periode pelaporan 2025-06-30. Klik ikon tautan untuk melihat riwayat transaksi selengkapnya.
Tingkatkan ke versi premium untuk membuka data premium dan ekspor ke Excel. ![]() .
.
| Keamanan | Ketik | Harga Saham Rata-rata | Saham (MM) |
ΔSaham (%) |
ΔSaham (%) |
Nilai ($MM) |
Portpolyo (%) |
ΔPortofolio (%) |
|
|---|---|---|---|---|---|---|---|---|---|
| ALL / The Allstate Corporation | 0.13 | 0.00 | 25.26 | -2.78 | 8.1903 | -0.1436 | |||
| UHALB / U-Haul Holding Company - Series N | 0.45 | 0.00 | 24.58 | -8.13 | 7.9668 | -0.6114 | |||
| ABBV / AbbVie Inc. | 0.13 | 0.00 | 23.67 | -11.41 | 7.6723 | -0.8946 | |||
| NEE / NextEra Energy, Inc. | 0.32 | 0.00 | 21.87 | -2.07 | 7.0890 | -0.0721 | |||
| AER / AerCap Holdings N.V. | 0.18 | 0.00 | 21.47 | 14.51 | 6.9600 | 0.9477 | |||
| DUK / Duke Energy Corporation | 0.18 | 0.00 | 20.75 | -3.25 | 6.7256 | -0.1514 | |||
| T / AT&T Inc. | 0.67 | 0.00 | 19.48 | 2.33 | 6.3140 | 0.2105 | |||
| ABT / Abbott Laboratories | 0.13 | 0.00 | 18.20 | 2.54 | 5.8995 | 0.2077 | |||
| MRK / Merck & Co., Inc. | 0.19 | -4.93 | 15.26 | -16.16 | 4.9477 | -0.8899 | |||
| CMS / CMS Energy Corporation | 0.20 | -13.27 | 13.58 | -20.01 | 4.4020 | -1.0416 | |||
| XEL / Xcel Energy Inc. | 0.19 | 0.00 | 13.25 | -3.80 | 4.2939 | -0.1215 | |||
| IIIN / Insteel Industries, Inc. | 0.34 | 0.00 | 12.78 | 41.47 | 4.1426 | 1.2462 | |||
| AAPL / Apple Inc. | 0.04 | 0.00 | 7.98 | -7.63 | 2.5873 | -0.1837 | |||
| AVA / Avista Corporation | 0.20 | 0.00 | 7.65 | -9.36 | 2.4790 | -0.2266 | |||
| PFE / Pfizer Inc. | 0.27 | 0.00 | 6.59 | -4.34 | 2.1366 | -0.0729 | |||
| BG / Bunge Global SA | 0.08 | 0.00 | 6.42 | 5.05 | 2.0820 | 0.1215 | |||
| NEM / Newmont Corporation | 0.10 | 0.00 | 5.83 | 20.67 | 1.8887 | 0.3404 | |||
| ADM / Archer-Daniels-Midland Company | 0.10 | 0.00 | 5.28 | 9.94 | 1.7110 | 0.1714 | |||
| DAR / Darling Ingredients Inc. | 0.13 | -7.09 | 4.97 | 12.85 | 1.6112 | 0.1986 | |||
| UHAL / U-Haul Holding Company | 0.07 | 0.00 | 4.48 | -7.35 | 1.4508 | -0.0981 | |||
| VICR / Vicor Corporation | 0.09 | 28.57 | 4.08 | 24.68 | 1.3234 | 0.2733 | |||
| RLI / RLI Corp. | 0.04 | 0.00 | 2.95 | -10.10 | 0.9552 | -0.0958 | |||
| CC / The Chemours Company | 0.25 | 25.00 | 2.86 | 5.76 | 0.9280 | 0.0602 | |||
| SUPN / Supernus Pharmaceuticals, Inc. | 0.08 | 0.00 | 2.59 | -3.76 | 0.8390 | -0.0233 | |||
| LYB / LyondellBasell Industries N.V. | 0.04 | 2.31 | 0.7503 | 0.7503 | |||||
| PSNL / Personalis, Inc. | 0.25 | 0.00 | 1.66 | 86.82 | 0.5380 | 0.2533 | |||
| LLY / Eli Lilly and Company | 0.00 | 0.00 | 1.56 | -5.57 | 0.5054 | -0.0243 | |||
| VG / Venture Global, Inc. | 0.10 | 0.00 | 1.56 | 51.26 | 0.5051 | 0.1748 | |||
| XM Sirius / (82968B103) | 0.06 | 1.28 | 0.0000 | ||||||
| KOD / Kodiak Sciences Inc. | 0.32 | 0.00 | 1.20 | 32.75 | 0.3906 | 0.0995 | |||
| 91911K102 / Bausch Health Companies | 0.17 | 0.00 | 1.14 | 2.89 | 0.3692 | 0.0144 | |||
| EDAP / EDAP TMS S.A. - Depositary Receipt (Common Stock) | 0.55 | 0.00 | 0.91 | -16.41 | 0.2944 | -0.0536 | |||
| ASH / Ashland Inc. | 0.01 | 0.00 | 0.75 | -15.19 | 0.2445 | -0.0407 | |||
| MNKD / MannKind Corporation | 0.20 | 0.00 | 0.73 | -25.69 | 0.2365 | -0.0782 | |||
| LVTX / LAVA Therapeutics N.V. | 0.52 | 0.00 | 0.69 | 3.93 | 0.2233 | 0.0108 | |||
| US00430HAC60 / Accelerate Diagnostics, Inc. | 0.66 | -50.04 | 0.2135 | -0.2089 | |||||
| VTRS / Viatris Inc. | 0.06 | 0.00 | 0.52 | 2.56 | 0.1687 | 0.0059 | |||
| MASS / 908 Devices Inc. | 0.07 | 0.00 | 0.49 | 59.34 | 0.1578 | 0.0597 | |||
| FATE / Fate Therapeutics, Inc. | 0.43 | -21.97 | 0.48 | 10.60 | 0.1558 | 0.0165 | |||
| WEC / WEC Energy Group, Inc. | 0.00 | 0.00 | 0.41 | 11.08 | 0.1333 | 0.0143 | |||
| CRBU / Caribou Biosciences, Inc. | 0.25 | 0.00 | 0.32 | 38.77 | 0.1021 | 0.0292 | |||
| IGMS / IGM Biosciences, Inc. | 0.00 | -100.00 | 0.00 | 0.0000 | |||||
| OGN / Organon & Co. | 0.00 | -100.00 | 0.00 | 0.0000 |