Mga Batayang Estadistika
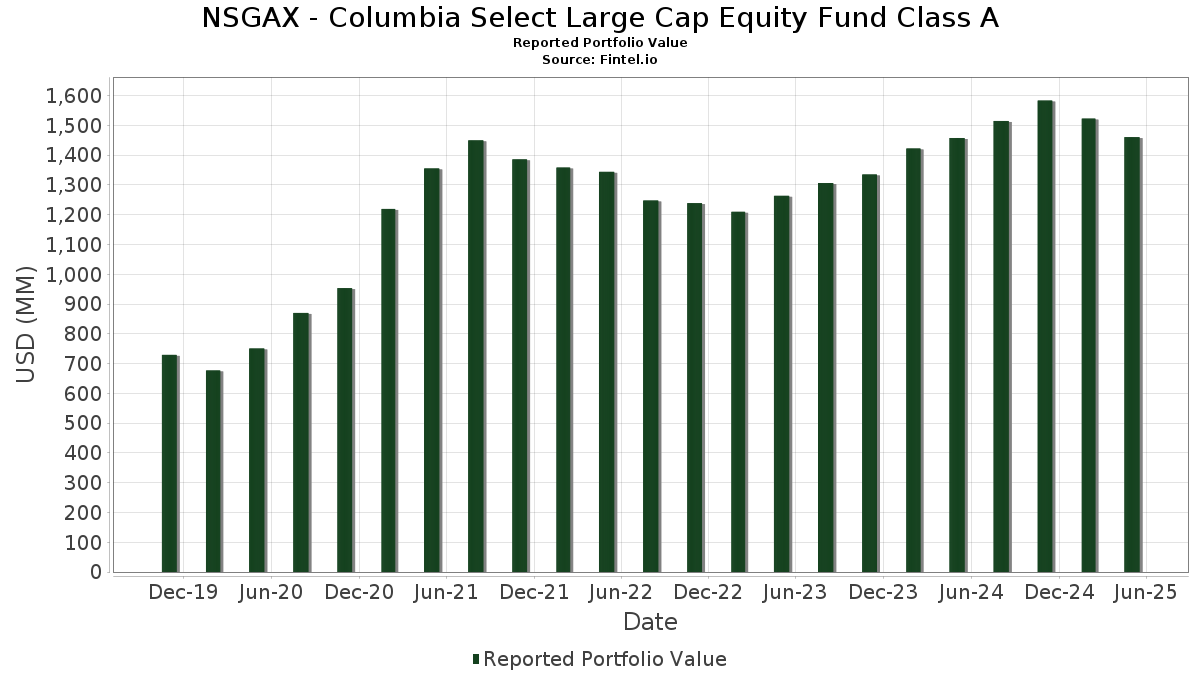
| Nilai Portofolio | $ 1,460,439,000 |
| Posisi Saat Ini | 55 |
Kepemilikan Terbaru, Kinerja, AUM (dari 13F, 13D)
NSGAX - Columbia Select Large Cap Equity Fund Class A telah mengungkapkan total kepemilikan 55 dalam pengajuan SEC terbaru mereka. Nilai portofolio terbaru dihitung sebesar $ 1,460,439,000 USD. Aset yang Dikelola (AUM) sebenarnya adalah nilai ini ditambah kas (yang tidak diungkapkan). Aset-aset utama NSGAX - Columbia Select Large Cap Equity Fund Class A adalah Microsoft Corporation (US:MSFT) , NVIDIA Corporation (US:NVDA) , Apple Inc. (US:AAPL) , Amazon.com, Inc. (US:AMZN) , and Alphabet Inc. (US:GOOG) . Posisi baru NSGAX - Columbia Select Large Cap Equity Fund Class A meliputi: Synopsys, Inc. (US:SNPS) , Cencora, Inc. (US:COR) , ON Semiconductor Corporation (US:ON) , EQT Corporation (US:EQT) , and .
Peningkatan Tertinggi Kuartal Ini
Kami menggunakan perubahan dalam alokasi portofolio karena ini adalah metrik yang paling bermakna. Perubahan dapat disebabkan oleh perdagangan atau perubahan harga saham.
| Keamanan | Saham (MM) |
Nilai (Juta Dolar AS) |
Portfolio % | ΔPorsyento ng Portfolio |
|---|---|---|---|---|
| 0.04 | 16.85 | 1.1528 | 1.1528 | |
| 0.24 | 16.81 | 1.1501 | 1.1501 | |
| 0.26 | 120.58 | 8.2513 | 1.1429 | |
| 0.05 | 14.98 | 1.0249 | 1.0249 | |
| 0.36 | 14.94 | 1.0220 | 1.0220 | |
| 0.08 | 13.54 | 0.9267 | 0.9267 | |
| 0.27 | 12.95 | 0.8859 | 0.8859 | |
| 0.16 | 8.69 | 0.5950 | 0.5950 | |
| 0.77 | 103.78 | 7.1020 | 0.5369 | |
| 0.08 | 23.00 | 1.5739 | 0.4010 |
Penurunan Tertinggi Kuartal Ini
Kami menggunakan perubahan dalam alokasi portofolio karena ini adalah metrik yang paling bermakna. Perubahan dapat disebabkan oleh perdagangan atau perubahan harga saham.
| Keamanan | Saham (MM) |
Nilai (Juta Dolar AS) |
Portfolio % | ΔPorsyento ng Portfolio |
|---|---|---|---|---|
| 0.39 | 78.82 | 5.3940 | -1.1523 | |
| 0.11 | 25.75 | 1.7623 | -0.9723 | |
| 0.17 | 28.15 | 1.9260 | -0.7350 | |
| 0.29 | 28.88 | 1.9760 | -0.6509 | |
| 0.04 | 29.78 | 2.0380 | -0.5911 | |
| 0.25 | 26.01 | 1.7798 | -0.5033 | |
| 0.36 | 62.14 | 4.2520 | -0.4961 | |
| 0.15 | 14.44 | 0.9880 | -0.4804 | |
| 0.06 | 15.89 | 1.0872 | -0.4750 | |
| 0.67 | 11.73 | 0.8028 | -0.3955 |
Pengajuan 13F dan Dana
Formulir ini diajukan pada 2025-07-25 untuk periode pelaporan 2025-05-31. Klik ikon tautan untuk melihat riwayat transaksi selengkapnya.
Tingkatkan ke versi premium untuk membuka data premium dan ekspor ke Excel. ![]() .
.
| Keamanan | Ketik | Harga Saham Rata-rata | Saham (MM) |
ΔSaham (%) |
ΔSaham (%) |
Nilai ($MM) |
Portpolyo (%) |
ΔPortofolio (%) |
|
|---|---|---|---|---|---|---|---|---|---|
| MSFT / Microsoft Corporation | 0.26 | -4.00 | 120.58 | 11.33 | 8.2513 | 1.1429 | |||
| NVDA / NVIDIA Corporation | 0.77 | -4.09 | 103.78 | 3.75 | 7.1020 | 0.5369 | |||
| AAPL / Apple Inc. | 0.39 | -4.85 | 78.82 | -20.97 | 5.3940 | -1.1523 | |||
| AMZN / Amazon.com, Inc. | 0.36 | -2.81 | 74.02 | -6.14 | 5.0651 | -0.1103 | |||
| GOOG / Alphabet Inc. | 0.36 | -14.43 | 62.14 | -14.11 | 4.2520 | -0.4961 | |||
| META / Meta Platforms, Inc. | 0.09 | -8.36 | 57.61 | -11.20 | 3.9426 | -0.3155 | |||
| JPM / JPMorgan Chase & Co. | 0.15 | 1.21 | 39.41 | 0.96 | 2.6970 | 0.1349 | |||
| MA / Mastercard Incorporated | 0.07 | -7.06 | 38.78 | -5.56 | 2.6536 | -0.0414 | |||
| LLY / Eli Lilly and Company | 0.04 | -7.21 | 29.78 | -25.66 | 2.0380 | -0.5911 | |||
| BAC / Bank of America Corporation | 0.66 | -3.33 | 29.11 | -7.46 | 1.9919 | -0.0725 | |||
| WMT / Walmart Inc. | 0.29 | -27.94 | 28.88 | -27.86 | 1.9760 | -0.6509 | |||
| BLK / BlackRock, Inc. | 0.03 | -0.72 | 28.36 | -0.51 | 1.9408 | 0.0699 | |||
| PG / The Procter & Gamble Company | 0.17 | -28.97 | 28.15 | -30.58 | 1.9260 | -0.7350 | |||
| XOM / Exxon Mobil Corporation | 0.25 | -18.63 | 26.01 | -25.23 | 1.7798 | -0.5033 | |||
| T / AT&T Inc. | 0.93 | -37.70 | 25.77 | 4.52 | 1.7636 | -0.0818 | |||
| AVGO / Broadcom Inc. | 0.11 | -49.08 | 25.75 | -38.19 | 1.7623 | -0.9723 | |||
| HIG / The Hartford Insurance Group, Inc. | 0.20 | 12.31 | 25.67 | 23.29 | 1.7567 | 0.3901 | |||
| GS / The Goldman Sachs Group, Inc. | 0.04 | -3.15 | 24.39 | -6.55 | 1.6692 | -0.0439 | |||
| GD / General Dynamics Corporation | 0.08 | 16.73 | 23.00 | 28.70 | 1.5739 | 0.4010 | |||
| TJX / The TJX Companies, Inc. | 0.17 | -14.15 | 22.08 | -12.68 | 1.5112 | -0.1486 | |||
| BSX / Boston Scientific Corporation | 0.21 | 3.60 | 22.01 | 5.07 | 1.5063 | 0.1313 | |||
| ETN / Eaton Corporation plc | 0.07 | 11.89 | 21.88 | 22.15 | 1.4972 | 0.3216 | |||
| CTAS / Cintas Corporation | 0.10 | -0.72 | 21.54 | 8.37 | 1.4741 | 0.1695 | |||
| RSG / Republic Services, Inc. | 0.08 | -22.79 | 21.51 | -16.19 | 1.4717 | -0.2124 | |||
| NOW / ServiceNow, Inc. | 0.02 | 3.96 | 21.34 | 13.06 | 1.4606 | 0.2216 | |||
| ADBE / Adobe Inc. | 0.05 | 7.65 | 20.75 | 1.89 | 1.4197 | 0.0834 | |||
| C / Citigroup Inc. | 0.27 | -17.93 | 20.52 | -22.69 | 1.4040 | -0.3376 | |||
| ISRG / Intuitive Surgical, Inc. | 0.04 | -4.25 | 20.31 | -7.72 | 1.3897 | -0.0547 | |||
| PH / Parker-Hannifin Corporation | 0.03 | -5.89 | 19.98 | -6.43 | 1.3673 | -0.0341 | |||
| TEL / TE Connectivity plc | 0.12 | -17.07 | 19.50 | -13.81 | 1.3346 | -0.1506 | |||
| PANW / Palo Alto Networks, Inc. | 0.10 | -9.08 | 18.66 | -8.13 | 1.2770 | -0.0561 | |||
| ETR / Entergy Corporation | 0.21 | 19.72 | 17.40 | -1.84 | 1.1905 | -0.0545 | |||
| EQIX / Equinix, Inc. | 0.02 | -5.20 | 17.00 | -6.85 | 1.1634 | -0.0345 | |||
| SWK / Stanley Black & Decker, Inc. | 0.26 | 22.27 | 16.95 | -7.55 | 1.1597 | -0.0433 | |||
| SNPS / Synopsys, Inc. | 0.04 | 16.85 | 1.1528 | 1.1528 | |||||
| XEL / Xcel Energy Inc. | 0.24 | 16.81 | 1.1501 | 1.1501 | |||||
| DTE / DTE Energy Company | 0.12 | -15.80 | 16.73 | -13.94 | 1.1449 | -0.1310 | |||
| GM / General Motors Company | 0.33 | -11.85 | 16.55 | -10.99 | 1.1323 | -0.0878 | |||
| NKE / NIKE, Inc. | 0.27 | 24.98 | 16.28 | -20.33 | 1.1139 | -0.2868 | |||
| VRTX / Vertex Pharmaceuticals Incorporated | 0.04 | 25.50 | 16.17 | 15.63 | 1.1064 | 0.1887 | |||
| TMO / Thermo Fisher Scientific Inc. | 0.04 | -5.22 | 15.93 | -27.92 | 1.0899 | -0.3049 | |||
| HLT / Hilton Worldwide Holdings Inc. | 0.06 | -28.82 | 15.89 | -33.26 | 1.0872 | -0.4750 | |||
| TSLA / Tesla, Inc. | 0.04 | -33.25 | 15.56 | -21.07 | 1.0647 | -0.2290 | |||
| COR / Cencora, Inc. | 0.05 | 14.98 | 1.0249 | 1.0249 | |||||
| ON / ON Semiconductor Corporation | 0.36 | 14.94 | 1.0220 | 1.0220 | |||||
| AEE / Ameren Corporation | 0.15 | -32.35 | 14.44 | -35.47 | 0.9880 | -0.4804 | |||
| DDOG / Datadog, Inc. | 0.12 | 40.50 | 13.73 | 42.10 | 0.9395 | 0.3054 | |||
| STZ / Constellation Brands, Inc. | 0.08 | 13.54 | 0.9267 | 0.9267 | |||||
| BMY / Bristol-Myers Squibb Company | 0.27 | 12.95 | 0.8859 | 0.8859 | |||||
| O / Realty Income Corporation | 0.22 | -15.75 | 12.60 | -11.59 | 0.8621 | -0.2044 | |||
| DOC / Healthpeak Properties, Inc. | 0.67 | -24.49 | 11.73 | -35.74 | 0.8028 | -0.3955 | |||
| 19766H239 / COLUMBIA SHORT TERM CASH FUND | 10.88 | 61.38 | 10.87 | 61.35 | 0.7440 | 0.3018 | |||
| EQT / EQT Corporation | 0.16 | 8.69 | 0.5950 | 0.5950 | |||||
| GTLB / GitLab Inc. | 0.16 | 13.23 | 7.15 | -14.42 | 0.4890 | -0.0590 | |||
| INSM / Insmed Incorporated | 0.10 | -0.72 | 6.64 | -15.12 | 0.4542 | -0.0590 |