Mga Batayang Estadistika
| Nilai Portofolio | $ 2,270,497,319 |
| Posisi Saat Ini | 117 |
Kepemilikan Terbaru, Kinerja, AUM (dari 13F, 13D)
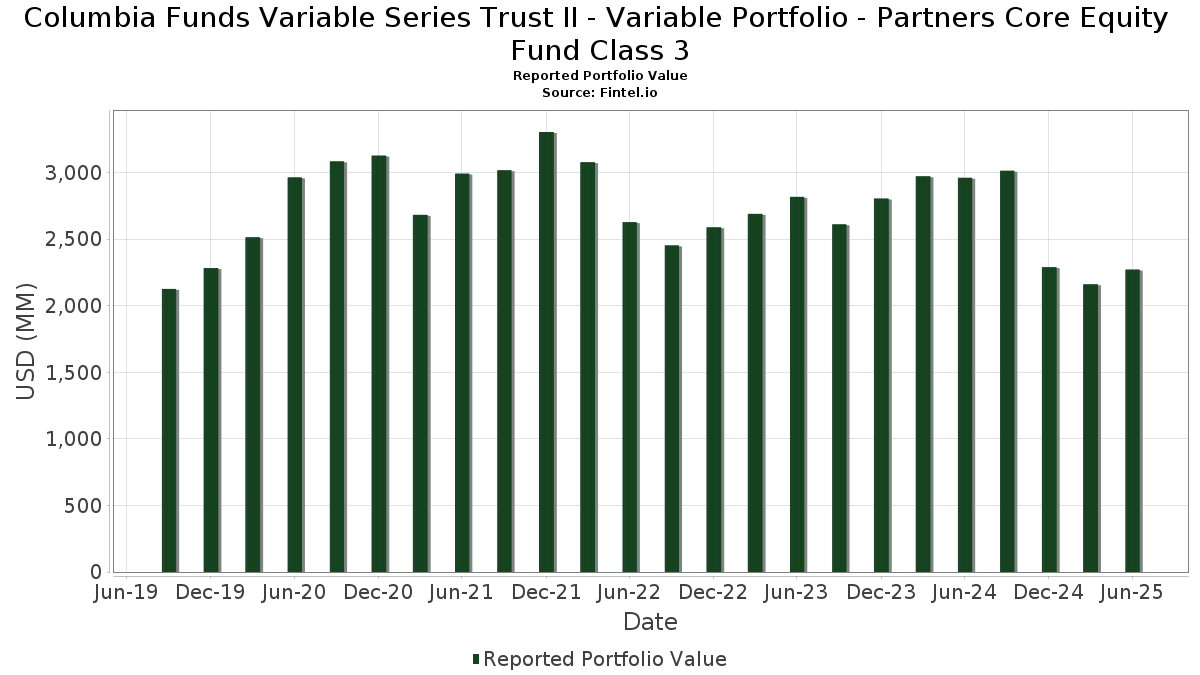
Columbia Funds Variable Series Trust II - Variable Portfolio - Partners Core Equity Fund Class 3 telah mengungkapkan total kepemilikan 117 dalam pengajuan SEC terbaru mereka. Nilai portofolio terbaru dihitung sebesar $ 2,270,497,319 USD. Aset yang Dikelola (AUM) sebenarnya adalah nilai ini ditambah kas (yang tidak diungkapkan). Aset-aset utama Columbia Funds Variable Series Trust II - Variable Portfolio - Partners Core Equity Fund Class 3 adalah Microsoft Corporation (US:MSFT) , NVIDIA Corporation (US:NVDA) , Amazon.com, Inc. (US:AMZN) , Apple Inc. (US:AAPL) , and Meta Platforms, Inc. (US:META) . Posisi baru Columbia Funds Variable Series Trust II - Variable Portfolio - Partners Core Equity Fund Class 3 meliputi: Teledyne Technologies Incorporated (DE:TYZ) , Abbott Laboratories (US:ABT) , United Rentals, Inc. (US:URI) , Tradeweb Markets Inc. (US:TW) , and Welltower Inc. (US:WELL) .
Peningkatan Tertinggi Kuartal Ini
Kami menggunakan perubahan dalam alokasi portofolio karena ini adalah metrik yang paling bermakna. Perubahan dapat disebabkan oleh perdagangan atau perubahan harga saham.
| Keamanan | Saham (MM) |
Nilai (Juta Dolar AS) |
Portfolio % | ΔPorsyento ng Portfolio |
|---|---|---|---|---|
| 0.38 | 188.75 | 8.3094 | 1.6735 | |
| 0.95 | 150.61 | 6.6301 | 1.6502 | |
| 0.10 | 71.83 | 3.1622 | 1.2243 | |
| 0.25 | 69.15 | 3.0443 | 0.7939 | |
| 0.14 | 17.06 | 0.7512 | 0.7512 | |
| 0.10 | 11.16 | 0.4912 | 0.4912 | |
| 0.02 | 9.57 | 0.4211 | 0.4211 | |
| 0.10 | 9.19 | 0.4045 | 0.4045 | |
| 0.07 | 19.83 | 0.8729 | 0.3839 | |
| 0.10 | 22.76 | 1.0017 | 0.3774 |
Penurunan Tertinggi Kuartal Ini
Kami menggunakan perubahan dalam alokasi portofolio karena ini adalah metrik yang paling bermakna. Perubahan dapat disebabkan oleh perdagangan atau perubahan harga saham.
| Keamanan | Saham (MM) |
Nilai (Juta Dolar AS) |
Portfolio % | ΔPorsyento ng Portfolio |
|---|---|---|---|---|
| 0.51 | 104.69 | 4.6086 | -2.0158 | |
| 0.04 | 12.53 | 0.5515 | -1.7448 | |
| 0.01 | 6.97 | 0.3070 | -0.7011 | |
| 0.08 | 23.56 | 1.0370 | -0.5166 | |
| 0.37 | 5.16 | 0.2271 | -0.4636 | |
| 0.02 | 2.77 | 0.1221 | -0.3081 | |
| 0.02 | 3.13 | 0.1377 | -0.3016 | |
| 0.03 | 22.38 | 0.9854 | -0.2809 | |
| 0.04 | 10.88 | 0.4789 | -0.2743 | |
| 0.06 | 10.28 | 0.4527 | -0.2640 |
Pengajuan 13F dan Dana
Formulir ini diajukan pada 2025-08-22 untuk periode pelaporan 2025-06-30. Klik ikon tautan untuk melihat riwayat transaksi selengkapnya.
Tingkatkan ke versi premium untuk membuka data premium dan ekspor ke Excel. ![]() .
.
| Keamanan | Ketik | Harga Saham Rata-rata | Saham (MM) |
ΔSaham (%) |
ΔSaham (%) |
Nilai ($MM) |
Portpolyo (%) |
ΔPortofolio (%) |
|
|---|---|---|---|---|---|---|---|---|---|
| MSFT / Microsoft Corporation | 0.38 | -0.67 | 188.75 | 31.62 | 8.3094 | 1.6735 | |||
| NVDA / NVIDIA Corporation | 0.95 | -4.00 | 150.61 | 39.94 | 6.6301 | 1.6502 | |||
| AMZN / Amazon.com, Inc. | 0.48 | -4.07 | 106.08 | 10.62 | 4.6697 | 0.2324 | |||
| AAPL / Apple Inc. | 0.51 | -20.83 | 104.69 | -26.87 | 4.6086 | -2.0158 | |||
| META / Meta Platforms, Inc. | 0.10 | 33.94 | 71.83 | 71.52 | 3.1622 | 1.2243 | |||
| AVGO / Broadcom Inc. | 0.25 | -13.63 | 69.15 | 42.19 | 3.0443 | 0.7939 | |||
| GOOG / Alphabet Inc. | 0.27 | 2.30 | 47.67 | 16.16 | 2.0987 | 0.1995 | |||
| AXP / American Express Company | 0.12 | -3.33 | 39.15 | 14.60 | 1.7235 | 0.1428 | |||
| WFC / Wells Fargo & Company | 0.48 | -0.77 | 38.43 | 10.74 | 1.6920 | 0.0860 | |||
| WMT / Walmart Inc. | 0.38 | 10.44 | 37.39 | 23.01 | 1.6460 | 0.2395 | |||
| LOW / Lowe's Companies, Inc. | 0.16 | 10.16 | 36.16 | 4.80 | 1.5918 | -0.0048 | |||
| V / Visa Inc. | 0.09 | -7.01 | 33.21 | -5.79 | 1.4618 | -0.1692 | |||
| MA / Mastercard Incorporated | 0.05 | -1.03 | 30.64 | 1.46 | 1.3489 | -0.0485 | |||
| GOOGL / Alphabet Inc. | 0.16 | 1.08 | 28.63 | 15.19 | 1.2604 | 0.1103 | |||
| SYK / Stryker Corporation | 0.07 | -4.91 | 28.38 | 1.06 | 1.2496 | -0.0501 | |||
| BKR / Baker Hughes Company | 0.72 | 3.85 | 27.74 | -9.41 | 1.2212 | -0.1957 | |||
| ETN / Eaton Corporation plc | 0.07 | -6.34 | 26.45 | 23.00 | 1.1644 | 0.1693 | |||
| DE / Deere & Company | 0.05 | -19.39 | 25.88 | -12.67 | 1.1393 | -0.2320 | |||
| NXPI / NXP Semiconductors N.V. | 0.11 | 7.01 | 24.44 | 23.02 | 1.0760 | 0.1566 | |||
| NFLX / Netflix, Inc. | 0.02 | -10.28 | 24.21 | 28.85 | 1.0660 | 0.1963 | |||
| JPM / JPMorgan Chase & Co. | 0.08 | -9.88 | 24.04 | 6.51 | 1.0584 | 0.0138 | |||
| MCD / McDonald's Corporation | 0.08 | -24.99 | 23.56 | -29.84 | 1.0370 | -0.5166 | |||
| CRM / Salesforce, Inc. | 0.08 | -10.38 | 22.78 | -8.94 | 1.0027 | -0.1547 | |||
| ORCL / Oracle Corporation | 0.10 | 7.85 | 22.76 | 68.66 | 1.0017 | 0.3774 | |||
| AJG / Arthur J. Gallagher & Co. | 0.07 | -5.71 | 22.41 | -12.57 | 0.9866 | -0.1995 | |||
| LLY / Eli Lilly and Company | 0.03 | -13.34 | 22.38 | -18.21 | 0.9854 | -0.2809 | |||
| VMC / Vulcan Materials Company | 0.08 | -4.82 | 20.80 | 6.41 | 0.9155 | 0.0111 | |||
| XOM / Exxon Mobil Corporation | 0.19 | -9.99 | 20.53 | -18.42 | 0.9037 | -0.2606 | |||
| MDLZ / Mondelez International, Inc. | 0.30 | -2.92 | 20.17 | -3.50 | 0.8879 | -0.0793 | |||
| TRV / The Travelers Companies, Inc. | 0.07 | 85.48 | 19.83 | 87.63 | 0.8729 | 0.3839 | |||
| NOC / Northrop Grumman Corporation | 0.04 | -3.85 | 18.63 | -6.11 | 0.8200 | -0.0980 | |||
| ABBV / AbbVie Inc. | 0.10 | -8.83 | 18.15 | -19.23 | 0.7992 | -0.2408 | |||
| HWM / Howmet Aerospace Inc. | 0.09 | -20.76 | 17.41 | 13.69 | 0.7662 | 0.0578 | |||
| DIS / The Walt Disney Company | 0.14 | 17.06 | 0.7512 | 0.7512 | |||||
| VRTX / Vertex Pharmaceuticals Incorporated | 0.04 | -7.15 | 16.83 | -14.74 | 0.7408 | -0.1724 | |||
| GE / General Electric Company | 0.06 | -2.55 | 16.68 | 25.32 | 0.7343 | 0.1184 | |||
| PG / The Procter & Gamble Company | 0.10 | 3.85 | 16.60 | -2.91 | 0.7306 | -0.0604 | |||
| LIN / Linde plc | 0.03 | 15.97 | 16.29 | 16.85 | 0.7171 | 0.0720 | |||
| SPGI / S&P Global Inc. | 0.03 | 7.85 | 15.67 | 11.92 | 0.6899 | 0.0420 | |||
| CARR / Carrier Global Corporation | 0.21 | 42.32 | 15.59 | 64.31 | 0.6862 | 0.2472 | |||
| INTU / Intuit Inc. | 0.02 | -12.68 | 15.31 | 12.02 | 0.6739 | 0.0415 | |||
| NEE / NextEra Energy, Inc. | 0.22 | 32.95 | 15.29 | 30.19 | 0.6733 | 0.1297 | |||
| MS / Morgan Stanley | 0.11 | 0.04 | 14.90 | 20.78 | 0.6559 | 0.0851 | |||
| TMUS / T-Mobile US, Inc. | 0.06 | 41.73 | 14.65 | 26.62 | 0.6447 | 0.1095 | |||
| PH / Parker-Hannifin Corporation | 0.02 | 10.96 | 14.57 | 27.51 | 0.6412 | 0.1126 | |||
| MDT / Medtronic plc | 0.17 | 9.16 | 14.46 | 5.90 | 0.6367 | 0.0047 | |||
| GS / The Goldman Sachs Group, Inc. | 0.02 | -5.61 | 14.34 | 22.28 | 0.6313 | 0.0886 | |||
| SO / The Southern Company | 0.15 | -3.51 | 14.19 | -3.64 | 0.6247 | -0.0567 | |||
| ACN / Accenture plc | 0.05 | 5.18 | 13.63 | 0.75 | 0.6001 | -0.0260 | |||
| MAR / Marriott International, Inc. | 0.05 | 3.86 | 13.62 | 19.12 | 0.5995 | 0.0705 | |||
| TEL / TE Connectivity plc | 0.08 | 1.41 | 12.96 | 21.04 | 0.5706 | 0.0751 | |||
| TSLA / Tesla, Inc. | 0.04 | -18.13 | 12.53 | 0.35 | 0.5516 | -0.0262 | |||
| UNH / UnitedHealth Group Incorporated | 0.04 | -57.62 | 12.53 | -74.76 | 0.5515 | -1.7448 | |||
| EXE / Expand Energy Corporation | 0.11 | -3.60 | 12.37 | 1.27 | 0.5444 | -0.0207 | |||
| ADI / Analog Devices, Inc. | 0.05 | -23.66 | 12.10 | -9.91 | 0.5325 | -0.0888 | |||
| CMG / Chipotle Mexican Grill, Inc. | 0.21 | -14.50 | 12.01 | -4.39 | 0.5288 | -0.0525 | |||
| PGR / The Progressive Corporation | 0.04 | -11.11 | 12.01 | -16.18 | 0.5286 | -0.1343 | |||
| ALL / The Allstate Corporation | 0.06 | -9.93 | 11.94 | -12.43 | 0.5256 | -0.1053 | |||
| COP / ConocoPhillips | 0.13 | 22.01 | 11.83 | 4.26 | 0.5210 | -0.0043 | |||
| NSC / Norfolk Southern Corporation | 0.05 | 14.61 | 11.68 | 23.86 | 0.5140 | 0.0778 | |||
| KO / The Coca-Cola Company | 0.16 | -17.72 | 11.64 | -18.72 | 0.5124 | -0.1502 | |||
| CSX / CSX Corporation | 0.35 | -15.13 | 11.53 | -5.90 | 0.5076 | -0.0594 | |||
| GILD / Gilead Sciences, Inc. | 0.10 | 11.16 | 0.4912 | 0.4912 | |||||
| EW / Edwards Lifesciences Corporation | 0.14 | 11.14 | 11.12 | 19.92 | 0.4897 | 0.0605 | |||
| TJX / The TJX Companies, Inc. | 0.09 | 0.00 | 10.98 | 1.38 | 0.4835 | -0.0178 | |||
| TSM / Taiwan Semiconductor Manufacturing Company Limited - Depositary Receipt (Common Stock) | 0.05 | 4.66 | 10.88 | 42.80 | 0.4790 | 0.1264 | |||
| COR / Cencora, Inc. | 0.04 | -38.02 | 10.88 | -33.17 | 0.4789 | -0.2743 | |||
| RJF / Raymond James Financial, Inc. | 0.07 | -3.41 | 10.85 | 6.64 | 0.4778 | 0.0069 | |||
| VLO / Valero Energy Corporation | 0.08 | -4.23 | 10.76 | -2.53 | 0.4738 | -0.0371 | |||
| 19766H239 / COLUMBIA SHORT TERM CASH FUND | 10.66 | -16.16 | 10.66 | -16.16 | 0.4691 | -0.1190 | |||
| MOH / Molina Healthcare, Inc. | 0.03 | -16.47 | 10.33 | -24.45 | 0.4547 | -0.1779 | |||
| DGX / Quest Diagnostics Incorporated | 0.06 | -37.46 | 10.28 | -33.61 | 0.4527 | -0.2640 | |||
| AME / AMETEK, Inc. | 0.06 | -17.51 | 10.24 | -13.28 | 0.4506 | -0.0956 | |||
| ATO / Atmos Energy Corporation | 0.07 | -1.90 | 10.07 | -2.20 | 0.4431 | -0.0331 | |||
| KEYS / Keysight Technologies, Inc. | 0.06 | -2.85 | 10.03 | 6.29 | 0.4414 | 0.0049 | |||
| CL / Colgate-Palmolive Company | 0.11 | -17.12 | 9.94 | -19.60 | 0.4377 | -0.1346 | |||
| RSG / Republic Services, Inc. | 0.04 | -5.00 | 9.88 | -3.25 | 0.4349 | -0.0376 | |||
| BKNG / Booking Holdings Inc. | 0.00 | -8.56 | 9.77 | 14.91 | 0.4302 | 0.0367 | |||
| ORLY / O'Reilly Automotive, Inc. | 0.11 | 1,163.79 | 9.73 | -20.49 | 0.4283 | -0.1379 | |||
| BR / Broadridge Financial Solutions, Inc. | 0.04 | -5.35 | 9.72 | -5.13 | 0.4281 | -0.0462 | |||
| IR / Ingersoll Rand Inc. | 0.12 | 7.04 | 9.65 | 11.25 | 0.4248 | 0.0234 | |||
| TYZ / Teledyne Technologies Incorporated | 0.02 | 9.57 | 0.4211 | 0.4211 | |||||
| SHW / The Sherwin-Williams Company | 0.03 | 8.87 | 9.54 | 7.05 | 0.4198 | 0.0076 | |||
| SLB / Schlumberger Limited | 0.28 | -3.81 | 9.49 | -22.22 | 0.4176 | -0.1467 | |||
| PKG / Packaging Corporation of America | 0.05 | 8.83 | 9.47 | 3.56 | 0.4171 | -0.0062 | |||
| FTI / TechnipFMC plc | 0.27 | -3.36 | 9.45 | 5.03 | 0.4162 | -0.0003 | |||
| ULTA / Ulta Beauty, Inc. | 0.02 | -14.74 | 9.41 | 8.82 | 0.4144 | 0.0141 | |||
| SCHW / The Charles Schwab Corporation | 0.10 | 9.19 | 0.4045 | 0.4045 | |||||
| IP / International Paper Company | 0.19 | -3.21 | 8.98 | -15.04 | 0.3954 | -0.0938 | |||
| TT / Trane Technologies plc | 0.02 | -46.31 | 8.78 | -30.30 | 0.3865 | -0.1964 | |||
| AEE / Ameren Corporation | 0.09 | 7.62 | 8.64 | 2.94 | 0.3803 | -0.0080 | |||
| USB / U.S. Bancorp | 0.19 | 0.16 | 8.59 | 7.35 | 0.3782 | 0.0079 | |||
| MU / Micron Technology, Inc. | 0.07 | 5.52 | 8.41 | 49.67 | 0.3704 | 0.1103 | |||
| FICO / Fair Isaac Corporation | 0.00 | 0.00 | 8.35 | -0.88 | 0.3677 | -0.0222 | |||
| HBAN / Huntington Bancshares Incorporated | 0.50 | 6.44 | 8.32 | 18.85 | 0.3662 | 0.0423 | |||
| ODFL / Old Dominion Freight Line, Inc. | 0.05 | 13.16 | 8.17 | 11.00 | 0.3598 | 0.0191 | |||
| MMC / Marsh & McLennan Companies, Inc. | 0.04 | 8.12 | 0.3577 | 0.3577 | |||||
| ABT / Abbott Laboratories | 0.06 | 7.97 | 0.3509 | 0.3509 | |||||
| MTD / Mettler-Toledo International Inc. | 0.01 | -19.08 | 7.87 | -19.50 | 0.3465 | -0.1060 | |||
| HCA / HCA Healthcare, Inc. | 0.02 | -31.15 | 7.83 | -23.66 | 0.3449 | -0.1300 | |||
| URI / United Rentals, Inc. | 0.01 | 7.81 | 0.3437 | 0.3437 | |||||
| EFX / Equifax Inc. | 0.03 | -22.68 | 7.44 | -17.66 | 0.3275 | -0.0906 | |||
| TW / Tradeweb Markets Inc. | 0.05 | 7.44 | 0.3275 | 0.3275 | |||||
| STLD / Steel Dynamics, Inc. | 0.06 | 9.41 | 7.18 | 11.99 | 0.3159 | 0.0194 | |||
| REGN / Regeneron Pharmaceuticals, Inc. | 0.01 | -61.33 | 6.97 | -67.99 | 0.3070 | -0.7011 | |||
| PLD / Prologis, Inc. | 0.06 | -4.11 | 6.82 | -9.83 | 0.3004 | -0.0498 | |||
| ETR / Entergy Corporation | 0.07 | -14.40 | 5.98 | -16.79 | 0.2632 | -0.0692 | |||
| BAH / Booz Allen Hamilton Holding Corporation | 0.06 | -14.30 | 5.92 | -14.66 | 0.2608 | -0.0605 | |||
| WELL / Welltower Inc. | 0.04 | 5.52 | 0.2429 | 0.2429 | |||||
| PCG / PG&E Corporation | 0.37 | -57.41 | 5.16 | -65.44 | 0.2271 | -0.4636 | |||
| XYL / Xylem Inc. | 0.04 | -48.15 | 4.67 | -43.86 | 0.2058 | -0.1795 | |||
| ASML / ASML Holding N.V. - Depositary Receipt (Common Stock) | 0.01 | 24.91 | 4.59 | 51.05 | 0.2020 | 0.0615 | |||
| BX / Blackstone Inc. | 0.03 | 4.15 | 0.1828 | 0.1828 | |||||
| PNR / Pentair plc | 0.04 | 4.11 | 0.1809 | 0.1809 | |||||
| AVB / AvalonBay Communities, Inc. | 0.02 | -65.25 | 3.13 | -67.06 | 0.1377 | -0.3016 | |||
| ROST / Ross Stores, Inc. | 0.02 | -70.12 | 2.77 | -70.18 | 0.1221 | -0.3081 | |||
| S&P500 EMINI SEP 25 / DE (000000000) | 0.01 | 0.0004 | 0.0004 |