Mga Batayang Estadistika
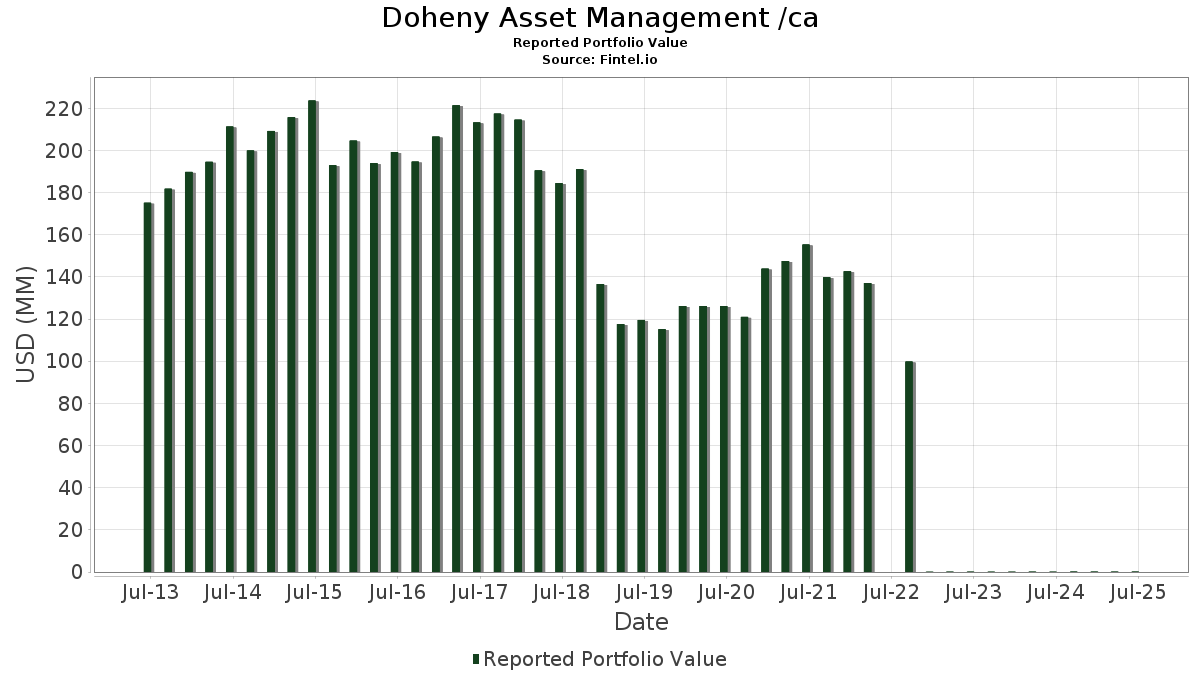
| Nilai Portofolio | $ 142,730 |
| Posisi Saat Ini | 66 |
Kepemilikan Terbaru, Kinerja, AUM (dari 13F, 13D)
Doheny Asset Management /ca telah mengungkapkan total kepemilikan 66 dalam pengajuan SEC terbaru mereka. Nilai portofolio terbaru dihitung sebesar $ 142,730 USD. Aset yang Dikelola (AUM) sebenarnya adalah nilai ini ditambah kas (yang tidak diungkapkan). Aset-aset utama Doheny Asset Management /ca adalah Direxion Shares ETF Trust - Direxion Daily NVDA Bear 1X Shares (US:NVDD) , Apple Inc. (US:AAPL) , Broadcom Inc. (US:AVGO) , Vistra Corp. (US:VST) , and Exxon Mobil Corporation (US:XOM) . Posisi baru Doheny Asset Management /ca meliputi: Agnico Eagle Mines Limited (US:AEM) , Capital One Financial Corporation (US:COF) , .
Peningkatan Tertinggi Kuartal Ini
Kami menggunakan perubahan dalam alokasi portofolio karena ini adalah metrik yang paling bermakna. Perubahan dapat disebabkan oleh perdagangan atau perubahan harga saham.
| Keamanan | Saham (MM) |
Nilai (Juta Dolar AS) |
Portfolio % | ΔPorsyento ng Portfolio |
|---|---|---|---|---|
| 0.04 | 0.01 | 8.4937 | 2.7283 | |
| 0.10 | 0.02 | 11.1742 | 2.5243 | |
| 0.04 | 0.01 | 5.6078 | 1.8000 | |
| 0.01 | 0.00 | 1.5119 | 1.3091 | |
| 0.01 | 0.00 | 1.0944 | 1.0944 | |
| 0.01 | 0.00 | 2.1958 | 0.3525 | |
| 0.02 | 0.00 | 2.5587 | 0.2684 | |
| 0.22 | 0.00 | 0.9514 | 0.2679 | |
| 0.03 | 0.01 | 4.1995 | 0.2492 | |
| 0.03 | 0.00 | 1.2450 | 0.2153 |
Penurunan Tertinggi Kuartal Ini
Kami menggunakan perubahan dalam alokasi portofolio karena ini adalah metrik yang paling bermakna. Perubahan dapat disebabkan oleh perdagangan atau perubahan harga saham.
| Keamanan | Saham (MM) |
Nilai (Juta Dolar AS) |
Portfolio % | ΔPorsyento ng Portfolio |
|---|---|---|---|---|
| 0.07 | 0.01 | 9.6798 | -2.0583 | |
| 0.11 | 0.00 | 0.6600 | -1.1699 | |
| 0.06 | 0.01 | 4.2079 | -1.0132 | |
| 0.06 | 0.00 | 0.5899 | -0.8211 | |
| 0.02 | 0.00 | 2.2539 | -0.5900 | |
| 0.02 | 0.00 | 2.1075 | -0.4913 | |
| 0.02 | 0.00 | 1.7249 | -0.4894 | |
| 0.00 | 0.00 | 2.1740 | -0.3778 | |
| 0.00 | 0.00 | 1.5540 | -0.3495 | |
| 0.02 | 0.00 | 1.7172 | -0.3256 |
Pengajuan 13F dan Dana
Formulir ini diajukan pada 2025-08-14 untuk periode pelaporan 2025-06-30. Klik ikon tautan untuk melihat riwayat transaksi selengkapnya.
Tingkatkan ke versi premium untuk membuka data premium dan ekspor ke Excel. ![]() .
.
| Keamanan | Ketik | Harga Saham Rata-rata | Saham (MM) |
ΔSaham (%) |
ΔSaham (%) |
Nilai ($MM) |
Portpolyo (%) |
ΔPortofolio (%) |
|
|---|---|---|---|---|---|---|---|---|---|
| NVDD / Direxion Shares ETF Trust - Direxion Daily NVDA Bear 1X Shares | 0.10 | -0.96 | 0.02 | 36.36 | 11.1742 | 2.5243 | |||
| AAPL / Apple Inc. | 0.07 | -0.22 | 0.01 | -7.14 | 9.6798 | -2.0583 | |||
| AVGO / Broadcom Inc. | 0.04 | 0.00 | 0.01 | 71.43 | 8.4937 | 2.7283 | |||
| VST / Vistra Corp. | 0.04 | -0.28 | 0.01 | 100.00 | 5.6078 | 1.8000 | |||
| XOM / Exxon Mobil Corporation | 0.06 | -0.63 | 0.01 | 0.00 | 4.2079 | -1.0132 | |||
| GOOG / Alphabet Inc. | 0.03 | 4.63 | 0.01 | 0.00 | 4.1995 | 0.2492 | |||
| COST / Costco Wholesale Corporation | 0.00 | 0.00 | 0.00 | 0.00 | 2.9335 | -0.1993 | |||
| AMZN / Amazon.com, Inc. | 0.02 | 0.25 | 0.00 | 0.00 | 2.7394 | 0.0913 | |||
| PM / Philip Morris International Inc. | 0.02 | 8.82 | 0.00 | 50.00 | 2.5587 | 0.2684 | |||
| GOOGL / Alphabet Inc. | 0.02 | 0.00 | 0.00 | 0.00 | 2.4627 | 0.0479 | |||
| ABBV / AbbVie Inc. | 0.02 | 0.00 | 0.00 | 0.00 | 2.2539 | -0.5900 | |||
| AXP / American Express Company | 0.01 | 0.00 | 0.00 | 50.00 | 2.2035 | 0.1261 | |||
| MSFT / Microsoft Corporation | 0.01 | 0.48 | 0.00 | 50.00 | 2.1958 | 0.3525 | |||
| LLY / Eli Lilly and Company | 0.00 | 0.89 | 0.00 | 0.00 | 2.1740 | -0.3778 | |||
| FANG / Diamondback Energy, Inc. | 0.02 | 5.44 | 0.00 | 0.00 | 2.1075 | -0.4913 | |||
| EBGEF / Enbridge Inc. - Preferred Stock | 0.07 | 0.00 | 0.00 | 0.00 | 2.0752 | -0.1924 | |||
| QCOM / QUALCOMM Incorporated | 0.02 | 0.00 | 0.00 | 0.00 | 1.8167 | -0.1416 | |||
| UPS / United Parcel Service, Inc. | 0.02 | -5.11 | 0.00 | 0.00 | 1.7249 | -0.4894 | |||
| EOG / EOG Resources, Inc. | 0.02 | 0.74 | 0.00 | 0.00 | 1.7172 | -0.3256 | |||
| BRK.B / Berkshire Hathaway Inc. | 0.00 | 0.00 | 0.00 | 0.00 | 1.5540 | -0.3495 | |||
| ETN / Eaton Corporation plc | 0.01 | 533.54 | 0.00 | 1.5119 | 1.3091 | ||||
| STAG / STAG Industrial, Inc. | 0.06 | -1.66 | 0.00 | 0.00 | 1.5077 | -0.1984 | |||
| ENVX / Enovix Corporation | 0.19 | -11.01 | 0.00 | 0.00 | 1.3529 | 0.1471 | |||
| MCHP / Microchip Technology Incorporated | 0.03 | -7.00 | 0.00 | 0.00 | 1.2450 | 0.2153 | |||
| GLD / SPDR Gold Trust | 0.01 | 0.00 | 0.00 | 0.00 | 1.2107 | -0.0688 | |||
| AEM / Agnico Eagle Mines Limited | 0.01 | 0.00 | 1.0944 | 1.0944 | |||||
| CVX / Chevron Corporation | 0.01 | 0.00 | 0.00 | 0.00 | 1.0047 | -0.3069 | |||
| TMUS / T-Mobile US, Inc. | 0.01 | 0.00 | 0.00 | 0.00 | 0.9697 | -0.2440 | |||
| TXN / Texas Instruments Incorporated | 0.01 | 0.00 | 0.00 | 0.00 | 0.9627 | 0.0317 | |||
| FIP / FTAI Infrastructure Inc. | 0.22 | 14.27 | 0.00 | 0.9514 | 0.2679 | ||||
| SPY / SPDR S&P 500 ETF | 0.00 | 0.00 | 0.00 | 0.00 | 0.8660 | -0.0102 | |||
| JPM / JPMorgan Chase & Co. | 0.00 | 0.00 | 0.00 | 0.8176 | 0.0448 | ||||
| JNJ / Johnson & Johnson | 0.01 | 0.00 | 0.00 | 0.00 | 0.7595 | -0.1613 | |||
| CRWD / CrowdStrike Holdings, Inc. | 0.00 | 0.00 | 0.00 | 0.7139 | 0.1619 | ||||
| AMD / Advanced Micro Devices, Inc. | 0.01 | 0.00 | 0.00 | 0.6768 | 0.1295 | ||||
| MRK / Merck & Co., Inc. | 0.01 | 0.00 | 0.00 | -100.00 | 0.6733 | -0.1802 | |||
| META / Meta Platforms, Inc. | 0.00 | 0.00 | 0.00 | 0.6705 | 0.0848 | ||||
| SFL / SFL Corporation Ltd. | 0.11 | -60.33 | 0.00 | -100.00 | 0.6600 | -1.1699 | |||
| PEP / PepsiCo, Inc. | 0.01 | 0.00 | 0.00 | 0.5990 | -0.1613 | ||||
| RXST / RxSight, Inc. | 0.06 | -9.24 | 0.00 | -100.00 | 0.5899 | -0.8211 | |||
| IBM / International Business Machines Corporation | 0.00 | 0.00 | 0.00 | 0.5507 | 0.0316 | ||||
| MGY / Magnolia Oil & Gas Corporation | 0.03 | 0.00 | 0.00 | 0.5395 | -0.1378 | ||||
| EFX / Equifax Inc. | 0.00 | 0.00 | 0.00 | 0.4540 | -0.0229 | ||||
| AROC / Archrock, Inc. | 0.03 | 0.00 | 0.00 | 0.4505 | -0.0819 | ||||
| PSX / Phillips 66 | 0.01 | -5.45 | 0.00 | 0.4498 | -0.0999 | ||||
| GD / General Dynamics Corporation | 0.00 | 0.00 | 0.00 | 0.4064 | -0.0180 | ||||
| DUK / Duke Energy Corporation | 0.00 | 0.00 | 0.00 | 0.3762 | -0.0583 | ||||
| TSLA / Tesla, Inc. | 0.00 | -15.85 | 0.00 | 0.3545 | -0.0299 | ||||
| CCJ / Cameco Corporation | 0.01 | 0.00 | 0.00 | 0.3314 | 0.1262 | ||||
| HON / Honeywell International Inc. | 0.00 | 0.00 | 0.00 | 0.3244 | -0.0053 | ||||
| RTX / RTX Corporation | 0.00 | -2.27 | 0.00 | 0.2957 | -0.0105 | ||||
| KO / The Coca-Cola Company | 0.01 | 0.00 | 0.00 | 0.2852 | -0.0374 | ||||
| MS / Morgan Stanley | 0.00 | 0.00 | 0.00 | 0.2487 | 0.0185 | ||||
| AMGN / Amgen Inc. | 0.00 | -28.77 | 0.00 | 0.2445 | -0.1838 | ||||
| LXP / LXP Industrial Trust | 0.03 | -22.30 | 0.00 | 0.2018 | -0.1020 | ||||
| COF / Capital One Financial Corporation | 0.00 | 0.00 | 0.2011 | 0.2011 | |||||
| NKE / NIKE, Inc. | 0.00 | 0.00 | 0.00 | 0.1983 | 0.0002 | ||||
| MA / Mastercard Incorporated | 0.00 | 0.00 | 0.00 | 0.1969 | -0.0177 | ||||
| CAT / Caterpillar Inc. | 0.00 | -4.71 | 0.00 | 0.1703 | 0.0003 | ||||
| ABT / Abbott Laboratories | 0.00 | 0.00 | 0.00 | 0.1632 | -0.0145 | ||||
| V / Visa Inc. | 0.00 | 0.00 | 0.00 | 0.1597 | -0.0164 | ||||
| BX / Blackstone Inc. | 0.00 | 0.00 | 0.00 | 0.1520 | -0.0069 | ||||
| MDLZ / Mondelez International, Inc. | 0.00 | 0.00 | 0.00 | 0.1485 | -0.0190 | ||||
| LIN / Linde plc | 0.00 | 0.00 | 0.00 | 0.1478 | -0.0166 | ||||
| EQR / Equity Residential | 0.00 | 0.00 | 0.00 | 0.1415 | -0.0268 | ||||
| THW / Abrdn World Healthcare Fund | 0.01 | 0.00 | 0.00 | 0.0897 | -0.0231 | ||||
| DFS / Discover Financial Services | 0.00 | -100.00 | 0.00 | 0.0000 | |||||
| CRM / Salesforce, Inc. | 0.00 | -100.00 | 0.00 | 0.0000 |