Mga Batayang Estadistika
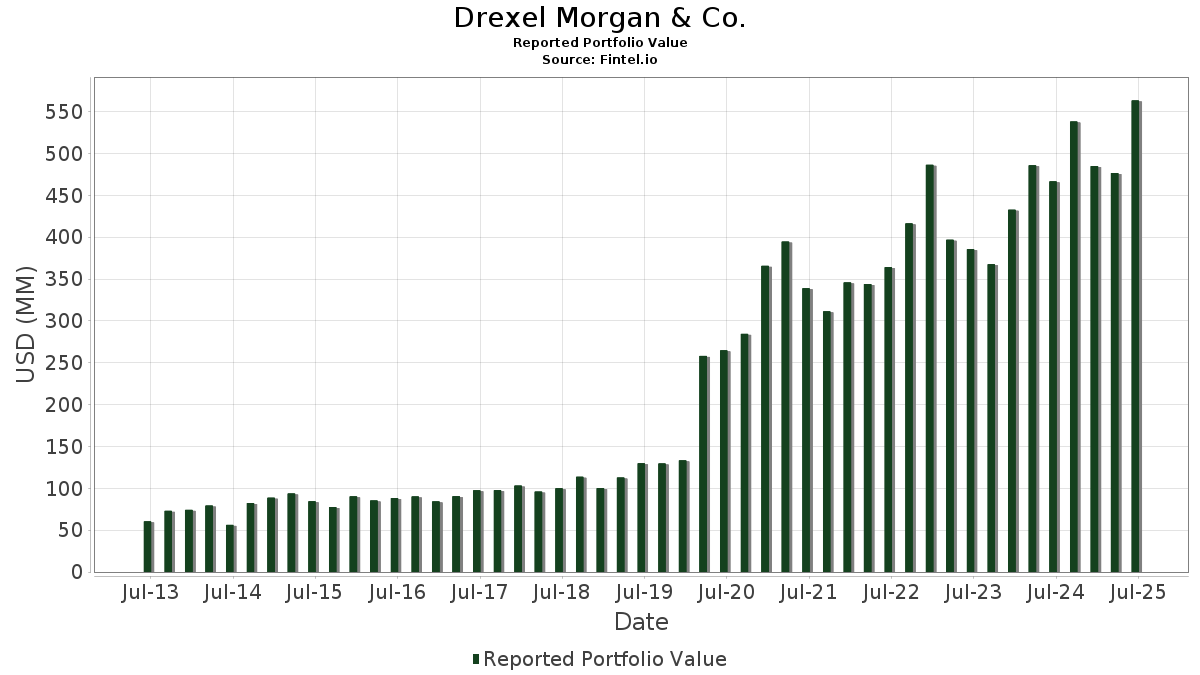
| Nilai Portofolio | $ 563,159,289 |
| Posisi Saat Ini | 56 |
Kepemilikan Terbaru, Kinerja, AUM (dari 13F, 13D)
Drexel Morgan & Co. telah mengungkapkan total kepemilikan 56 dalam pengajuan SEC terbaru mereka. Nilai portofolio terbaru dihitung sebesar $ 563,159,289 USD. Aset yang Dikelola (AUM) sebenarnya adalah nilai ini ditambah kas (yang tidak diungkapkan). Aset-aset utama Drexel Morgan & Co. adalah AT&T Inc. (US:T) , JPMorgan Chase & Co. (US:JPM) , Cleveland-Cliffs Inc. (US:CLF) , International Business Machines Corporation (US:IBM) , and Johnson & Johnson (US:JNJ) .
Peningkatan Tertinggi Kuartal Ini
Kami menggunakan perubahan dalam alokasi portofolio karena ini adalah metrik yang paling bermakna. Perubahan dapat disebabkan oleh perdagangan atau perubahan harga saham.
| Keamanan | Saham (MM) |
Nilai (Juta Dolar AS) |
Portfolio % | ΔPorsyento ng Portfolio |
|---|---|---|---|---|
| 0.10 | 30.60 | 5.4329 | 2.8401 | |
| 0.16 | 47.43 | 8.4214 | 2.5738 | |
| 0.12 | 14.47 | 2.5694 | 2.2238 | |
| 0.13 | 10.47 | 1.8596 | 1.3078 | |
| 0.31 | 31.27 | 5.5522 | 0.7101 | |
| 0.03 | 14.99 | 2.6611 | 0.2875 | |
| 0.24 | 6.70 | 1.1897 | 0.1087 | |
| 0.00 | 0.28 | 0.0505 | 0.0505 | |
| 0.01 | 0.22 | 0.0384 | 0.0384 | |
| 0.14 | 41.19 | 7.3143 | 0.0220 |
Penurunan Tertinggi Kuartal Ini
Kami menggunakan perubahan dalam alokasi portofolio karena ini adalah metrik yang paling bermakna. Perubahan dapat disebabkan oleh perdagangan atau perubahan harga saham.
| Keamanan | Saham (MM) |
Nilai (Juta Dolar AS) |
Portfolio % | ΔPorsyento ng Portfolio |
|---|---|---|---|---|
| 4.12 | 119.33 | 21.1892 | -3.2832 | |
| 0.22 | 33.03 | 5.8657 | -1.6611 | |
| 0.46 | 32.29 | 5.7339 | -1.1263 | |
| 0.35 | 11.67 | 2.0731 | -0.9307 | |
| 0.04 | 9.09 | 1.6138 | -0.4512 | |
| 0.07 | 7.40 | 1.3147 | -0.3996 | |
| 2.10 | 22.79 | 4.0459 | -0.3746 | |
| 0.03 | 14.27 | 2.5341 | -0.2304 | |
| 0.03 | 4.71 | 0.8371 | -0.2212 | |
| 0.01 | 3.68 | 0.6526 | -0.1720 |
Pengajuan 13F dan Dana
Formulir ini diajukan pada 2025-08-12 untuk periode pelaporan 2025-06-30. Klik ikon tautan untuk melihat riwayat transaksi selengkapnya.
Tingkatkan ke versi premium untuk membuka data premium dan ekspor ke Excel. ![]() .
.
| Keamanan | Ketik | Harga Saham Rata-rata | Saham (MM) |
ΔSaham (%) |
ΔSaham (%) |
Nilai ($MM) |
Portpolyo (%) |
ΔPortofolio (%) |
|
|---|---|---|---|---|---|---|---|---|---|
| T / AT&T Inc. | 4.12 | 0.00 | 119.33 | 2.33 | 21.1892 | -3.2832 | |||
| JPM / JPMorgan Chase & Co. | 0.16 | 44.02 | 47.43 | 70.21 | 8.4214 | 2.5738 | |||
| CLF / Cleveland-Cliffs Inc. | 5.50 | 25.29 | 41.79 | 15.84 | 7.4212 | -0.1506 | |||
| IBM / International Business Machines Corporation | 0.14 | 0.00 | 41.19 | 18.55 | 7.3143 | 0.0220 | |||
| JNJ / Johnson & Johnson | 0.22 | 0.00 | 33.03 | -7.89 | 5.8657 | -1.6611 | |||
| KO / The Coca-Cola Company | 0.46 | 0.00 | 32.29 | -1.21 | 5.7339 | -1.1263 | |||
| UPS / United Parcel Service, Inc. | 0.31 | 47.67 | 31.27 | 35.52 | 5.5522 | 0.7101 | |||
| AXP / American Express Company | 0.10 | 108.89 | 30.60 | 147.65 | 5.4329 | 2.8401 | |||
| F / Ford Motor Company | 2.10 | 0.00 | 22.79 | 8.18 | 4.0459 | -0.3746 | |||
| MSFT / Microsoft Corporation | 0.03 | 0.00 | 14.99 | 32.50 | 2.6611 | 0.2875 | |||
| DIS / The Walt Disney Company | 0.12 | 599.41 | 14.47 | 779.04 | 2.5694 | 2.2238 | |||
| DE / Deere & Company | 0.03 | 0.00 | 14.27 | 8.34 | 2.5341 | -0.2304 | |||
| SLB / Schlumberger Limited | 0.35 | 0.88 | 11.67 | -18.43 | 2.0731 | -0.9307 | |||
| CAT / Caterpillar Inc. | 0.03 | 0.00 | 10.83 | 17.71 | 1.9223 | -0.0078 | |||
| MRK / Merck & Co., Inc. | 0.13 | 351.63 | 10.47 | 298.33 | 1.8596 | 1.3078 | |||
| AAPL / Apple Inc. | 0.04 | 0.00 | 9.09 | -7.63 | 1.6138 | -0.4512 | |||
| XOM / Exxon Mobil Corporation | 0.07 | 0.00 | 7.40 | -9.37 | 1.3147 | -0.3996 | |||
| SPY / SPDR S&P 500 ETF | 0.01 | 4.55 | 6.74 | 15.49 | 1.1971 | -0.0281 | |||
| WASH / Washington Trust Bancorp, Inc. | 0.24 | 41.94 | 6.70 | 30.07 | 1.1897 | 0.1087 | |||
| PG / The Procter & Gamble Company | 0.03 | 0.00 | 4.71 | -6.51 | 0.8371 | -0.2212 | |||
| ABT / Abbott Laboratories | 0.03 | 0.00 | 4.65 | 2.51 | 0.8255 | -0.1261 | |||
| UNP / Union Pacific Corporation | 0.02 | 0.00 | 4.46 | -2.60 | 0.7915 | -0.1690 | |||
| EMR / Emerson Electric Co. | 0.03 | 0.00 | 3.99 | 21.63 | 0.7080 | 0.0199 | |||
| QQQ / Invesco QQQ Trust, Series 1 | 0.01 | 0.00 | 3.81 | 17.65 | 0.6759 | -0.0032 | |||
| MCD / McDonald's Corporation | 0.01 | 0.00 | 3.68 | -6.46 | 0.6526 | -0.1720 | |||
| MMM / 3M Company | 0.02 | 0.00 | 3.52 | 3.68 | 0.6251 | -0.0876 | |||
| RTX / RTX Corporation | 0.02 | 5.47 | 2.82 | 16.27 | 0.5002 | -0.0083 | |||
| RSP / Invesco Exchange-Traded Fund Trust - Invesco S&P 500 Equal Weight ETF | 0.02 | 0.00 | 2.77 | 4.93 | 0.4910 | -0.0621 | |||
| SHEL / Shell plc - Depositary Receipt (Common Stock) | 0.04 | 0.00 | 2.71 | -3.93 | 0.4819 | -0.1109 | |||
| CL / Colgate-Palmolive Company | 0.03 | 0.00 | 2.62 | -3.00 | 0.4652 | -0.1016 | |||
| UL / Unilever PLC - Depositary Receipt (Common Stock) | 0.03 | 0.00 | 1.92 | 2.73 | 0.3408 | -0.0513 | |||
| MDT / Medtronic plc | 0.02 | 0.00 | 1.88 | -3.00 | 0.3335 | -0.0728 | |||
| LLY / Eli Lilly and Company | 0.00 | 0.00 | 1.66 | -5.62 | 0.2954 | -0.0745 | |||
| NVS / Novartis AG - Depositary Receipt (Common Stock) | 0.01 | 10.29 | 1.30 | 19.76 | 0.2303 | 0.0029 | |||
| HD / The Home Depot, Inc. | 0.00 | 0.00 | 1.21 | 0.00 | 0.2148 | -0.0390 | |||
| DD / DuPont de Nemours, Inc. | 0.02 | 0.00 | 1.10 | -8.12 | 0.1950 | -0.0559 | |||
| DIA / SPDR Dow Jones Industrial Average ETF Trust | 0.00 | 0.00 | 0.88 | 5.01 | 0.1565 | -0.0197 | |||
| CARR / Carrier Global Corporation | 0.01 | 0.00 | 0.63 | 15.47 | 0.1115 | -0.0027 | |||
| IWM / iShares Trust - iShares Russell 2000 ETF | 0.00 | 0.00 | 0.62 | 8.23 | 0.1098 | -0.0102 | |||
| WFC / Wells Fargo & Company | 0.01 | 0.00 | 0.54 | 11.57 | 0.0960 | -0.0057 | |||
| XLF / The Select Sector SPDR Trust - The Financial Select Sector SPDR Fund | 0.01 | 0.00 | 0.52 | 5.02 | 0.0930 | -0.0115 | |||
| CVX / Chevron Corporation | 0.00 | 0.00 | 0.50 | -14.36 | 0.0890 | -0.0339 | |||
| IJH / iShares Trust - iShares Core S&P Mid-Cap ETF | 0.01 | 0.00 | 0.48 | 6.19 | 0.0854 | -0.0096 | |||
| HWM / Howmet Aerospace Inc. | 0.00 | 0.00 | 0.47 | 43.52 | 0.0826 | 0.0146 | |||
| OTIS / Otis Worldwide Corporation | 0.00 | 0.00 | 0.42 | -4.07 | 0.0754 | -0.0175 | |||
| PEP / PepsiCo, Inc. | 0.00 | 0.00 | 0.37 | -11.93 | 0.0656 | -0.0225 | |||
| ABBV / AbbVie Inc. | 0.00 | 0.00 | 0.35 | -11.56 | 0.0626 | -0.0209 | |||
| AMZN / Amazon.com, Inc. | 0.00 | 0.00 | 0.31 | 15.41 | 0.0545 | -0.0014 | |||
| NVDA / NVIDIA Corporation | 0.00 | 0.28 | 0.0505 | 0.0505 | |||||
| GOOGL / Alphabet Inc. | 0.00 | 0.00 | 0.27 | 13.62 | 0.0476 | -0.0018 | |||
| CSCO / Cisco Systems, Inc. | 0.00 | 0.00 | 0.25 | 12.44 | 0.0450 | -0.0023 | |||
| BRK.B / Berkshire Hathaway Inc. | 0.00 | 0.00 | 0.24 | -9.02 | 0.0431 | -0.0128 | |||
| LOW / Lowe's Companies, Inc. | 0.00 | 0.00 | 0.24 | -4.78 | 0.0425 | -0.0103 | |||
| VZ / Verizon Communications Inc. | 0.01 | 0.22 | 0.0384 | 0.0384 | |||||
| ADP / Automatic Data Processing, Inc. | 0.00 | 0.00 | 0.22 | 0.94 | 0.0383 | -0.0066 | |||
| AMGN / Amgen Inc. | 0.00 | 0.00 | 0.21 | -10.30 | 0.0372 | -0.0119 |