Mga Batayang Estadistika
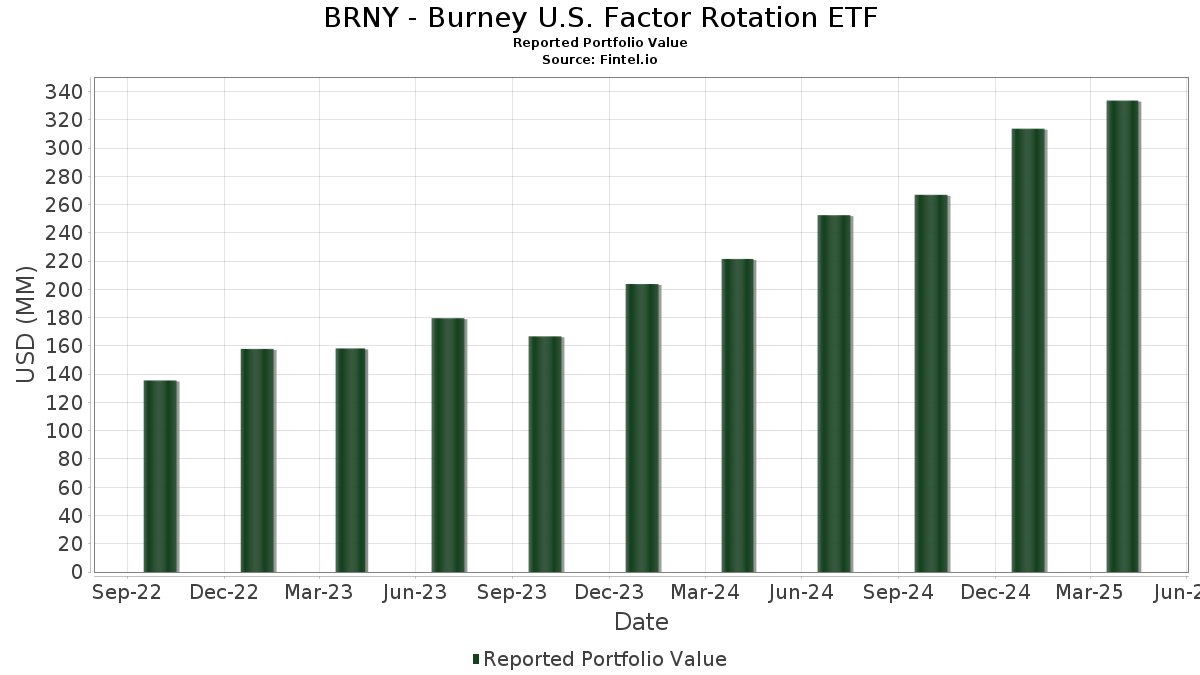
| Nilai Portofolio | $ 333,631,512 |
| Posisi Saat Ini | 81 |
Kepemilikan Terbaru, Kinerja, AUM (dari 13F, 13D)
BRNY - Burney U.S. Factor Rotation ETF telah mengungkapkan total kepemilikan 81 dalam pengajuan SEC terbaru mereka. Nilai portofolio terbaru dihitung sebesar $ 333,631,512 USD. Aset yang Dikelola (AUM) sebenarnya adalah nilai ini ditambah kas (yang tidak diungkapkan). Aset-aset utama BRNY - Burney U.S. Factor Rotation ETF adalah NVIDIA Corporation (US:NVDA) , Howmet Aerospace Inc. (US:HWM) , Autodesk, Inc. (US:ADSK) , QUALCOMM Incorporated (US:QCOM) , and Federated Hermes, Inc. (US:FHI) . Posisi baru BRNY - Burney U.S. Factor Rotation ETF meliputi: Autodesk, Inc. (US:ADSK) , Federated Hermes, Inc. (US:FHI) , Foothills Exploration, Inc. (US:FTXP) , Centene Corporation (US:CNC) , and Fox Corporation (US:FOXA) .
Peningkatan Tertinggi Kuartal Ini
Kami menggunakan perubahan dalam alokasi portofolio karena ini adalah metrik yang paling bermakna. Perubahan dapat disebabkan oleh perdagangan atau perubahan harga saham.
| Keamanan | Saham (MM) |
Nilai (Juta Dolar AS) |
Portfolio % | ΔPorsyento ng Portfolio |
|---|---|---|---|---|
| 0.06 | 15.67 | 4.6900 | 4.6900 | |
| 0.12 | 16.22 | 4.8600 | 4.6300 | |
| 0.35 | 14.12 | 4.2300 | 4.2300 | |
| 0.02 | 12.85 | 3.8500 | 3.8500 | |
| 0.21 | 12.28 | 3.6800 | 3.6800 | |
| 0.20 | 10.07 | 3.0200 | 3.0200 | |
| 0.02 | 8.26 | 2.4800 | 1.9400 | |
| 0.04 | 5.51 | 1.6500 | 1.6500 | |
| 0.17 | 12.90 | 3.8700 | 1.4400 | |
| 0.08 | 6.24 | 1.8700 | 1.3400 |
Penurunan Tertinggi Kuartal Ini
Kami menggunakan perubahan dalam alokasi portofolio karena ini adalah metrik yang paling bermakna. Perubahan dapat disebabkan oleh perdagangan atau perubahan harga saham.
| Keamanan | Saham (MM) |
Nilai (Juta Dolar AS) |
Portfolio % | ΔPorsyento ng Portfolio |
|---|---|---|---|---|
| 0.00 | 0.00 | -4.4000 | ||
| 0.00 | 1.13 | 0.3400 | -4.2200 | |
| 0.00 | 0.00 | -3.9400 | ||
| 0.04 | 6.65 | 1.9900 | -3.1600 | |
| 0.01 | 6.41 | 1.9200 | -3.1300 | |
| 0.05 | 2.45 | 0.7300 | -2.8800 | |
| 0.11 | 10.97 | 3.2900 | -2.7200 | |
| 0.16 | 7.91 | 2.3700 | -2.1700 | |
| 0.02 | 0.81 | 0.2400 | -2.0700 | |
| 0.00 | 0.00 | -1.9400 |
Pengajuan 13F dan Dana
Formulir ini diajukan pada 2025-06-27 untuk periode pelaporan 2025-04-30. Klik ikon tautan untuk melihat riwayat transaksi selengkapnya.
Tingkatkan ke versi premium untuk membuka data premium dan ekspor ke Excel. ![]() .
.
| Keamanan | Ketik | Harga Saham Rata-rata | Saham (MM) |
ΔSaham (%) |
ΔSaham (%) |
Nilai ($MM) |
Portpolyo (%) |
ΔPortofolio (%) |
|
|---|---|---|---|---|---|---|---|---|---|
| NVDA / NVIDIA Corporation | 0.16 | 13.60 | 17.55 | 3.05 | 5.2600 | -0.1600 | |||
| HWM / Howmet Aerospace Inc. | 0.12 | 1,926.16 | 16.22 | 2,118.60 | 4.8600 | 4.6300 | |||
| ADSK / Autodesk, Inc. | 0.06 | 15.67 | 4.6900 | 4.6900 | |||||
| QCOM / QUALCOMM Incorporated | 0.10 | 13.52 | 15.55 | -2.54 | 4.6600 | -0.4200 | |||
| FHI / Federated Hermes, Inc. | 0.35 | 14.12 | 4.2300 | 4.2300 | |||||
| APH / Amphenol Corporation | 0.17 | 55.40 | 12.90 | 68.95 | 3.8700 | 1.4400 | |||
| FTXP / Foothills Exploration, Inc. | 0.02 | 12.85 | 3.8500 | 3.8500 | |||||
| CNC / Centene Corporation | 0.21 | 12.28 | 3.6800 | 3.6800 | |||||
| JPM / JPMorgan Chase & Co. | 0.05 | -16.15 | 12.04 | -23.26 | 3.6100 | -1.3900 | |||
| EXEL / Exelixis, Inc. | 0.30 | 13.60 | 11.65 | 34.16 | 3.4900 | 0.7200 | |||
| FTNT / Fortinet, Inc. | 0.11 | -43.53 | 10.97 | -41.92 | 3.2900 | -2.7200 | |||
| FOXA / Fox Corporation | 0.20 | 10.07 | 3.0200 | 3.0200 | |||||
| MCO / Moody's Corporation | 0.02 | 441.67 | 8.26 | 391.61 | 2.4800 | 1.9400 | |||
| G / Genpact Limited | 0.16 | -46.30 | 7.91 | -44.57 | 2.3700 | -2.1700 | |||
| GOOGL / Alphabet Inc. | 0.04 | -47.20 | 6.65 | -58.91 | 1.9900 | -3.1600 | |||
| META / Meta Platforms, Inc. | 0.01 | -49.30 | 6.41 | -59.61 | 1.9200 | -3.1300 | |||
| BK / The Bank of New York Mellon Corporation | 0.08 | 301.11 | 6.24 | 275.44 | 1.8700 | 1.3400 | |||
| CALM / Cal-Maine Foods, Inc. | 0.07 | 141.98 | 6.19 | 109.40 | 1.8500 | 0.9100 | |||
| WSM / Williams-Sonoma, Inc. | 0.04 | 5.51 | 1.6500 | 1.6500 | |||||
| LRN / Stride, Inc. | 0.04 | 145.94 | 5.07 | 159.31 | 1.5200 | 0.9000 | |||
| LULU / lululemon athletica inc. | 0.02 | 376.87 | 4.70 | 211.88 | 1.4100 | 0.9300 | |||
| MCK / McKesson Corporation | 0.01 | 168.18 | 4.63 | 221.47 | 1.3900 | 0.9300 | |||
| OHI / Omega Healthcare Investors, Inc. | 0.11 | 13.54 | 4.47 | 19.63 | 1.3400 | 0.1500 | |||
| ANET / Arista Networks Inc | 0.05 | 13.49 | 4.39 | -18.98 | 1.3100 | -0.4100 | |||
| WFC / Wells Fargo & Company | 0.05 | 13.55 | 3.53 | 2.35 | 1.0600 | -0.0400 | |||
| CSCO / Cisco Systems, Inc. | 0.06 | 118.23 | 3.32 | 107.96 | 0.9900 | 0.4800 | |||
| CVSCL / CVS Health Corporation | 0.05 | 3.19 | 0.9600 | 0.9600 | |||||
| PLTR / Palantir Technologies Inc. | 0.03 | 13.55 | 3.05 | 63.10 | 0.9100 | 0.3200 | |||
| BRBR / BellRing Brands, Inc. | 0.04 | 277.16 | 2.71 | 276.28 | 0.8100 | 0.5800 | |||
| LDOS / Leidos Holdings, Inc. | 0.02 | 13.54 | 2.67 | 17.66 | 0.8000 | 0.0800 | |||
| NEU / NewMarket Corporation | 0.00 | 2.53 | 0.7600 | 0.7600 | |||||
| SYF / Synchrony Financial | 0.05 | -71.39 | 2.45 | -78.46 | 0.7300 | -2.8800 | |||
| DOCS / Doximity, Inc. | 0.04 | -25.71 | 2.30 | -28.50 | 0.6900 | -0.3300 | |||
| APP / AppLovin Corporation | 0.01 | 306.12 | 2.25 | 196.05 | 0.6700 | 0.4300 | |||
| EME / EMCOR Group, Inc. | 0.01 | 12.08 | 2.21 | 0.23 | 0.6600 | -0.0400 | |||
| EXC / Exelon Corporation | 0.04 | 13.55 | 2.10 | 33.10 | 0.6300 | 0.1300 | |||
| COR / Cencora, Inc. | 0.01 | 12.84 | 2.04 | 29.93 | 0.6100 | 0.1100 | |||
| TPR / Tapestry, Inc. | 0.03 | 13.31 | 2.02 | 9.77 | 0.6100 | 0.0200 | |||
| BROS / Dutch Bros Inc. | 0.03 | 13.42 | 2.00 | 8.41 | 0.6000 | 0.0100 | |||
| WM / Waste Management, Inc. | 0.01 | 13.08 | 2.00 | 19.80 | 0.6000 | 0.0700 | |||
| UBER / Uber Technologies, Inc. | 0.02 | 13.51 | 1.94 | 37.58 | 0.5800 | 0.1300 | |||
| VIRT / Virtu Financial, Inc. | 0.05 | 1.92 | 0.5700 | 0.5700 | |||||
| TRV / The Travelers Companies, Inc. | 0.01 | 12.55 | 1.88 | 21.20 | 0.5600 | 0.0700 | |||
| URBN / Urban Outfitters, Inc. | 0.04 | 1.87 | 0.5600 | 0.5600 | |||||
| PTCT / PTC Therapeutics, Inc. | 0.04 | 13.50 | 1.87 | 23.33 | 0.5600 | 0.0800 | |||
| EQT / EQT Corporation | 0.04 | 13.33 | 1.83 | 9.65 | 0.5500 | 0.0200 | |||
| PANW / Palo Alto Networks, Inc. | 0.01 | 1.78 | 0.5300 | 0.5300 | |||||
| MSI / Motorola Solutions, Inc. | 0.00 | 1.77 | 0.5300 | 0.5300 | |||||
| RL / Ralph Lauren Corporation | 0.01 | 12.84 | 1.76 | 1.62 | 0.5300 | -0.0200 | |||
| CB / Chubb Limited | 0.01 | 12.80 | 1.75 | 18.68 | 0.5200 | 0.0500 | |||
| SCHW / The Charles Schwab Corporation | 0.02 | 13.54 | 1.75 | 11.70 | 0.5200 | 0.0200 | |||
| KMI / Kinder Morgan, Inc. | 0.07 | 13.56 | 1.74 | 8.74 | 0.5200 | 0.0100 | |||
| MFC / Manulife Financial Corporation | 0.06 | 13.59 | 1.72 | 16.23 | 0.5200 | 0.0500 | |||
| BRO / Brown & Brown, Inc. | 0.02 | 1.67 | 0.5000 | 0.5000 | |||||
| GE / General Electric Company | 0.01 | 1.67 | 0.5000 | 0.5000 | |||||
| CAH / Cardinal Health, Inc. | 0.01 | 1.66 | 0.5000 | 0.5000 | |||||
| MS / Morgan Stanley | 0.01 | 12.95 | 1.59 | -5.85 | 0.4800 | -0.0600 | |||
| SUPN / Supernus Pharmaceuticals, Inc. | 0.05 | 13.56 | 1.58 | -3.88 | 0.4700 | -0.0500 | |||
| EXPD / Expeditors International of Washington, Inc. | 0.01 | 13.27 | 1.58 | 9.65 | 0.4700 | 0.0100 | |||
| DDN / Darden Restaurants, Inc. | 0.01 | 1.58 | 0.4700 | 0.4700 | |||||
| STT / State Street Corporation | 0.02 | 13.21 | 1.57 | -1.81 | 0.4700 | -0.0400 | |||
| PRI / Primerica, Inc. | 0.01 | 13.31 | 1.55 | 2.38 | 0.4600 | -0.0200 | |||
| LRCX / Lam Research Corporation | 0.02 | 1.54 | 0.4600 | 0.4600 | |||||
| ALSN / Allison Transmission Holdings, Inc. | 0.02 | 13.52 | 1.53 | -10.92 | 0.4600 | -0.0900 | |||
| CBOE / Cboe Global Markets, Inc. | 0.01 | 1.52 | 0.4500 | 0.4500 | |||||
| LAMR / Lamar Advertising Company | 0.01 | 13.49 | 1.52 | 2.16 | 0.4500 | -0.0200 | |||
| NTRS / Northern Trust Corporation | 0.02 | 13.21 | 1.52 | -5.25 | 0.4500 | -0.0600 | |||
| ELV / Elevance Health, Inc. | 0.00 | 1.50 | 0.4500 | 0.4500 | |||||
| YUM / Yum! Brands, Inc. | 0.01 | 1.49 | 0.4500 | 0.4500 | |||||
| ACN / Accenture plc | 0.00 | 11.48 | 1.44 | -13.38 | 0.4300 | -0.1000 | |||
| AVGO / Broadcom Inc. | 0.01 | 13.55 | 1.44 | -1.24 | 0.4300 | -0.0300 | |||
| FGXXX / First American Funds Inc - First American Government Obligations Fund Class X | 1.20 | 1,316.47 | 0.3600 | 0.3300 | |||||
| TT / Trane Technologies PLC | 0.00 | -92.56 | 1.13 | -92.14 | 0.3400 | -4.2200 | |||
| SFM / Sprouts Farmers Market, Inc. | 0.01 | -63.22 | 1.01 | -60.30 | 0.3000 | -0.5100 | |||
| UGI / UGI Corporation | 0.03 | 13.30 | 0.97 | 20.88 | 0.2900 | 0.0400 | |||
| ULTA / Ulta Beauty, Inc. | 0.00 | -67.44 | 0.92 | -68.74 | 0.2800 | -0.6600 | |||
| GILD / Gilead Sciences, Inc. | 0.01 | 12.91 | 0.92 | 23.76 | 0.2800 | 0.0400 | |||
| PTGX / Protagonist Therapeutics, Inc. | 0.02 | 0.85 | 0.2500 | 0.2500 | |||||
| LIN / Linde plc | 0.00 | 3,560.00 | 0.83 | 5,821.43 | 0.2500 | 0.2400 | |||
| ABBV / AbbVie Inc. | 0.00 | -61.89 | 0.83 | -59.57 | 0.2500 | -0.4000 | |||
| POR / Portland General Electric Company | 0.02 | -89.07 | 0.81 | -88.82 | 0.2400 | -2.0700 | |||
| TXRH / Texas Roadhouse, Inc. | 0.00 | -100.00 | 0.00 | -100.00 | -4.4000 | ||||
| ALNY / Alnylam Pharmaceuticals, Inc. | 0.00 | -100.00 | 0.00 | -100.00 | -1.1200 | ||||
| CORT / Corcept Therapeutics Incorporated | 0.00 | -100.00 | 0.00 | -100.00 | -0.8500 | ||||
| VERX / Vertex, Inc. | 0.00 | -100.00 | 0.00 | -100.00 | -0.2300 | ||||
| AA / Alcoa Corporation | 0.00 | -100.00 | 0.00 | -100.00 | -0.5100 | ||||
| NTAP / NetApp, Inc. | 0.00 | -100.00 | 0.00 | -100.00 | -1.9400 | ||||
| ATR / AptarGroup, Inc. | 0.00 | -100.00 | 0.00 | -100.00 | -0.4900 | ||||
| AMZN / Amazon.com, Inc. | 0.00 | -100.00 | 0.00 | -100.00 | -0.5600 | ||||
| DECK / Deckers Outdoor Corporation | 0.00 | -100.00 | 0.00 | -100.00 | -3.9400 | ||||
| PSN / Parsons Corporation | 0.00 | -100.00 | 0.00 | -100.00 | -0.4000 | ||||
| BYD / Boyd Gaming Corporation | 0.00 | -100.00 | 0.00 | -100.00 | -0.5200 | ||||
| ACLX / Arcellx, Inc. | 0.00 | -100.00 | 0.00 | -100.00 | -0.5000 | ||||
| CXW / CoreCivic, Inc. | 0.00 | -100.00 | 0.00 | -100.00 | -0.4600 | ||||
| LII / Lennox International Inc. | 0.00 | -100.00 | 0.00 | -100.00 | -0.4800 | ||||
| NBIX / Neurocrine Biosciences, Inc. | 0.00 | -100.00 | 0.00 | -100.00 | -1.1700 | ||||
| CACI / CACI International Inc | 0.00 | -100.00 | 0.00 | -100.00 | -0.3400 | ||||
| EIX / Edison International | 0.00 | -100.00 | 0.00 | -100.00 | -0.3300 | ||||
| MIRM / Mirum Pharmaceuticals, Inc. | 0.00 | -100.00 | 0.00 | -100.00 | -0.5300 | ||||
| PHM / PulteGroup, Inc. | 0.00 | -100.00 | 0.00 | -100.00 | -0.3500 | ||||
| AME / AMETEK, Inc. | 0.00 | -100.00 | 0.00 | -100.00 | -0.4600 |