Mga Batayang Estadistika
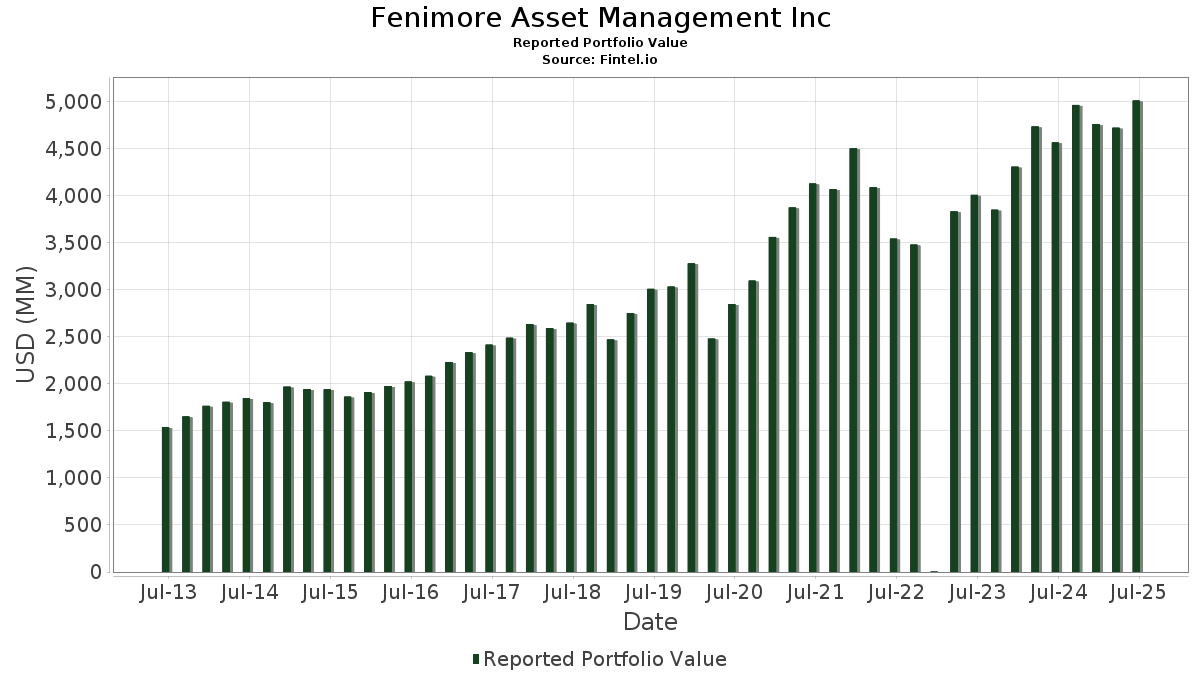
| Nilai Portofolio | $ 5,010,863,479 |
| Posisi Saat Ini | 90 |
Kepemilikan Terbaru, Kinerja, AUM (dari 13F, 13D)
Fenimore Asset Management Inc telah mengungkapkan total kepemilikan 90 dalam pengajuan SEC terbaru mereka. Nilai portofolio terbaru dihitung sebesar $ 5,010,863,479 USD. Aset yang Dikelola (AUM) sebenarnya adalah nilai ini ditambah kas (yang tidak diungkapkan). Aset-aset utama Fenimore Asset Management Inc adalah Brown & Brown, Inc. (US:BRO) , Amphenol Corporation (US:APH) , Stryker Corporation (US:SYK) , Ross Stores, Inc. (US:ROST) , and CDW Corporation (US:CDW) . Posisi baru Fenimore Asset Management Inc meliputi: GE HealthCare Technologies Inc. (US:GEHC) , Costco Wholesale Corporation (US:COST) , .
Peningkatan Tertinggi Kuartal Ini
Kami menggunakan perubahan dalam alokasi portofolio karena ini adalah metrik yang paling bermakna. Perubahan dapat disebabkan oleh perdagangan atau perubahan harga saham.
| Keamanan | Saham (MM) |
Nilai (Juta Dolar AS) |
Portfolio % | ΔPorsyento ng Portfolio |
|---|---|---|---|---|
| 2.29 | 225.88 | 4.5079 | 1.3176 | |
| 1.40 | 98.52 | 1.9660 | 0.6135 | |
| 0.42 | 182.09 | 3.6339 | 0.5546 | |
| 0.43 | 110.67 | 2.2085 | 0.4759 | |
| 0.02 | 115.40 | 2.3031 | 0.3559 | |
| 2.59 | 160.36 | 3.2001 | 0.3170 | |
| 0.50 | 118.14 | 2.3576 | 0.3116 | |
| 0.36 | 65.59 | 1.3089 | 0.2977 | |
| 0.35 | 108.43 | 2.1639 | 0.2311 | |
| 0.10 | 18.76 | 0.3743 | 0.2030 |
Penurunan Tertinggi Kuartal Ini
Kami menggunakan perubahan dalam alokasi portofolio karena ini adalah metrik yang paling bermakna. Perubahan dapat disebabkan oleh perdagangan atau perubahan harga saham.
| Keamanan | Saham (MM) |
Nilai (Juta Dolar AS) |
Portfolio % | ΔPorsyento ng Portfolio |
|---|---|---|---|---|
| 2.14 | 237.28 | 4.7354 | -0.9141 | |
| 0.36 | 114.07 | 2.2765 | -0.4062 | |
| 0.56 | 149.27 | 2.9789 | -0.3894 | |
| 2.77 | 121.35 | 2.4218 | -0.3481 | |
| 1.61 | 204.78 | 4.0867 | -0.2559 | |
| 0.03 | 123.61 | 2.4668 | -0.2302 | |
| 0.87 | 153.21 | 3.0576 | -0.2231 | |
| 1.14 | 202.95 | 4.0503 | -0.1794 | |
| 0.42 | 61.49 | 1.2270 | -0.1369 | |
| 0.24 | 85.09 | 1.6981 | -0.1323 |
Pengajuan 13F dan Dana
Formulir ini diajukan pada 2025-07-22 untuk periode pelaporan 2025-06-30. Klik ikon tautan untuk melihat riwayat transaksi selengkapnya.
Tingkatkan ke versi premium untuk membuka data premium dan ekspor ke Excel. ![]() .
.
| Keamanan | Ketik | Harga Saham Rata-rata | Saham (MM) |
ΔSaham (%) |
ΔSaham (%) |
Nilai ($MM) |
Portpolyo (%) |
ΔPortofolio (%) |
|
|---|---|---|---|---|---|---|---|---|---|
| BRO / Brown & Brown, Inc. | 2.14 | -0.19 | 237.28 | -11.05 | 4.7354 | -0.9141 | |||
| APH / Amphenol Corporation | 2.29 | -0.40 | 225.88 | 49.95 | 4.5079 | 1.3176 | |||
| SYK / Stryker Corporation | 0.52 | 0.16 | 207.63 | 6.45 | 4.1436 | 0.0126 | |||
| ROST / Ross Stores, Inc. | 1.61 | 0.04 | 204.78 | -0.13 | 4.0867 | -0.2559 | |||
| CDW / CDW Corporation | 1.14 | -8.81 | 202.95 | 1.62 | 4.0503 | -0.1794 | |||
| TT / Trane Technologies plc | 0.42 | -3.53 | 182.09 | 25.24 | 3.6339 | 0.5546 | |||
| MKL / Markel Group Inc. | 0.09 | 0.04 | 176.55 | 6.87 | 3.5234 | 0.0248 | |||
| VMC / Vulcan Materials Company | 0.67 | 0.31 | 173.67 | 12.14 | 3.4658 | 0.1859 | |||
| BN / Brookfield Corporation | 2.59 | -0.19 | 160.36 | 17.79 | 3.2001 | 0.3170 | |||
| FAST / Fastenal Company | 3.75 | 101.03 | 157.40 | 8.87 | 3.1412 | 0.0793 | |||
| IEX / IDEX Corporation | 0.87 | 1.95 | 153.21 | -1.09 | 3.0576 | -0.2231 | |||
| PGR / The Progressive Corporation | 0.56 | -0.46 | 149.27 | -6.14 | 2.9789 | -0.3894 | |||
| AZO / AutoZone, Inc. | 0.03 | -0.31 | 123.61 | -2.93 | 2.4668 | -0.2302 | |||
| EXLS / ExlService Holdings, Inc. | 2.77 | 0.04 | 121.35 | -7.21 | 2.4218 | -0.3481 | |||
| PNFP / Pinnacle Financial Partners, Inc. | 1.08 | 2.24 | 118.91 | 6.45 | 2.3730 | 0.0072 | |||
| ADI / Analog Devices, Inc. | 0.50 | 3.61 | 118.14 | 22.29 | 2.3576 | 0.3116 | |||
| BKNG / Booking Holdings Inc. | 0.02 | -0.12 | 115.40 | 25.52 | 2.3031 | 0.3559 | |||
| AJG / Arthur J. Gallagher & Co. | 0.36 | -2.88 | 114.07 | -9.95 | 2.2765 | -0.4062 | |||
| HEIA / Heico Corp. - Class A | 0.43 | 10.30 | 110.67 | 35.28 | 2.2085 | 0.4759 | |||
| ZBRA / Zebra Technologies Corporation | 0.35 | 8.87 | 108.43 | 18.81 | 2.1639 | 0.2311 | |||
| KEYS / Keysight Technologies, Inc. | 0.63 | 5.22 | 102.54 | 15.12 | 2.0464 | 0.1600 | |||
| MCHP / Microchip Technology Incorporated | 1.40 | 6.13 | 98.52 | 54.27 | 1.9660 | 0.6135 | |||
| ITW / Illinois Tool Works Inc. | 0.39 | 0.59 | 97.30 | 0.28 | 1.9418 | -0.1132 | |||
| GGG / Graco Inc. | 1.10 | 0.72 | 94.45 | 3.68 | 1.8849 | -0.0444 | |||
| WAT / Waters Corporation | 0.24 | 3.96 | 85.09 | -1.55 | 1.6981 | -0.1323 | |||
| BR / Broadridge Financial Solutions, Inc. | 0.32 | 0.66 | 76.93 | 0.89 | 1.5352 | -0.0796 | |||
| STE / STERIS plc | 0.31 | 3.16 | 74.96 | 9.34 | 1.4960 | 0.0439 | |||
| RSG / Republic Services, Inc. | 0.28 | -0.59 | 69.29 | 1.24 | 1.3828 | -0.0667 | |||
| AME / AMETEK, Inc. | 0.36 | 30.67 | 65.59 | 37.36 | 1.3089 | 0.2977 | |||
| CTAS / Cintas Corporation | 0.28 | 0.13 | 61.88 | 8.58 | 1.2348 | 0.0279 | |||
| PAYX / Paychex, Inc. | 0.42 | 1.26 | 61.49 | -4.53 | 1.2270 | -0.1369 | |||
| BAM / Brookfield Asset Management Ltd. | 0.93 | 1.77 | 51.44 | 16.12 | 1.0265 | 0.0884 | |||
| MLM / Martin Marietta Materials, Inc. | 0.09 | 5.98 | 48.78 | 21.68 | 0.9734 | 0.1244 | |||
| EOG / EOG Resources, Inc. | 0.37 | 1.21 | 44.80 | -5.60 | 0.8940 | -0.1111 | |||
| ENTG / Entegris, Inc. | 0.55 | 5.14 | 44.19 | -3.06 | 0.8818 | -0.0836 | |||
| JKHY / Jack Henry & Associates, Inc. | 0.23 | 4.64 | 41.92 | 3.25 | 0.8366 | -0.0233 | |||
| VRSK / Verisk Analytics, Inc. | 0.13 | 6.90 | 41.73 | 11.88 | 0.8328 | 0.0429 | |||
| BRK.A / Berkshire Hathaway Inc. | 0.00 | 0.00 | 37.90 | -8.72 | 0.7563 | -0.1230 | |||
| CIGI / Colliers International Group Inc. | 0.25 | 3.16 | 32.33 | 11.02 | 0.6452 | 0.0284 | |||
| CBZ / CBIZ, Inc. | 0.43 | 0.01 | 31.01 | -5.46 | 0.6188 | -0.0758 | |||
| WSO / Watsco, Inc. | 0.07 | 19.81 | 30.90 | 4.09 | 0.6167 | -0.0120 | |||
| ROP / Roper Technologies, Inc. | 0.05 | 4.20 | 27.77 | 0.18 | 0.5542 | -0.0329 | |||
| POOL / Pool Corporation | 0.10 | 0.26 | 27.70 | -8.20 | 0.5527 | -0.0863 | |||
| BROS / Dutch Bros Inc. | 0.40 | -0.37 | 27.59 | 10.33 | 0.5505 | 0.0210 | |||
| AVY / Avery Dennison Corporation | 0.14 | 6.25 | 25.13 | 4.75 | 0.5015 | -0.0066 | |||
| BIPC / Brookfield Infrastructure Corporation | 0.57 | 0.18 | 23.59 | 15.15 | 0.4707 | 0.0369 | |||
| TRRSF / Trisura Group Ltd. | 0.69 | -0.12 | 22.76 | 39.91 | 0.4541 | 0.1097 | |||
| CHH / Choice Hotels International, Inc. | 0.18 | 0.15 | 22.64 | -4.30 | 0.4518 | -0.0492 | |||
| A / Agilent Technologies, Inc. | 0.18 | 2.74 | 21.35 | 3.64 | 0.4260 | -0.0102 | |||
| FTDR / Frontdoor, Inc. | 0.34 | 0.59 | 20.05 | 54.32 | 0.4002 | 0.1250 | |||
| OSW / OneSpaWorld Holdings Limited | 0.94 | 0.45 | 19.08 | 21.99 | 0.3807 | 0.0495 | |||
| HLI / Houlihan Lokey, Inc. | 0.10 | 108.14 | 18.76 | 131.94 | 0.3743 | 0.2030 | |||
| SITE / SiteOne Landscape Supply, Inc. | 0.15 | 2.83 | 18.53 | 2.41 | 0.3699 | -0.0134 | |||
| FSV / FirstService Corporation | 0.10 | -0.21 | 17.53 | 5.00 | 0.3497 | -0.0038 | |||
| DFH / Dream Finders Homes, Inc. | 0.69 | 3.44 | 17.30 | 15.22 | 0.3452 | 0.0273 | |||
| SPSC / SPS Commerce, Inc. | 0.12 | -0.05 | 16.86 | 2.48 | 0.3364 | -0.0120 | |||
| NOMD / Nomad Foods Limited | 0.92 | -11.81 | 15.65 | -23.75 | 0.3124 | -0.1224 | |||
| BWIN / The Baldwin Insurance Group, Inc. | 0.35 | 3.13 | 15.04 | -1.21 | 0.3002 | -0.0223 | |||
| AIF / Altus Group Limited | 0.38 | -0.15 | 14.77 | 9.25 | 0.2948 | 0.0084 | |||
| CASS / Cass Information Systems, Inc. | 0.34 | 0.19 | 14.75 | 0.66 | 0.2944 | -0.0160 | |||
| HOMB / Home Bancshares, Inc. (Conway, AR) | 0.51 | 0.20 | 14.57 | 0.87 | 0.2908 | -0.0151 | |||
| LSTR / Landstar System, Inc. | 0.10 | 4.08 | 14.31 | -3.66 | 0.2856 | -0.0290 | |||
| EXPO / Exponent, Inc. | 0.19 | 0.31 | 14.31 | -7.55 | 0.2855 | -0.0422 | |||
| CHE / Chemed Corporation | 0.03 | -0.28 | 14.13 | -21.09 | 0.2820 | -0.0972 | |||
| ESI / Element Solutions Inc | 0.62 | 0.41 | 14.10 | 0.59 | 0.2814 | -0.0155 | |||
| BOC / Boston Omaha Corporation | 0.95 | 0.56 | 13.38 | -3.16 | 0.2670 | -0.0256 | |||
| DSGX / The Descartes Systems Group Inc. | 0.13 | 0.20 | 13.33 | 1.01 | 0.2660 | -0.0135 | |||
| FND / Floor & Decor Holdings, Inc. | 0.17 | 23.74 | 13.12 | 16.80 | 0.2618 | 0.0239 | |||
| ESAB / ESAB Corporation | 0.11 | 0.03 | 12.82 | 3.51 | 0.2559 | -0.0065 | |||
| FELE / Franklin Electric Co., Inc. | 0.14 | 0.24 | 12.53 | -4.17 | 0.2501 | -0.0269 | |||
| GEHC / GE HealthCare Technologies Inc. | 0.13 | 9.26 | 0.1848 | 0.1848 | |||||
| BRK.B / Berkshire Hathaway Inc. | 0.02 | -3.03 | 7.42 | -11.56 | 0.1481 | -0.0296 | |||
| VUG / Vanguard Index Funds - Vanguard Growth ETF | 0.01 | 0.00 | 2.89 | 18.24 | 0.0576 | 0.0059 | |||
| AAPL / Apple Inc. | 0.01 | 0.00 | 2.77 | -7.65 | 0.0552 | -0.0082 | |||
| Powershares Dynamic Large Cap / ETF (73935X609) | 0.02 | 2.00 | 0.0000 | ||||||
| ABBV / AbbVie Inc. | 0.01 | 0.00 | 1.38 | -11.40 | 0.0276 | -0.0055 | |||
| SPY / SPDR S&P 500 ETF | 0.00 | 0.00 | 0.91 | 10.41 | 0.0182 | 0.0007 | |||
| IBM / International Business Machines Corporation | 0.00 | 0.00 | 0.76 | 18.62 | 0.0151 | 0.0016 | |||
| IVV / iShares Trust - iShares Core S&P 500 ETF | 0.00 | 0.00 | 0.75 | 10.53 | 0.0149 | 0.0006 | |||
| XLY / The Select Sector SPDR Trust - The Consumer Discretionary Select Sector SPDR Fund | 0.00 | 0.00 | 0.68 | 10.02 | 0.0136 | 0.0005 | |||
| MSFT / Microsoft Corporation | 0.00 | 0.00 | 0.68 | 32.35 | 0.0135 | 0.0027 | |||
| NBTB / NBT Bancorp Inc. | 0.01 | 0.00 | 0.60 | -3.22 | 0.0120 | -0.0011 | |||
| CNMD / CONMED Corporation | 0.01 | 0.00 | 0.46 | -13.78 | 0.0093 | -0.0021 | |||
| UNP / Union Pacific Corporation | 0.00 | 0.00 | 0.36 | -2.67 | 0.0073 | -0.0007 | |||
| XOM / Exxon Mobil Corporation | 0.00 | -12.89 | 0.36 | -21.04 | 0.0073 | -0.0025 | |||
| USB / U.S. Bancorp | 0.01 | 0.00 | 0.33 | 7.12 | 0.0066 | 0.0001 | |||
| MSCI / MSCI Inc. | 0.00 | 0.00 | 0.33 | 1.86 | 0.0066 | -0.0003 | |||
| ZTS / Zoetis Inc. | 0.00 | 0.00 | 0.32 | -5.07 | 0.0063 | -0.0008 | |||
| MCO / Moody's Corporation | 0.00 | 0.00 | 0.30 | 7.64 | 0.0059 | 0.0001 | |||
| COST / Costco Wholesale Corporation | 0.00 | 0.21 | 0.0041 | 0.0041 | |||||
| TROW / T. Rowe Price Group, Inc. | 0.00 | -100.00 | 0.00 | 0.0000 | |||||
| MKC / McCormick & Company, Incorporated | 0.00 | -100.00 | 0.00 | 0.0000 | |||||
| HGTY / Hagerty, Inc. | 0.00 | -100.00 | 0.00 | 0.0000 |