Mga Batayang Estadistika
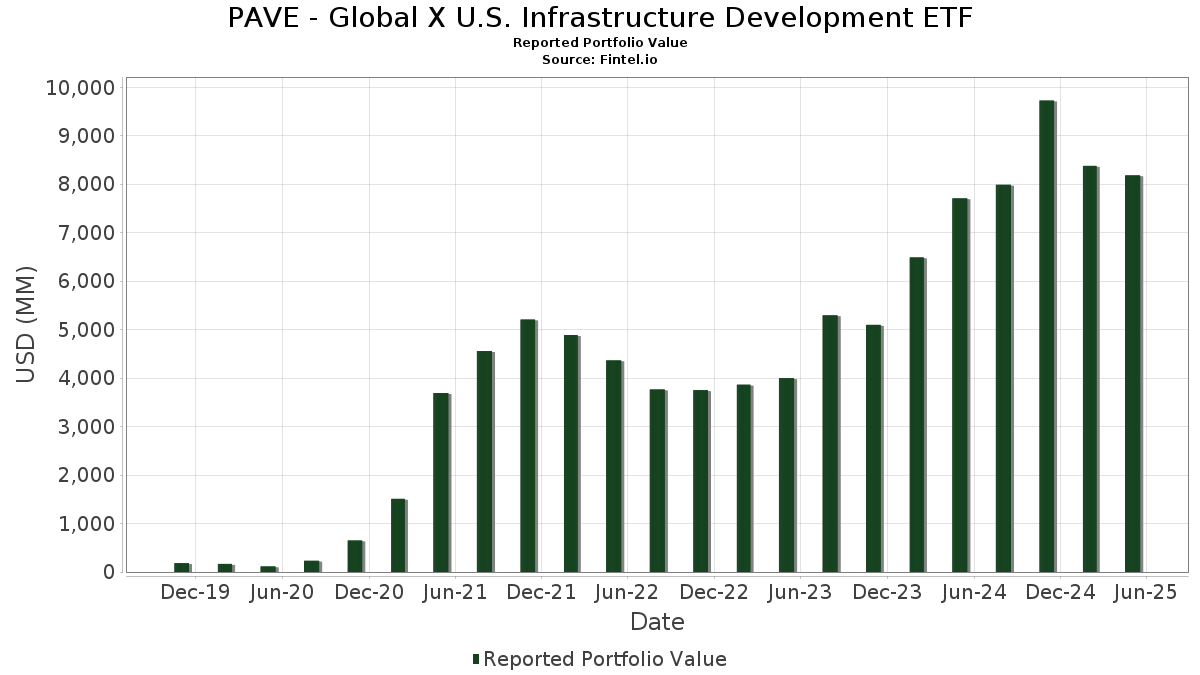
| Nilai Portofolio | $ 8,181,615,926 |
| Posisi Saat Ini | 103 |
Kepemilikan Terbaru, Kinerja, AUM (dari 13F, 13D)
PAVE - Global X U.S. Infrastructure Development ETF telah mengungkapkan total kepemilikan 103 dalam pengajuan SEC terbaru mereka. Nilai portofolio terbaru dihitung sebesar $ 8,181,615,926 USD. Aset yang Dikelola (AUM) sebenarnya adalah nilai ini ditambah kas (yang tidak diungkapkan). Aset-aset utama PAVE - Global X U.S. Infrastructure Development ETF adalah Howmet Aerospace Inc. (US:HWM) , Fastenal Company (US:FAST) , Trane Technologies plc (US:TT) , Deere & Company (US:DE) , and Parker-Hannifin Corporation (US:PH) . Posisi baru PAVE - Global X U.S. Infrastructure Development ETF meliputi: Fidelity Investments Money Market Government Portfolio (US:US31607A7037) , .
Peningkatan Tertinggi Kuartal Ini
Kami menggunakan perubahan dalam alokasi portofolio karena ini adalah metrik yang paling bermakna. Perubahan dapat disebabkan oleh perdagangan atau perubahan harga saham.
| Keamanan | Saham (MM) |
Nilai (Juta Dolar AS) |
Portfolio % | ΔPorsyento ng Portfolio |
|---|---|---|---|---|
| 2.03 | 344.39 | 4.2091 | 0.7195 | |
| 0.73 | 250.06 | 3.0562 | 0.6678 | |
| 0.65 | 278.36 | 3.4021 | 0.5188 | |
| 0.37 | 202.60 | 2.4761 | 0.2241 | |
| 0.86 | 68.84 | 0.8413 | 0.2085 | |
| 1.36 | 73.41 | 0.8971 | 0.2063 | |
| 6.86 | 283.72 | 3.4675 | 0.1924 | |
| 0.33 | 232.66 | 2.8436 | 0.1864 | |
| 3.13 | 245.76 | 3.0036 | 0.1833 | |
| 0.28 | 131.42 | 1.6062 | 0.1710 |
Penurunan Tertinggi Kuartal Ini
Kami menggunakan perubahan dalam alokasi portofolio karena ini adalah metrik yang paling bermakna. Perubahan dapat disebabkan oleh perdagangan atau perubahan harga saham.
| Keamanan | Saham (MM) |
Nilai (Juta Dolar AS) |
Portfolio % | ΔPorsyento ng Portfolio |
|---|---|---|---|---|
| 1.42 | 155.45 | 1.8999 | -0.5625 | |
| 2.58 | 234.84 | 2.8702 | -0.4579 | |
| 0.78 | 55.36 | 0.6766 | -0.4262 | |
| 1.04 | 231.40 | 2.8282 | -0.4173 | |
| 2.10 | 147.38 | 1.8013 | -0.3040 | |
| 0.70 | 75.04 | 0.9171 | -0.3033 | |
| 3.00 | 17.47 | 0.2135 | -0.1949 | |
| 0.92 | 113.45 | 1.3865 | -0.1820 | |
| 1.97 | 235.68 | 2.8804 | -0.1451 | |
| 1.57 | 41.91 | 0.5122 | -0.1431 |
Pengajuan 13F dan Dana
Formulir ini diajukan pada 2025-07-30 untuk periode pelaporan 2025-05-31. Klik ikon tautan untuk melihat riwayat transaksi selengkapnya.
Tingkatkan ke versi premium untuk membuka data premium dan ekspor ke Excel. ![]() .
.
| Keamanan | Ketik | Harga Saham Rata-rata | Saham (MM) |
ΔSaham (%) |
ΔSaham (%) |
Nilai ($MM) |
Portpolyo (%) |
ΔPortofolio (%) |
|
|---|---|---|---|---|---|---|---|---|---|
| HWM / Howmet Aerospace Inc. | 2.03 | -5.14 | 344.39 | 17.98 | 4.2091 | 0.7195 | |||
| FAST / Fastenal Company | 6.86 | 89.71 | 283.72 | 3.56 | 3.4675 | 0.1924 | |||
| TT / Trane Technologies plc | 0.65 | -5.13 | 278.36 | 15.41 | 3.4021 | 0.5188 | |||
| DE / Deere & Company | 0.55 | -5.11 | 276.18 | -0.09 | 3.3753 | 0.0710 | |||
| PH / Parker-Hannifin Corporation | 0.38 | -5.14 | 253.16 | -5.68 | 3.0940 | -0.1147 | |||
| PWR / Quanta Services, Inc. | 0.73 | -5.14 | 250.06 | 25.16 | 3.0562 | 0.6678 | |||
| NSC / Norfolk Southern Corporation | 1.01 | -5.16 | 249.79 | -4.63 | 3.0529 | -0.0784 | |||
| SRE / Sempra | 3.13 | -5.13 | 245.76 | 4.17 | 3.0036 | 0.1833 | |||
| CSX / CSX Corporation | 7.69 | -5.14 | 242.96 | -6.38 | 2.9694 | -0.1331 | |||
| EMR / Emerson Electric Co. | 1.97 | -5.14 | 235.68 | -6.88 | 2.8804 | -0.1451 | |||
| CRH / CRH plc | 2.58 | -5.13 | 234.84 | -15.65 | 2.8702 | -0.4579 | |||
| URI / United Rentals, Inc. | 0.33 | -5.09 | 232.66 | 4.68 | 2.8436 | 0.1864 | |||
| UNP / Union Pacific Corporation | 1.04 | -5.14 | 231.40 | -14.76 | 2.8282 | -0.4173 | |||
| ETN / Eaton Corporation plc | 0.70 | -5.10 | 224.32 | 3.59 | 2.7416 | 0.1530 | |||
| ROK / Rockwell Automation, Inc. | 0.68 | -5.11 | 215.93 | 4.27 | 2.6391 | 0.1635 | |||
| VMC / Vulcan Materials Company | 0.80 | -5.11 | 211.92 | 1.71 | 2.5900 | 0.0991 | |||
| MLM / Martin Marietta Materials, Inc. | 0.37 | -5.10 | 202.60 | 7.55 | 2.4761 | 0.2241 | |||
| NUE / Nucor Corporation | 1.42 | -5.13 | 155.45 | -24.53 | 1.8999 | -0.5625 | |||
| FTV / Fortive Corporation | 2.10 | -5.16 | 147.38 | -16.31 | 1.8013 | -0.3040 | |||
| EME / EMCOR Group, Inc. | 0.28 | -5.14 | 131.42 | 9.47 | 1.6062 | 0.1710 | |||
| HUBB / Hubbell Incorporated | 0.33 | -5.13 | 126.64 | -0.54 | 1.5478 | 0.0256 | |||
| STLD / Steel Dynamics, Inc. | 0.92 | -5.10 | 113.45 | -13.53 | 1.3865 | -0.1820 | |||
| TRMB / Trimble Inc. | 1.49 | -5.16 | 106.02 | -6.10 | 1.2958 | -0.0540 | |||
| CSL / Carlisle Companies Incorporated | 0.27 | -5.10 | 104.35 | 5.88 | 1.2753 | 0.0972 | |||
| PNR / Pentair plc | 1.00 | -5.09 | 99.24 | -0.08 | 1.2128 | 0.0256 | |||
| RS / Reliance, Inc. | 0.33 | -5.05 | 95.98 | -6.44 | 1.1730 | -0.0533 | |||
| J / Jacobs Solutions Inc. | 0.75 | -5.11 | 94.84 | -6.45 | 1.1592 | -0.0529 | |||
| RPM / RPM International Inc. | 0.78 | -5.13 | 88.62 | -12.83 | 1.0831 | -0.1322 | |||
| ACM / AECOM | 0.80 | -5.08 | 88.24 | 4.22 | 1.0785 | 0.0663 | |||
| GGG / Graco Inc. | 1.02 | -5.09 | 86.57 | -7.72 | 1.0580 | -0.0635 | |||
| IEX / IDEX Corporation | 0.46 | -5.12 | 82.95 | -11.68 | 1.0138 | -0.1089 | |||
| WWD / Woodward, Inc. | 0.36 | -5.11 | 77.83 | 8.61 | 0.9512 | 0.0946 | |||
| BLDR / Builders FirstSource, Inc. | 0.70 | -5.12 | 75.04 | -26.50 | 0.9171 | -0.3033 | |||
| MTZ / MasTec, Inc. | 0.48 | -5.11 | 74.83 | 13.31 | 0.9146 | 0.1251 | |||
| X / United States Steel Corporation | 1.36 | -5.08 | 73.41 | 27.02 | 0.8971 | 0.2063 | |||
| CRS / Carpenter Technology Corporation | 0.30 | -5.18 | 70.90 | 7.61 | 0.8665 | 0.0789 | |||
| RBC / RBC Bearings Incorporated | 0.19 | -4.99 | 69.62 | -3.23 | 0.8509 | -0.0092 | |||
| ATI / ATI Inc. | 0.86 | -5.03 | 68.84 | 30.05 | 0.8413 | 0.2085 | |||
| LECO / Lincoln Electric Holdings, Inc. | 0.34 | -5.19 | 66.11 | -11.20 | 0.8080 | -0.0820 | |||
| CR / Crane Company | 0.35 | -5.00 | 59.44 | -0.10 | 0.7264 | 0.0152 | |||
| TTEK / Tetra Tech, Inc. | 1.62 | -5.07 | 56.73 | 13.63 | 0.6933 | 0.0965 | |||
| WLK / Westlake Corporation | 0.78 | -5.13 | 55.36 | -39.99 | 0.6766 | -0.4262 | |||
| MLI / Mueller Industries, Inc. | 0.69 | -5.06 | 53.65 | -7.79 | 0.6558 | -0.0399 | |||
| US7587501039 / Regal-Beloit Corp. | 0.40 | -5.20 | 53.48 | -2.24 | 0.6536 | -0.0004 | |||
| WMS / Advanced Drainage Systems, Inc. | 0.47 | -5.04 | 51.65 | -6.26 | 0.6313 | -0.0274 | |||
| BLD / TopBuild Corp. | 0.18 | -5.08 | 50.55 | -12.37 | 0.6179 | -0.0718 | |||
| WCC / WESCO International, Inc. | 0.30 | -5.06 | 49.84 | -11.68 | 0.6092 | -0.0655 | |||
| AYI / Acuity Inc. | 0.19 | -5.00 | 48.82 | -16.91 | 0.5967 | -0.1057 | |||
| BMI / Badger Meter, Inc. | 0.18 | -5.04 | 44.24 | 12.07 | 0.5407 | 0.0688 | |||
| SPXC / SPX Technologies, Inc. | 0.28 | -5.20 | 42.66 | -1.01 | 0.5214 | 0.0062 | |||
| AA / Alcoa Corporation | 1.57 | -5.05 | 41.91 | -23.55 | 0.5122 | -0.1431 | |||
| EXP / Eagle Materials Inc. | 0.20 | -5.13 | 41.08 | -15.20 | 0.5021 | -0.0770 | |||
| DY / Dycom Industries, Inc. | 0.18 | -4.98 | 40.67 | 33.33 | 0.4971 | 0.1324 | |||
| VMI / Valmont Industries, Inc. | 0.12 | -5.16 | 38.58 | -13.41 | 0.4715 | -0.0611 | |||
| LPX / Louisiana-Pacific Corporation | 0.43 | -4.98 | 38.35 | -14.13 | 0.4687 | -0.0652 | |||
| ZWS / Zurn Elkay Water Solutions Corporation | 1.03 | -5.02 | 37.23 | -2.98 | 0.4550 | -0.0037 | |||
| TPC / Tutor Perini Corporation | 0.97 | -4.93 | 35.90 | 19.29 | 0.4388 | 0.0790 | |||
| STRL / Sterling Infrastructure, Inc. | 0.19 | -5.04 | 35.02 | 40.34 | 0.4280 | 0.1297 | |||
| ROAD / Construction Partners, Inc. | 0.31 | -4.95 | 32.89 | 37.14 | 0.4020 | 0.1153 | |||
| KNF / Knife River Corporation | 0.34 | -5.17 | 32.25 | -6.74 | 0.3941 | -0.0192 | |||
| CMC / Commercial Metals Company | 0.69 | -4.99 | 32.10 | -8.62 | 0.3923 | -0.0276 | |||
| IIIN / Insteel Industries, Inc. | 0.89 | -5.01 | 31.34 | 18.21 | 0.3830 | 0.0661 | |||
| AGX / Argan, Inc. | 0.15 | -4.77 | 31.22 | 53.62 | 0.3816 | 0.1386 | |||
| CSW / CSW Industrials, Inc. | 0.10 | -5.12 | 31.15 | -5.21 | 0.3807 | -0.0121 | |||
| TITN / Titan Machinery Inc. | 1.64 | -4.99 | 30.69 | 3.25 | 0.3750 | 0.0197 | |||
| CALX / Calix, Inc. | 0.66 | -4.98 | 30.33 | 18.68 | 0.3707 | 0.0652 | |||
| ASTE / Astec Industries, Inc. | 0.74 | -4.99 | 28.99 | 4.91 | 0.3544 | 0.0240 | |||
| PLPC / Preformed Line Products Company | 0.20 | -4.99 | 28.21 | 4.03 | 0.3448 | 0.0206 | |||
| HEES / H&E Equipment Services, Inc. | 0.29 | -4.95 | 27.66 | -6.19 | 0.3381 | -0.0144 | |||
| DNOW / DNOW Inc. | 1.88 | -5.00 | 27.10 | -14.28 | 0.3312 | -0.0467 | |||
| MWA / Mueller Water Products, Inc. | 1.09 | -5.00 | 26.82 | -9.54 | 0.3278 | -0.0266 | |||
| MYRG / MYR Group Inc. | 0.17 | -4.98 | 26.30 | 21.44 | 0.3215 | 0.0626 | |||
| RYI / Ryerson Holding Corporation | 1.26 | -4.99 | 26.23 | -21.67 | 0.3205 | -0.0797 | |||
| ACA / Arcosa, Inc. | 0.30 | -4.95 | 25.52 | -2.24 | 0.3119 | -0.0002 | |||
| GVA / Granite Construction Incorporated | 0.28 | -4.96 | 25.00 | 2.94 | 0.3055 | 0.0152 | |||
| CTRI / Centuri Holdings, Inc. | 1.20 | -4.91 | 24.99 | 14.44 | 0.3054 | 0.0444 | |||
| GRC / The Gorman-Rupp Company | 0.68 | -4.98 | 24.84 | -9.06 | 0.3036 | -0.0230 | |||
| ROCK / Gibraltar Industries, Inc. | 0.42 | -5.19 | 24.70 | -15.48 | 0.3018 | -0.0475 | |||
| MDU / MDU Resources Group, Inc. | 1.43 | -4.95 | 24.67 | -5.28 | 0.3015 | -0.0098 | |||
| TEX / Terex Corporation | 0.53 | -4.89 | 23.90 | 5.19 | 0.2921 | 0.0205 | |||
| EXPO / Exponent, Inc. | 0.31 | -4.90 | 23.51 | -14.25 | 0.2873 | -0.0404 | |||
| PRIM / Primoris Services Corporation | 0.33 | -5.13 | 23.46 | -4.64 | 0.2867 | -0.0074 | |||
| USLM / United States Lime & Minerals, Inc. | 0.22 | -4.93 | 22.48 | 4.12 | 0.2747 | 0.0166 | |||
| MTUS / Metallus Inc. | 1.75 | -4.95 | 22.13 | -16.86 | 0.2704 | -0.0477 | |||
| HRI / Herc Holdings Inc. | 0.17 | -4.82 | 21.38 | -17.74 | 0.2613 | -0.0494 | |||
| MRC / MRC Global Inc. | 1.72 | -4.91 | 21.38 | -3.03 | 0.2613 | -0.0023 | |||
| CTOS / Custom Truck One Source, Inc. | 4.83 | -4.91 | 20.79 | -7.70 | 0.2541 | -0.0152 | |||
| CENX / Century Aluminum Company | 1.31 | -4.95 | 20.30 | -22.30 | 0.2481 | -0.0642 | |||
| NWPX / NWPX Infrastructure, Inc. | 0.52 | -4.97 | 20.10 | -16.68 | 0.2457 | -0.0427 | |||
| DXPE / DXP Enterprises, Inc. | 0.24 | -5.17 | 20.01 | -13.33 | 0.2445 | -0.0314 | |||
| MTRN / Materion Corporation | 0.25 | -4.90 | 19.65 | -19.40 | 0.2401 | -0.0513 | |||
| ATKR / Atkore Inc. | 0.30 | -4.93 | 19.50 | 0.63 | 0.2384 | 0.0067 | |||
| MTX / Minerals Technologies Inc. | 0.34 | -5.18 | 19.41 | -21.68 | 0.2373 | -0.0590 | |||
| CLF / Cleveland-Cliffs Inc. | 3.00 | -4.94 | 17.47 | -48.87 | 0.2135 | -0.1949 | |||
| TRN / Trinity Industries, Inc. | 0.66 | -4.90 | 16.99 | -21.26 | 0.2076 | -0.0503 | |||
| GBX / The Greenbrier Companies, Inc. | 0.37 | -4.81 | 16.63 | -23.67 | 0.2033 | -0.0572 | |||
| POWL / Powell Industries, Inc. | 0.09 | -4.59 | 15.18 | -4.66 | 0.1855 | -0.0048 | |||
| WNC / Wabash National Corporation | 1.65 | -4.89 | 14.30 | -29.58 | 0.1748 | -0.0680 | |||
| CMCO / Columbus McKinnon Corporation | 0.70 | -4.68 | 10.21 | -20.38 | 0.1248 | -0.0285 | |||
| BBHREPOS / RA (N/A) | 5.26 | 0.0643 | 0.0643 | ||||||
| US31607A7037 / Fidelity Investments Money Market Government Portfolio | 5.05 | -19.43 | 0.0617 | -0.0132 | |||||
| E-MINI RUSS 2000 JUN25 PHYSICAL INDEX FUTURE. / DE (N/A) | 1.96 | 0.0240 | 0.0240 | ||||||
| AMTM / Amentum Holdings, Inc. | 0.05 | 0.95 | 0.0116 | 0.0116 |