Mga Batayang Estadistika
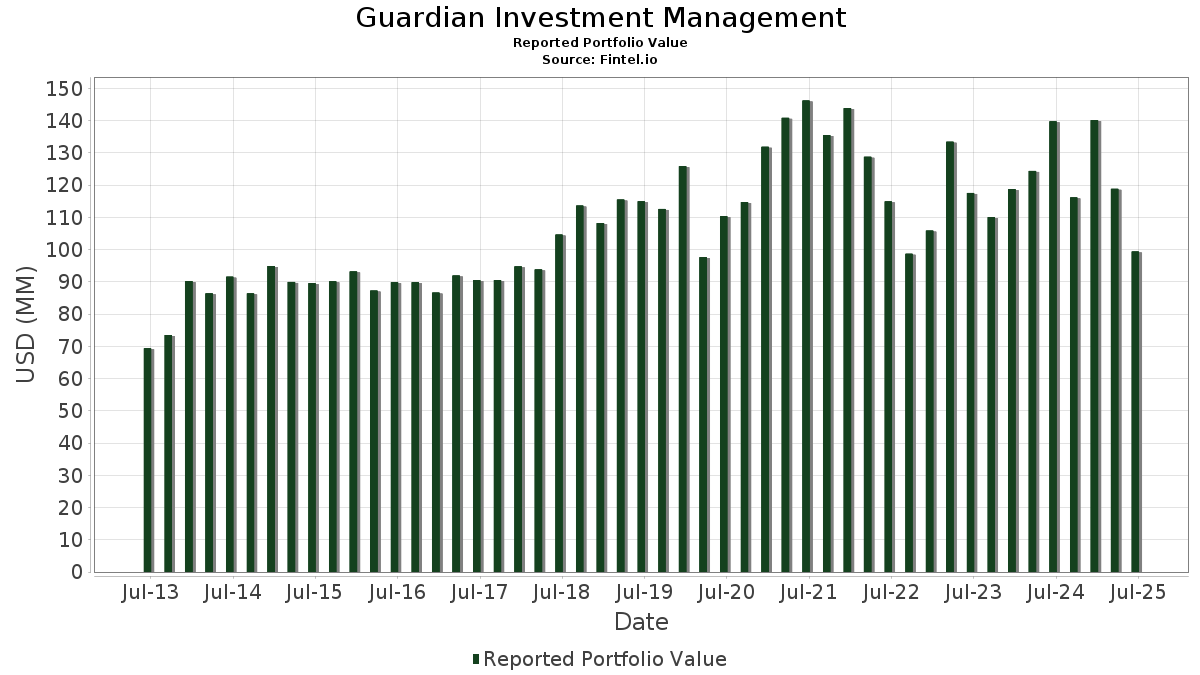
| Nilai Portofolio | $ 99,371,050 |
| Posisi Saat Ini | 51 |
Kepemilikan Terbaru, Kinerja, AUM (dari 13F, 13D)
Guardian Investment Management telah mengungkapkan total kepemilikan 51 dalam pengajuan SEC terbaru mereka. Nilai portofolio terbaru dihitung sebesar $ 99,371,050 USD. Aset yang Dikelola (AUM) sebenarnya adalah nilai ini ditambah kas (yang tidak diungkapkan). Aset-aset utama Guardian Investment Management adalah Apple Inc. (US:AAPL) , Danaher Corporation (US:DHR) , Amgen Inc. (US:AMGN) , Costco Wholesale Corporation (US:COST) , and Microsoft Corporation (US:MSFT) .
Peningkatan Tertinggi Kuartal Ini
Kami menggunakan perubahan dalam alokasi portofolio karena ini adalah metrik yang paling bermakna. Perubahan dapat disebabkan oleh perdagangan atau perubahan harga saham.
| Keamanan | Saham (MM) |
Nilai (Juta Dolar AS) |
Portfolio % | ΔPorsyento ng Portfolio |
|---|---|---|---|---|
| 0.06 | 10.03 | 10.0957 | 6.4728 | |
| 0.01 | 5.00 | 5.0278 | 1.4115 | |
| 0.05 | 2.74 | 2.7594 | 1.2486 | |
| 0.01 | 4.15 | 4.1767 | 1.1770 | |
| 0.07 | 3.42 | 3.4414 | 0.9383 | |
| 0.01 | 1.73 | 1.7435 | 0.8512 | |
| 0.00 | 1.45 | 1.4596 | 0.7473 | |
| 0.00 | 1.94 | 1.9483 | 0.6750 | |
| 0.00 | 0.89 | 0.8935 | 0.5332 | |
| 0.01 | 1.49 | 1.4971 | 0.4994 |
Penurunan Tertinggi Kuartal Ini
Kami menggunakan perubahan dalam alokasi portofolio karena ini adalah metrik yang paling bermakna. Perubahan dapat disebabkan oleh perdagangan atau perubahan harga saham.
| Keamanan | Saham (MM) |
Nilai (Juta Dolar AS) |
Portfolio % | ΔPorsyento ng Portfolio |
|---|---|---|---|---|
| 0.00 | 1.42 | 1.4323 | -0.6207 | |
| 0.01 | 1.66 | 1.6690 | -0.4696 | |
| 0.08 | 16.13 | 16.2321 | -0.3584 | |
| 0.01 | 2.45 | 2.4650 | -0.2704 | |
| 0.01 | 2.65 | 2.6702 | -0.2218 | |
| 0.01 | 0.67 | 0.6698 | -0.1709 | |
| 0.01 | 0.44 | 0.4425 | -0.0631 | |
| 0.00 | 0.56 | 0.5649 | -0.0308 | |
| 0.03 | 1.03 | 1.0340 | -0.0086 | |
| 0.01 | 0.78 | 0.7870 | -0.0001 |
Pengajuan 13F dan Dana
Formulir ini diajukan pada 2025-07-17 untuk periode pelaporan 2025-06-30. Klik ikon tautan untuk melihat riwayat transaksi selengkapnya.
Tingkatkan ke versi premium untuk membuka data premium dan ekspor ke Excel. ![]() .
.
| Keamanan | Ketik | Harga Saham Rata-rata | Saham (MM) |
ΔSaham (%) |
ΔSaham (%) |
Nilai ($MM) |
Portpolyo (%) |
ΔPortofolio (%) |
|
|---|---|---|---|---|---|---|---|---|---|
| AAPL / Apple Inc. | 0.08 | -11.41 | 16.13 | -18.17 | 16.2321 | -0.3584 | |||
| DHR / Danaher Corporation | 0.06 | 49.04 | 10.03 | 133.09 | 10.0957 | 6.4728 | |||
| AMGN / Amgen Inc. | 0.02 | 2.75 | 5.22 | -7.92 | 5.2530 | 0.4818 | |||
| COST / Costco Wholesale Corporation | 0.01 | 11.09 | 5.00 | 16.29 | 5.0278 | 1.4115 | |||
| MSFT / Microsoft Corporation | 0.01 | -12.11 | 4.15 | 16.47 | 4.1767 | 1.1770 | |||
| BAC / Bank of America Corporation | 0.07 | 1.40 | 3.42 | 14.96 | 3.4414 | 0.9383 | |||
| WMT / Walmart Inc. | 0.03 | -24.24 | 3.41 | -15.63 | 3.4292 | 0.0303 | |||
| QS / QuantumScape Corporation | 0.05 | 336.21 | 2.74 | 52.76 | 2.7594 | 1.2486 | |||
| ABBV / AbbVie Inc. | 0.01 | -12.84 | 2.65 | -22.79 | 2.6702 | -0.2218 | |||
| CVX / Chevron Corporation | 0.02 | -1.11 | 2.55 | -15.36 | 2.5617 | 0.0304 | |||
| JPM / JPMorgan Chase & Co. | 0.01 | -36.23 | 2.45 | -24.62 | 2.4650 | -0.2704 | |||
| JNJ / Johnson & Johnson | 0.02 | -7.56 | 2.45 | -14.80 | 2.4629 | 0.0450 | |||
| GE / General Electric Company | 0.01 | -1.10 | 2.19 | 0.00 | 2.2005 | 0.3601 | |||
| CAT / Caterpillar Inc. | 0.00 | 8.72 | 1.94 | 28.04 | 1.9483 | 0.6750 | |||
| AMZN / Amazon.com, Inc. | 0.01 | 41.73 | 1.73 | 63.40 | 1.7435 | 0.8512 | |||
| PG / The Procter & Gamble Company | 0.01 | -30.18 | 1.66 | -34.72 | 1.6690 | -0.4696 | |||
| KKR / KKR & Co. Inc. | 0.01 | -1.21 | 1.63 | 20.00 | 1.6366 | 0.4958 | |||
| BA / The Boeing Company | 0.01 | 2.16 | 1.49 | 25.49 | 1.4971 | 0.4994 | |||
| ITW / Illinois Tool Works Inc. | 0.01 | -15.49 | 1.48 | -15.74 | 1.4929 | 0.0109 | |||
| GEV / GE Vernova Inc. | 0.00 | -1.12 | 1.45 | 71.39 | 1.4596 | 0.7473 | |||
| BRK.B / Berkshire Hathaway Inc. | 0.00 | -41.16 | 1.42 | -41.66 | 1.4323 | -0.6207 | |||
| MMM / 3M Company | 0.01 | -8.16 | 1.37 | -4.20 | 1.3788 | 0.1747 | |||
| PEP / PepsiCo, Inc. | 0.01 | -0.17 | 1.33 | -12.10 | 1.3394 | 0.0652 | |||
| XOM / Exxon Mobil Corporation | 0.01 | 9.31 | 1.27 | -0.39 | 1.2735 | 0.2040 | |||
| CSX / CSX Corporation | 0.04 | 0.00 | 1.26 | 10.88 | 1.2724 | 0.3126 | |||
| INTC / Intel Corporation | 0.06 | 2.66 | 1.25 | 1.29 | 1.2623 | 0.2197 | |||
| MRK / Merck & Co., Inc. | 0.02 | 0.00 | 1.20 | -11.81 | 1.2029 | 0.0621 | |||
| CMCSA / Comcast Corporation | 0.03 | -5.71 | 1.18 | -8.83 | 1.1852 | 0.0982 | |||
| CSCO / Cisco Systems, Inc. | 0.02 | -2.33 | 1.16 | 9.74 | 1.1691 | 0.2786 | |||
| ADM / Archer-Daniels-Midland Company | 0.01 | 6.04 | 1.12 | 46.54 | 1.1281 | 0.4839 | |||
| TXN / Texas Instruments Incorporated | 0.01 | 0.00 | 1.08 | 15.52 | 1.0865 | 0.3000 | |||
| WBD / Warner Bros. Discovery, Inc. | 0.09 | 9.37 | 1.05 | 16.80 | 1.0576 | 0.3002 | |||
| SLB / Schlumberger Limited | 0.03 | 0.00 | 1.03 | -17.04 | 1.0340 | -0.0086 | |||
| T / AT&T Inc. | 0.03 | -1.75 | 0.97 | 0.62 | 0.9793 | 0.1646 | |||
| C / Citigroup Inc. | 0.01 | 0.00 | 0.90 | 19.89 | 0.9101 | 0.2750 | |||
| AMAT / Applied Materials, Inc. | 0.00 | 64.41 | 0.89 | 107.24 | 0.8935 | 0.5332 | |||
| ABT / Abbott Laboratories | 0.01 | -18.44 | 0.78 | -16.36 | 0.7870 | -0.0001 | |||
| DE / Deere & Company | 0.00 | 0.00 | 0.73 | 8.35 | 0.7317 | 0.1668 | |||
| MDLZ / Mondelez International, Inc. | 0.01 | -2.42 | 0.68 | -2.99 | 0.6855 | 0.0944 | |||
| BIIB / Biogen Inc. | 0.01 | -27.40 | 0.67 | -33.37 | 0.6698 | -0.1709 | |||
| HD / The Home Depot, Inc. | 0.00 | 0.00 | 0.56 | -20.65 | 0.5649 | -0.0308 | |||
| EMR / Emerson Electric Co. | 0.00 | 0.00 | 0.45 | 21.68 | 0.4527 | 0.1414 | |||
| BMY / Bristol-Myers Squibb Company | 0.01 | -3.55 | 0.44 | -26.83 | 0.4425 | -0.0631 | |||
| GT / The Goodyear Tire & Rubber Company | 0.04 | 5.06 | 0.43 | 18.13 | 0.4331 | 0.1266 | |||
| GILD / Gilead Sciences, Inc. | 0.00 | 0.00 | 0.42 | -1.19 | 0.4184 | 0.0647 | |||
| IBM / International Business Machines Corporation | 0.00 | -20.00 | 0.35 | -5.11 | 0.3560 | 0.0420 | |||
| NOC / Northrop Grumman Corporation | 0.00 | -12.63 | 0.35 | -14.81 | 0.3482 | 0.0069 | |||
| EL / The Estée Lauder Companies Inc. | 0.00 | -4.49 | 0.34 | 17.06 | 0.3456 | 0.0984 | |||
| PFE / Pfizer Inc. | 0.01 | 17.02 | 0.33 | 13.65 | 0.3355 | 0.0883 | |||
| RTX / RTX Corporation | 0.00 | 0.00 | 0.31 | 0.00 | 0.3086 | 0.0509 | |||
| V / Visa Inc. | 0.01 | -3.58 | 0.29 | -7.91 | 0.2931 | 0.0266 | |||
| AXP / American Express Company | 0.00 | -100.00 | 0.00 | 0.0000 | |||||
| UPS / United Parcel Service, Inc. | 0.00 | -100.00 | 0.00 | 0.0000 | |||||
| PARAA / Paramount Global | 0.00 | -100.00 | 0.00 | 0.0000 | |||||
| ADP / Automatic Data Processing, Inc. | 0.00 | -100.00 | 0.00 | 0.0000 | |||||
| BX / Blackstone Inc. | 0.00 | -100.00 | 0.00 | 0.0000 | |||||
| GS / The Goldman Sachs Group, Inc. | 0.00 | -100.00 | 0.00 | 0.0000 |