Mga Batayang Estadistika
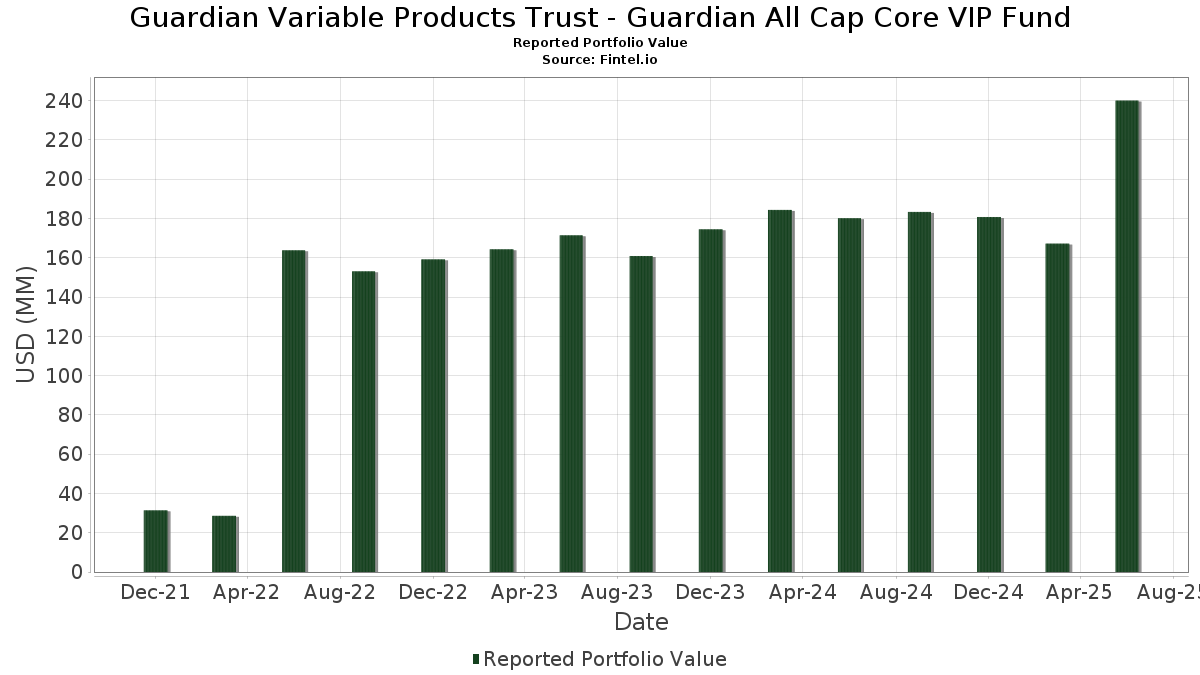
| Nilai Portofolio | $ 240,006,001 |
| Posisi Saat Ini | 178 |
Kepemilikan Terbaru, Kinerja, AUM (dari 13F, 13D)
Guardian Variable Products Trust - Guardian All Cap Core VIP Fund telah mengungkapkan total kepemilikan 178 dalam pengajuan SEC terbaru mereka. Nilai portofolio terbaru dihitung sebesar $ 240,006,001 USD. Aset yang Dikelola (AUM) sebenarnya adalah nilai ini ditambah kas (yang tidak diungkapkan). Aset-aset utama Guardian Variable Products Trust - Guardian All Cap Core VIP Fund adalah Microsoft Corporation (US:MSFT) , Amazon.com, Inc. (US:AMZN) , NVIDIA Corporation (US:NVDA) , Meta Platforms, Inc. (US:META) , and Apple Inc. (US:AAPL) . Posisi baru Guardian Variable Products Trust - Guardian All Cap Core VIP Fund meliputi: Mastercard Incorporated (US:MA) , American Tower Corporation (US:AMT) , Foothills Exploration, Inc. (US:FTXP) , Vistra Corp. (IT:1VST) , and Tapestry, Inc. (US:TPR) .
Peningkatan Tertinggi Kuartal Ini
Kami menggunakan perubahan dalam alokasi portofolio karena ini adalah metrik yang paling bermakna. Perubahan dapat disebabkan oleh perdagangan atau perubahan harga saham.
| Keamanan | Saham (MM) |
Nilai (Juta Dolar AS) |
Portfolio % | ΔPorsyento ng Portfolio |
|---|---|---|---|---|
| 0.01 | 4.13 | 1.7210 | 1.7210 | |
| 0.03 | 17.33 | 7.2238 | 1.2275 | |
| 0.02 | 6.80 | 2.8355 | 1.1339 | |
| 0.01 | 2.04 | 0.8491 | 0.8491 | |
| 1.88 | 0.7836 | 0.7836 | ||
| 0.00 | 1.47 | 0.6122 | 0.6122 | |
| 0.01 | 1.37 | 0.5703 | 0.4495 | |
| 0.01 | 7.62 | 3.1756 | 0.4479 | |
| 0.00 | 0.96 | 0.4009 | 0.4009 | |
| 0.01 | 1.03 | 0.4296 | 0.2795 |
Penurunan Tertinggi Kuartal Ini
Kami menggunakan perubahan dalam alokasi portofolio karena ini adalah metrik yang paling bermakna. Perubahan dapat disebabkan oleh perdagangan atau perubahan harga saham.
| Keamanan | Saham (MM) |
Nilai (Juta Dolar AS) |
Portfolio % | ΔPorsyento ng Portfolio |
|---|---|---|---|---|
| 0.00 | 1.35 | 0.5626 | -1.3740 | |
| 0.00 | 1.15 | 0.4813 | -0.8933 | |
| 0.00 | 1.06 | 0.4415 | -0.4338 | |
| 0.02 | 3.06 | 1.2747 | -0.3406 | |
| 0.04 | 7.30 | 3.0436 | -0.3263 | |
| 0.01 | 0.76 | 0.3151 | -0.2968 | |
| 0.00 | 0.45 | 0.1881 | -0.2926 | |
| 0.03 | 2.27 | 0.9470 | -0.2725 | |
| 0.01 | 1.21 | 0.5037 | -0.2447 | |
| 0.00 | 0.00 | -0.1947 |
Pengajuan 13F dan Dana
Formulir ini diajukan pada 2025-08-15 untuk periode pelaporan 2025-06-30. Klik ikon tautan untuk melihat riwayat transaksi selengkapnya.
Tingkatkan ke versi premium untuk membuka data premium dan ekspor ke Excel. ![]() .
.
| Keamanan | Ketik | Harga Saham Rata-rata | Saham (MM) |
ΔSaham (%) |
ΔSaham (%) |
Nilai ($MM) |
Portpolyo (%) |
ΔPortofolio (%) |
|
|---|---|---|---|---|---|---|---|---|---|
| MSFT / Microsoft Corporation | 0.03 | 31.06 | 17.33 | 73.66 | 7.2238 | 1.2275 | |||
| AMZN / Amazon.com, Inc. | 0.05 | 31.06 | 11.27 | 51.13 | 4.6988 | 0.2168 | |||
| NVDA / NVIDIA Corporation | 0.06 | 4.16 | 9.58 | 51.85 | 3.9926 | 0.2022 | |||
| META / Meta Platforms, Inc. | 0.01 | 31.05 | 7.62 | 67.84 | 3.1756 | 0.4479 | |||
| AAPL / Apple Inc. | 0.04 | 40.96 | 7.30 | 30.20 | 3.0436 | -0.3263 | |||
| GOOGL / Alphabet Inc. | 0.04 | 31.06 | 7.03 | 49.35 | 2.9313 | 0.1023 | |||
| AVGO / Broadcom Inc. | 0.02 | 827.93 | 6.80 | 129.13 | 2.8355 | 1.1339 | |||
| JPM / JPMorgan Chase & Co. | 0.02 | 31.06 | 5.09 | 54.87 | 2.1224 | 0.1472 | |||
| MA / Mastercard Incorporated | 0.01 | 4.13 | 1.7210 | 1.7210 | |||||
| TRU / TransUnion | 0.04 | 48.37 | 3.70 | 57.36 | 1.5414 | 0.1290 | |||
| JNJ / Johnson & Johnson | 0.02 | 38.74 | 3.60 | 27.78 | 1.5013 | -0.1923 | |||
| ABBV / AbbVie Inc. | 0.02 | 28.40 | 3.06 | 13.76 | 1.2747 | -0.3406 | |||
| PFE / Pfizer Inc. | 0.11 | 79.49 | 2.75 | 71.74 | 1.1477 | 0.1841 | |||
| HD / The Home Depot, Inc. | 0.01 | 31.07 | 2.64 | 31.09 | 1.1023 | -0.1095 | |||
| CDNS / Cadence Design Systems, Inc. | 0.01 | 31.07 | 2.59 | 58.79 | 1.0809 | 0.0997 | |||
| CDW / CDW Corporation | 0.01 | 39.88 | 2.55 | 55.87 | 1.0630 | 0.0800 | |||
| CRM / Salesforce, Inc. | 0.01 | 31.06 | 2.48 | 33.19 | 1.0320 | -0.0851 | |||
| SPOT / Spotify Technology S.A. | 0.00 | 31.04 | 2.40 | 82.93 | 1.0003 | 0.2116 | |||
| LRCX / Lam Research Corporation | 0.02 | 31.06 | 2.38 | 75.48 | 0.9933 | 0.1773 | |||
| BKNG / Booking Holdings Inc. | 0.00 | 31.15 | 2.32 | 64.77 | 0.9651 | 0.1209 | |||
| TNET / TriNet Group, Inc. | 0.03 | 21.28 | 2.27 | 11.98 | 0.9470 | -0.2725 | |||
| XOM / Exxon Mobil Corporation | 0.02 | 47.95 | 2.27 | 34.12 | 0.9469 | -0.0710 | |||
| CI / The Cigna Group | 0.01 | 31.06 | 2.09 | 31.74 | 0.8703 | -0.0824 | |||
| MDT / Medtronic plc | 0.02 | 31.06 | 2.08 | 27.16 | 0.8665 | -0.1160 | |||
| AMT / American Tower Corporation | 0.01 | 2.04 | 0.8491 | 0.8491 | |||||
| BJ / BJ's Wholesale Club Holdings, Inc. | 0.02 | 31.07 | 1.97 | 23.90 | 0.8190 | -0.1342 | |||
| AON / Aon plc | 0.01 | 31.08 | 1.95 | 17.22 | 0.8115 | -0.1868 | |||
| FIXED INC CLEARING CORP.REPO / RA (000000000) | 1.88 | 0.7836 | 0.7836 | ||||||
| ETN / Eaton Corporation plc | 0.01 | 31.06 | 1.80 | 72.18 | 0.7509 | 0.1220 | |||
| WAT / Waters Corporation | 0.00 | 35.24 | 1.69 | 28.13 | 0.7045 | -0.0884 | |||
| VRTX / Vertex Pharmaceuticals Incorporated | 0.00 | 25.75 | 1.69 | 15.47 | 0.7032 | -0.1747 | |||
| BSX / Boston Scientific Corporation | 0.02 | 27.62 | 1.68 | 35.89 | 0.7006 | -0.0427 | |||
| WFC / Wells Fargo & Company | 0.02 | 29.91 | 1.68 | 44.99 | 0.7001 | 0.0040 | |||
| PM / Philip Morris International Inc. | 0.01 | 31.05 | 1.65 | 50.50 | 0.6880 | 0.0285 | |||
| CB / Chubb Limited | 0.01 | 31.08 | 1.62 | 25.76 | 0.6758 | -0.0989 | |||
| GE / General Electric Company | 0.01 | 20.44 | 1.61 | 54.91 | 0.6705 | 0.0465 | |||
| KKR / KKR & Co. Inc. | 0.01 | 40.68 | 1.57 | 61.86 | 0.6546 | 0.0717 | |||
| MS / Morgan Stanley | 0.01 | 31.06 | 1.57 | 58.28 | 0.6534 | 0.0582 | |||
| DIS / The Walt Disney Company | 0.01 | 31.05 | 1.57 | 64.74 | 0.6524 | 0.0812 | |||
| ADI / Analog Devices, Inc. | 0.01 | 13.79 | 1.53 | 34.33 | 0.6378 | -0.0468 | |||
| APH / Amphenol Corporation | 0.02 | 31.07 | 1.49 | 97.49 | 0.6225 | 0.1678 | |||
| BDX / Becton, Dickinson and Company | 0.01 | 54.04 | 1.49 | 15.90 | 0.6198 | -0.1515 | |||
| LNG / Cheniere Energy, Inc. | 0.01 | 31.04 | 1.47 | 37.92 | 0.6139 | -0.0278 | |||
| FTXP / Foothills Exploration, Inc. | 0.00 | 1.47 | 0.6122 | 0.6122 | |||||
| EMR / Emerson Electric Co. | 0.01 | 53.92 | 1.43 | 87.29 | 0.5959 | 0.1370 | |||
| TEAM / Atlassian Corporation | 0.01 | 31.07 | 1.42 | 25.44 | 0.5919 | -0.0883 | |||
| MCK / McKesson Corporation | 0.00 | 16.23 | 1.42 | 26.63 | 0.5906 | -0.0821 | |||
| AJG / Arthur J. Gallagher & Co. | 0.00 | 31.04 | 1.41 | 21.54 | 0.5858 | -0.1092 | |||
| PEP / PepsiCo, Inc. | 0.01 | 31.06 | 1.37 | 15.38 | 0.5726 | -0.1426 | |||
| NSIT / Insight Enterprises, Inc. | 0.01 | 46.14 | 1.37 | 34.51 | 0.5721 | -0.0409 | |||
| RTX / RTX Corporation | 0.01 | 247.33 | 1.37 | 605.15 | 0.5703 | 0.4495 | |||
| PNC / The PNC Financial Services Group, Inc. | 0.01 | 21.08 | 1.36 | 28.48 | 0.5662 | -0.0694 | |||
| V / Visa Inc. | 0.00 | -58.66 | 1.35 | -58.14 | 0.5626 | -1.3740 | |||
| HWM / Howmet Aerospace Inc. | 0.01 | 25.88 | 1.34 | 80.78 | 0.5569 | 0.1124 | |||
| ARMK / Aramark | 0.03 | 31.06 | 1.25 | 58.93 | 0.5197 | 0.0484 | |||
| CRH / CRH plc | 0.01 | 42.88 | 1.24 | 49.22 | 0.5168 | 0.0171 | |||
| COP / ConocoPhillips | 0.01 | 13.54 | 1.21 | -2.97 | 0.5037 | -0.2447 | |||
| CME / CME Group Inc. | 0.00 | 31.08 | 1.20 | 36.21 | 0.5005 | -0.0293 | |||
| Aptiv PLC / EC (JE00BTDN8H13) | 0.02 | 17.33 | 1.18 | 34.47 | 0.4913 | -0.0351 | |||
| TMUS / T-Mobile US, Inc. | 0.00 | -43.50 | 1.15 | -49.56 | 0.4813 | -0.8933 | |||
| MCO / Moody's Corporation | 0.00 | 31.08 | 1.13 | 41.13 | 0.4707 | -0.0099 | |||
| TT / Trane Technologies plc | 0.00 | 31.09 | 1.11 | 70.34 | 0.4643 | 0.0710 | |||
| MDLZ / Mondelez International, Inc. | 0.02 | 31.06 | 1.11 | 30.28 | 0.4629 | -0.0493 | |||
| HLT / Hilton Worldwide Holdings Inc. | 0.00 | 31.06 | 1.09 | 53.37 | 0.4552 | 0.0275 | |||
| TSLA / Tesla, Inc. | 0.00 | -40.68 | 1.06 | -27.27 | 0.4415 | -0.4338 | |||
| VNX / NXP Semiconductors N.V. | 0.00 | 31.07 | 1.05 | 50.79 | 0.4394 | 0.0190 | |||
| APG / APi Group Corporation | 0.02 | 82.16 | 1.05 | 160.20 | 0.4359 | 0.1943 | |||
| J / Jacobs Solutions Inc. | 0.01 | 279.26 | 1.03 | 312.00 | 0.4296 | 0.2795 | |||
| WAB / Westinghouse Air Brake Technologies Corporation | 0.00 | 31.07 | 1.02 | 51.41 | 0.4247 | 0.0201 | |||
| SCHW / The Charles Schwab Corporation | 0.01 | 31.04 | 1.01 | 52.72 | 0.4216 | 0.0237 | |||
| AIG / American International Group, Inc. | 0.01 | 47.64 | 1.01 | 45.31 | 0.4198 | 0.0035 | |||
| LDOS / Leidos Holdings, Inc. | 0.01 | 61.97 | 1.01 | 89.64 | 0.4198 | 0.1002 | |||
| DE / Deere & Company | 0.00 | 48.34 | 1.00 | 60.71 | 0.4162 | 0.0429 | |||
| CCEP / COCA COLA EUROPACIFIC COMPANY GUAR REGS 11/27 1.5 | 0.01 | 31.06 | 1.00 | 39.58 | 0.4161 | -0.0135 | |||
| PCG / PG&E Corporation | 0.07 | 31.06 | 0.99 | 6.31 | 0.4146 | -0.1474 | |||
| LIN / Linde plc | 0.00 | 31.12 | 0.97 | 32.07 | 0.4053 | -0.0369 | |||
| AME / AMETEK, Inc. | 0.01 | 31.05 | 0.96 | 37.77 | 0.4014 | -0.0186 | |||
| 1VST / Vistra Corp. | 0.00 | 0.96 | 0.4009 | 0.4009 | |||||
| GWRE / Guidewire Software, Inc. | 0.00 | 2.51 | 0.94 | 28.69 | 0.3930 | -0.0468 | |||
| ROST / Ross Stores, Inc. | 0.01 | 31.06 | 0.91 | 30.85 | 0.3803 | -0.0387 | |||
| NDSN / Nordson Corporation | 0.00 | 31.04 | 0.91 | 39.32 | 0.3783 | -0.0133 | |||
| WTY / Willis Towers Watson Public Limited Company | 0.00 | 48.03 | 0.90 | 34.23 | 0.3744 | -0.0276 | |||
| KVUE / Kenvue Inc. | 0.04 | 31.06 | 0.85 | 14.40 | 0.3546 | -0.0923 | |||
| OKTA / Okta, Inc. | 0.01 | 61.77 | 0.83 | 53.69 | 0.3474 | 0.0216 | |||
| VRSK / Verisk Analytics, Inc. | 0.00 | 31.03 | 0.83 | 37.21 | 0.3443 | -0.0176 | |||
| FI / Fiserv, Inc. | 0.00 | 55.55 | 0.83 | 21.47 | 0.3442 | -0.0644 | |||
| SBUX / Starbucks Corporation | 0.01 | 31.07 | 0.81 | 22.41 | 0.3394 | -0.0602 | |||
| GFL / GFL Environmental Inc. | 0.02 | 36.72 | 0.81 | 42.73 | 0.3358 | -0.0032 | |||
| CL / Colgate-Palmolive Company | 0.01 | 31.05 | 0.80 | 27.26 | 0.3348 | -0.0448 | |||
| DUK / Duke Energy Corporation | 0.01 | 55.04 | 0.80 | 50.00 | 0.3327 | 0.0130 | |||
| FRT / Federal Realty Investment Trust | 0.01 | 31.08 | 0.80 | 27.36 | 0.3317 | -0.0440 | |||
| GEV / GE Vernova Inc. | 0.00 | 30.95 | 0.78 | 126.90 | 0.3237 | 0.1181 | |||
| PG / The Procter & Gamble Company | 0.00 | 31.05 | 0.78 | 22.63 | 0.3231 | -0.0571 | |||
| MSI / Motorola Solutions, Inc. | 0.00 | 31.08 | 0.77 | 25.90 | 0.3222 | -0.0468 | |||
| NEE / NextEra Energy, Inc. | 0.01 | 17.45 | 0.76 | 14.91 | 0.3183 | -0.0806 | |||
| HES / Hess Corporation | 0.01 | -14.41 | 0.76 | -25.74 | 0.3151 | -0.2968 | |||
| TECH / Bio-Techne Corporation | 0.01 | 72.84 | 0.75 | 51.83 | 0.3116 | 0.0155 | |||
| STE / STERIS plc | 0.00 | -8.78 | 0.74 | -3.40 | 0.3078 | -0.1512 | |||
| GD / General Dynamics Corporation | 0.00 | 35.28 | 0.72 | 44.69 | 0.3011 | 0.0012 | |||
| NNN / NNN REIT, Inc. | 0.02 | 233.33 | 0.72 | 237.09 | 0.2996 | 0.1716 | |||
| TYL / Tyler Technologies, Inc. | 0.00 | 57.01 | 0.72 | 60.18 | 0.2987 | 0.0298 | |||
| MPWR / Monolithic Power Systems, Inc. | 0.00 | 31.01 | 0.71 | 65.05 | 0.2975 | 0.0379 | |||
| CMCSA / Comcast Corporation | 0.02 | 31.06 | 0.69 | 26.69 | 0.2892 | -0.0397 | |||
| FIS / Fidelity National Information Services, Inc. | 0.01 | 51.89 | 0.68 | 65.61 | 0.2833 | 0.0367 | |||
| US21871X1090 / Corebridge Financial, Inc. | 0.02 | 31.07 | 0.67 | 47.57 | 0.2781 | 0.0061 | |||
| CR / Crane Company | 0.00 | 31.05 | 0.64 | 62.34 | 0.2662 | 0.0300 | |||
| LKQ / LKQ Corporation | 0.02 | 31.06 | 0.63 | 14.05 | 0.2607 | -0.0689 | |||
| SRE / Sempra | 0.01 | 31.07 | 0.62 | 39.37 | 0.2598 | -0.0093 | |||
| TPR / Tapestry, Inc. | 0.01 | 0.62 | 0.2592 | 0.2592 | |||||
| USFD / US Foods Holding Corp. | 0.01 | 31.06 | 0.61 | 54.16 | 0.2552 | 0.0166 | |||
| BPOP / Popular, Inc. | 0.01 | 14.53 | 0.61 | 36.69 | 0.2549 | -0.0140 | |||
| SHW / The Sherwin-Williams Company | 0.00 | 57.10 | 0.61 | 54.45 | 0.2531 | 0.0169 | |||
| TTWO / Take-Two Interactive Software, Inc. | 0.00 | 31.01 | 0.60 | 53.71 | 0.2506 | 0.0153 | |||
| REXR / Rexford Industrial Realty, Inc. | 0.02 | 31.06 | 0.60 | 19.12 | 0.2494 | -0.0525 | |||
| CTVA / Corteva, Inc. | 0.01 | 10.38 | 0.59 | 30.87 | 0.2441 | -0.0251 | |||
| HUBS / HubSpot, Inc. | 0.00 | 19.72 | 0.58 | 16.67 | 0.2422 | -0.0571 | |||
| APD / Air Products and Chemicals, Inc. | 0.00 | 58.44 | 0.58 | 51.57 | 0.2416 | 0.0118 | |||
| DXCM / DexCom, Inc. | 0.01 | 72.32 | 0.57 | 120.70 | 0.2358 | 0.0815 | |||
| ROP / Roper Technologies, Inc. | 0.00 | 31.13 | 0.56 | 26.07 | 0.2339 | -0.0335 | |||
| 3E1 / Elastic N.V. | 0.01 | 68.09 | 0.56 | 59.43 | 0.2327 | 0.0218 | |||
| ACN / Accenture plc | 0.00 | 126.60 | 0.55 | 117.00 | 0.2292 | 0.0770 | |||
| PNR / Pentair plc | 0.01 | 31.06 | 0.55 | 53.78 | 0.2291 | 0.0144 | |||
| ELF / e.l.f. Beauty, Inc. | 0.00 | 72.86 | 0.55 | 243.13 | 0.2289 | 0.1326 | |||
| EPAM / EPAM Systems, Inc. | 0.00 | 31.12 | 0.55 | 37.34 | 0.2285 | -0.0114 | |||
| BLDR / Builders FirstSource, Inc. | 0.00 | 6.03 | 0.55 | -0.90 | 0.2284 | -0.1041 | |||
| RJF / Raymond James Financial, Inc. | 0.00 | 52.84 | 0.54 | 68.87 | 0.2239 | 0.0326 | |||
| CW / Curtiss-Wright Corporation | 0.00 | 0.53 | 0.2215 | 0.2215 | |||||
| GWW / W.W. Grainger, Inc. | 0.00 | 43.77 | 0.52 | 51.47 | 0.2150 | 0.0103 | |||
| EFX / Equifax Inc. | 0.00 | 29.57 | 0.51 | 37.80 | 0.2146 | -0.0096 | |||
| FERG / Ferguson Enterprises Inc. | 0.00 | 31.04 | 0.51 | 78.45 | 0.2107 | 0.0401 | |||
| TPG / TPG Inc. | 0.01 | 67.05 | 0.50 | 84.81 | 0.2082 | 0.0457 | |||
| EA / Electronic Arts Inc. | 0.00 | 104.25 | 0.49 | 125.81 | 0.2046 | 0.0739 | |||
| EXE / Expand Energy Corporation | 0.00 | 31.05 | 0.49 | 37.78 | 0.2022 | -0.0095 | |||
| MDB / MongoDB, Inc. | 0.00 | 31.01 | 0.47 | 57.09 | 0.1941 | 0.0157 | |||
| NTRS / Northern Trust Corporation | 0.00 | 31.05 | 0.45 | 68.28 | 0.1882 | 0.0271 | |||
| VEEV / Veeva Systems Inc. | 0.00 | -54.63 | 0.45 | -43.62 | 0.1881 | -0.2926 | |||
| S / SentinelOne, Inc. | 0.02 | 52.15 | 0.43 | 53.21 | 0.1789 | 0.0103 | |||
| PFG / Principal Financial Group, Inc. | 0.01 | 31.07 | 0.43 | 23.34 | 0.1786 | -0.0301 | |||
| Smurfit WestRock PLC / EC (IE00028FXN24) | 0.01 | 31.08 | 0.42 | 25.60 | 0.1740 | -0.0258 | |||
| SIGI / Selective Insurance Group, Inc. | 0.00 | 178.42 | 0.41 | 163.69 | 0.1728 | 0.0783 | |||
| EG / Everest Group, Ltd. | 0.00 | 0.41 | 0.1711 | 0.1711 | |||||
| MHK / Mohawk Industries, Inc. | 0.00 | 31.03 | 0.41 | 20.23 | 0.1710 | -0.0339 | |||
| VERX / Vertex, Inc. | 0.01 | 0.40 | 0.1664 | 0.1664 | |||||
| FTI / TechnipFMC plc | 0.01 | -4.99 | 0.40 | 3.39 | 0.1651 | -0.0654 | |||
| EXR / Extra Space Storage Inc. | 0.00 | 31.10 | 0.40 | 29.93 | 0.1650 | -0.0177 | |||
| HUM / Humana Inc. | 0.00 | 31.02 | 0.39 | 21.32 | 0.1614 | -0.0308 | |||
| AIZ / Assurant, Inc. | 0.00 | 31.09 | 0.38 | 23.47 | 0.1603 | -0.0269 | |||
| HWC / Hancock Whitney Corporation | 0.01 | 0.38 | 0.1595 | 0.1595 | |||||
| ELS / Equity LifeStyle Properties, Inc. | 0.01 | 0.38 | 0.1588 | 0.1588 | |||||
| US7587501039 / Regal-Beloit Corp. | 0.00 | 31.04 | 0.38 | 66.52 | 0.1579 | 0.0215 | |||
| EXC / Exelon Corporation | 0.01 | 31.05 | 0.37 | 23.67 | 0.1548 | -0.0259 | |||
| HIW / Highwoods Properties, Inc. | 0.01 | 31.06 | 0.36 | 37.45 | 0.1484 | -0.0072 | |||
| XEL / Xcel Energy Inc. | 0.01 | -15.12 | 0.35 | -18.37 | 0.1466 | -0.1122 | |||
| PR / Permian Resources Corporation | 0.03 | 31.06 | 0.34 | 29.17 | 0.1422 | -0.0168 | |||
| JBHT / J.B. Hunt Transport Services, Inc. | 0.00 | 7.55 | 0.34 | 4.33 | 0.1406 | -0.0535 | |||
| EMN / Eastman Chemical Company | 0.00 | 31.04 | 0.33 | 11.07 | 0.1383 | -0.0412 | |||
| Viking Holdings Ltd / EC (BMG93A5A1010) | 0.01 | 168.21 | 0.32 | 260.00 | 0.1351 | 0.0809 | |||
| PPBI / Pacific Premier Bancorp, Inc. | 0.02 | 143.75 | 0.32 | 141.35 | 0.1341 | 0.0539 | |||
| HAS / Hasbro, Inc. | 0.00 | 31.06 | 0.31 | 57.95 | 0.1284 | 0.0108 | |||
| ODFL / Old Dominion Freight Line, Inc. | 0.00 | 0.30 | 0.1234 | 0.1234 | |||||
| STZ / Constellation Brands, Inc. | 0.00 | 31.02 | 0.29 | 16.40 | 0.1214 | -0.0293 | |||
| DKNG / DraftKings Inc. | 0.01 | 31.07 | 0.29 | 69.59 | 0.1210 | 0.0179 | |||
| BFAM / Bright Horizons Family Solutions Inc. | 0.00 | 31.06 | 0.29 | 27.56 | 0.1198 | -0.0156 | |||
| PSX / Phillips 66 | 0.00 | 31.03 | 0.29 | 26.99 | 0.1197 | -0.0166 | |||
| VLO / Valero Energy Corporation | 0.00 | 31.08 | 0.29 | 33.02 | 0.1195 | -0.0096 | |||
| EVRG / Evergy, Inc. | 0.00 | 31.07 | 0.28 | 31.02 | 0.1180 | -0.0118 | |||
| LOPE / Grand Canyon Education, Inc. | 0.00 | -15.70 | 0.28 | -7.87 | 0.1171 | -0.0662 | |||
| FSLR / First Solar, Inc. | 0.00 | 0.27 | 0.1110 | 0.1110 | |||||
| OMC / Omnicom Group Inc. | 0.00 | 31.07 | 0.26 | 13.79 | 0.1100 | -0.0294 | |||
| EXAS / Exact Sciences Corporation | 0.00 | 0.25 | 0.1024 | 0.1024 | |||||
| SARO / StandardAero, Inc. | 0.01 | 31.07 | 0.24 | 56.58 | 0.0993 | 0.0074 | |||
| ONTO / Onto Innovation Inc. | 0.00 | 31.06 | 0.21 | 8.72 | 0.0888 | -0.0286 | |||
| DD / DuPont de Nemours, Inc. | 0.00 | -17.37 | 0.20 | -24.25 | 0.0849 | -0.0763 | |||
| TJX / The TJX Companies, Inc. | 0.00 | -31.44 | 0.19 | -29.92 | 0.0772 | -0.0691 | |||
| FLEX / Flex Ltd. | 0.00 | 0.17 | 0.0727 | 0.0727 | |||||
| MTSI / MACOM Technology Solutions Holdings, Inc. | 0.00 | 31.09 | 0.15 | 86.59 | 0.0640 | 0.0147 | |||
| BC / Brunswick Corporation | 0.00 | 31.05 | 0.15 | 34.26 | 0.0607 | -0.0044 | |||
| VFC / V.F. Corporation | 0.01 | 31.06 | 0.12 | -0.86 | 0.0482 | -0.0218 | |||
| AXS / AXIS Capital Holdings Limited | 0.00 | -100.00 | 0.00 | -100.00 | -0.1062 | ||||
| THRY / Thryv Holdings, Inc. | 0.00 | -100.00 | 0.00 | -100.00 | -0.0706 | ||||
| NWL / Newell Brands Inc. | 0.00 | -100.00 | 0.00 | -100.00 | -0.0670 | ||||
| PEGA / Pegasystems Inc. | 0.00 | -100.00 | 0.00 | -100.00 | -0.1947 | ||||
| FLOC / Flowco Holdings Inc. | 0.00 | -100.00 | 0.00 | -100.00 | -0.0007 |