Mga Batayang Estadistika
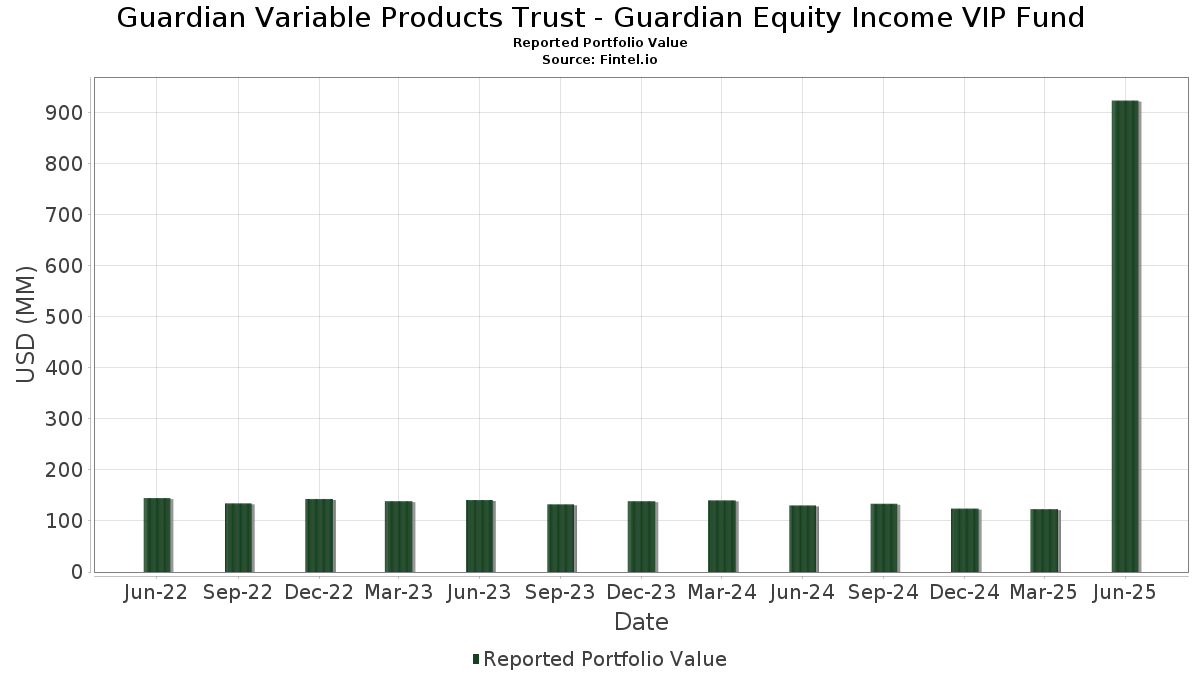
| Nilai Portofolio | $ 923,543,294 |
| Posisi Saat Ini | 71 |
Kepemilikan Terbaru, Kinerja, AUM (dari 13F, 13D)
Guardian Variable Products Trust - Guardian Equity Income VIP Fund telah mengungkapkan total kepemilikan 71 dalam pengajuan SEC terbaru mereka. Nilai portofolio terbaru dihitung sebesar $ 923,543,294 USD. Aset yang Dikelola (AUM) sebenarnya adalah nilai ini ditambah kas (yang tidak diungkapkan). Aset-aset utama Guardian Variable Products Trust - Guardian Equity Income VIP Fund adalah Bank of America Corporation (US:BAC) , Johnson & Johnson (US:JNJ) , JPMorgan Chase & Co. (US:JPM) , UnitedHealth Group Incorporated (US:UNH) , and ConocoPhillips (US:COP) . Posisi baru Guardian Variable Products Trust - Guardian Equity Income VIP Fund meliputi: Avery Dennison Corporation (US:AVY) , Darden Restaurants, Inc. (US:DRI) , NetApp, Inc. (US:NTAP) , Ferguson Enterprises Inc. (US:FERG) , and .
Peningkatan Tertinggi Kuartal Ini
Kami menggunakan perubahan dalam alokasi portofolio karena ini adalah metrik yang paling bermakna. Perubahan dapat disebabkan oleh perdagangan atau perubahan harga saham.
| Keamanan | Saham (MM) |
Nilai (Juta Dolar AS) |
Portfolio % | ΔPorsyento ng Portfolio |
|---|---|---|---|---|
| 0.06 | 11.39 | 1.2279 | 1.2279 | |
| 0.32 | 9.43 | 1.0174 | 1.0174 | |
| 0.04 | 9.24 | 0.9962 | 0.9962 | |
| 0.08 | 8.58 | 0.9251 | 0.9251 | |
| 0.04 | 8.57 | 0.9236 | 0.9236 | |
| 7.81 | 0.8418 | 0.8418 | ||
| 0.13 | 13.16 | 1.4191 | 0.8329 | |
| 0.26 | 14.63 | 1.5780 | 0.4747 | |
| 0.61 | 28.92 | 3.1185 | 0.3906 | |
| 0.28 | 16.83 | 1.8145 | 0.3526 |
Penurunan Tertinggi Kuartal Ini
Kami menggunakan perubahan dalam alokasi portofolio karena ini adalah metrik yang paling bermakna. Perubahan dapat disebabkan oleh perdagangan atau perubahan harga saham.
| Keamanan | Saham (MM) |
Nilai (Juta Dolar AS) |
Portfolio % | ΔPorsyento ng Portfolio |
|---|---|---|---|---|
| 0.07 | 22.78 | 2.4566 | -1.0219 | |
| 0.24 | 21.63 | 2.3330 | -0.6735 | |
| 0.38 | 7.90 | 0.8518 | -0.4256 | |
| 0.57 | 13.71 | 1.4786 | -0.3854 | |
| 0.03 | 13.59 | 1.4651 | -0.3815 | |
| 0.04 | 8.72 | 0.9404 | -0.3215 | |
| 0.11 | 9.23 | 0.9952 | -0.2607 | |
| 0.04 | 2.28 | 0.2453 | -0.2498 | |
| 0.20 | 13.69 | 1.4765 | -0.2475 | |
| 0.37 | 12.41 | 1.3386 | -0.2089 |
Pengajuan 13F dan Dana
Formulir ini diajukan pada 2025-08-15 untuk periode pelaporan 2025-06-30. Klik ikon tautan untuk melihat riwayat transaksi selengkapnya.
Tingkatkan ke versi premium untuk membuka data premium dan ekspor ke Excel. ![]() .
.
| Keamanan | Ketik | Harga Saham Rata-rata | Saham (MM) |
ΔSaham (%) |
ΔSaham (%) |
Nilai ($MM) |
Portpolyo (%) |
ΔPortofolio (%) |
|
|---|---|---|---|---|---|---|---|---|---|
| BAC / Bank of America Corporation | 0.61 | 658.31 | 28.92 | 759.89 | 3.1185 | 0.3906 | |||
| JNJ / Johnson & Johnson | 0.16 | 661.64 | 24.73 | 601.62 | 2.6671 | -0.1925 | |||
| JPM / JPMorgan Chase & Co. | 0.08 | 502.38 | 24.36 | 612.10 | 2.6271 | -0.1485 | |||
| UNH / UnitedHealth Group Incorporated | 0.07 | 791.82 | 22.78 | 431.25 | 2.4566 | -1.0219 | |||
| COP / ConocoPhillips | 0.24 | 583.07 | 21.63 | 483.76 | 2.3330 | -0.6735 | |||
| MRK / Merck & Co., Inc. | 0.26 | 831.86 | 20.74 | 721.92 | 2.2362 | 0.1895 | |||
| PCAR / PACCAR Inc | 0.20 | 747.03 | 18.59 | 727.24 | 2.0045 | 0.1812 | |||
| AIG / American International Group, Inc. | 0.21 | 632.58 | 18.40 | 621.32 | 1.9844 | -0.0852 | |||
| GILD / Gilead Sciences, Inc. | 0.16 | 695.91 | 17.27 | 687.69 | 1.8628 | 0.0836 | |||
| UL / Unilever PLC - Depositary Receipt (Common Stock) | 0.28 | 808.88 | 16.83 | 833.74 | 1.8145 | 0.3526 | |||
| LHX / L3Harris Technologies, Inc. | 0.07 | 657.52 | 16.80 | 808.16 | 1.8118 | 0.3106 | |||
| MS / Morgan Stanley | 0.12 | 609.41 | 16.69 | 756.78 | 1.7999 | 0.2192 | |||
| GLPI / Gaming and Leisure Properties, Inc. | 0.35 | 667.98 | 16.45 | 604.32 | 1.7743 | -0.1206 | |||
| CCI / Crown Castle Inc. | 0.16 | 662.97 | 16.33 | 651.96 | 1.7605 | -0.0004 | |||
| EMR / Emerson Electric Co. | 0.12 | 669.73 | 16.12 | 836.43 | 1.7380 | 0.3414 | |||
| SRE / Sempra | 0.21 | 687.33 | 15.79 | 736.05 | 1.7031 | 0.1708 | |||
| HON / Honeywell International Inc. | 0.07 | 715.41 | 15.64 | 797.25 | 1.6865 | 0.2720 | |||
| EQT / EQT Corporation | 0.27 | 563.84 | 15.59 | 624.64 | 1.6809 | -0.0640 | |||
| ADM / Archer-Daniels-Midland Company | 0.29 | 662.36 | 15.32 | 738.48 | 1.6520 | 0.1694 | |||
| CTRA / Coterra Energy Inc. | 0.60 | 662.42 | 15.22 | 569.69 | 1.6415 | -0.2025 | |||
| AEP / American Electric Power Company, Inc. | 0.14 | 602.10 | 14.64 | 566.97 | 1.5787 | -0.2024 | |||
| D / Dominion Energy, Inc. | 0.26 | 967.27 | 14.63 | 975.88 | 1.5780 | 0.4747 | |||
| PM / Philip Morris International Inc. | 0.08 | 665.24 | 14.22 | 778.38 | 1.5336 | 0.2199 | |||
| NDAQ / Nasdaq, Inc. | 0.16 | 658.86 | 14.16 | 794.76 | 1.5275 | 0.2431 | |||
| NXPI / NXP Semiconductors N.V. | 0.06 | 637.20 | 14.01 | 747.94 | 1.5106 | 0.1699 | |||
| PFE / Pfizer Inc. | 0.57 | 523.74 | 13.71 | 496.65 | 1.4786 | -0.3854 | |||
| CSCO / Cisco Systems, Inc. | 0.20 | 472.97 | 13.69 | 544.28 | 1.4765 | -0.2475 | |||
| MTB / M&T Bank Corporation | 0.07 | 682.05 | 13.62 | 749.19 | 1.4690 | 0.1671 | |||
| ELV / Elevance Health, Inc. | 0.03 | 567.37 | 13.59 | 496.92 | 1.4651 | -0.3815 | |||
| TE Connectivity PLC / EC (IE000IVNQZ81) | 0.08 | 527.57 | 13.18 | 649.35 | 1.4215 | -0.0060 | |||
| CNI / Canadian National Railway Company | 0.13 | 1,600.55 | 13.16 | 1,722.71 | 1.4191 | 0.8329 | |||
| PPG / PPG Industries, Inc. | 0.11 | 775.52 | 13.04 | 811.25 | 1.4062 | 0.2448 | |||
| RJF / Raymond James Financial, Inc. | 0.08 | 660.58 | 12.75 | 739.86 | 1.3749 | 0.1434 | |||
| TRGP / Targa Resources Corp. | 0.07 | 596.77 | 12.47 | 842.55 | 1.3448 | 0.3300 | |||
| PPL / PPL Corporation | 0.37 | 593.24 | 12.41 | 550.92 | 1.3386 | -0.2089 | |||
| B / Barrick Mining Corporation | 0.59 | 641.48 | 12.32 | 694.33 | 1.3286 | 0.0702 | |||
| LAMR / Lamar Advertising Company | 0.10 | 711.45 | 12.25 | 765.51 | 1.3208 | 0.1730 | |||
| NOC / Northrop Grumman Corporation | 0.02 | 751.50 | 12.24 | 731.79 | 1.3204 | 0.1260 | |||
| ATO / Atmos Energy Corporation | 0.08 | 603.70 | 12.22 | 601.67 | 1.3174 | -0.0950 | |||
| DOX / Amdocs Limited | 0.13 | 659.92 | 12.14 | 658.09 | 1.3089 | 0.0097 | |||
| KDP / Keurig Dr Pepper Inc. | 0.37 | 679.50 | 12.10 | 653.08 | 1.3051 | 0.0016 | |||
| ACN / Accenture plc | 0.04 | 735.32 | 11.45 | 700.07 | 1.2347 | 0.0740 | |||
| RI / Pernod Ricard SA | 0.11 | 671.81 | 11.41 | 676.39 | 1.2308 | 0.0380 | |||
| AVY / Avery Dennison Corporation | 0.06 | 11.39 | 1.2279 | 1.2279 | |||||
| AVGO / Broadcom Inc. | 0.04 | 486.06 | 11.35 | 865.39 | 1.2243 | 0.2699 | |||
| RF / Regions Financial Corporation | 0.48 | 724.99 | 11.18 | 792.97 | 1.2057 | 0.1901 | |||
| AZN / AstraZeneca PLC - Depositary Receipt (Common Stock) | 0.16 | 765.33 | 11.17 | 722.99 | 1.2044 | 0.1033 | |||
| WY / Weyerhaeuser Company | 0.43 | 652.52 | 10.98 | 560.31 | 1.1842 | -0.1649 | |||
| ICE / Intercontinental Exchange, Inc. | 0.06 | 575.75 | 10.46 | 618.97 | 1.1281 | -0.0525 | |||
| JCI / Johnson Controls International plc | 0.10 | 489.19 | 10.24 | 677.24 | 1.1047 | 0.0350 | |||
| ROG / Roche Holding AG | 0.03 | 701.97 | 10.00 | 697.77 | 1.0789 | 0.0611 | |||
| STZ / Constellation Brands, Inc. | 0.06 | 1,059.94 | 9.84 | 928.63 | 1.0616 | 0.2850 | |||
| AAL / Anglo American plc | 0.32 | 9.43 | 1.0174 | 1.0174 | |||||
| DRI / Darden Restaurants, Inc. | 0.04 | 9.24 | 0.9962 | 0.9962 | |||||
| MET / MetLife, Inc. | 0.11 | 495.09 | 9.23 | 496.12 | 0.9952 | -0.2607 | |||
| MMC / Marsh & McLennan Companies, Inc. | 0.04 | 1,031.33 | 9.22 | 914.41 | 0.9944 | 0.2565 | |||
| WEC / WEC Energy Group, Inc. | 0.09 | 673.40 | 9.22 | 639.97 | 0.9943 | -0.0171 | |||
| ARES / Ares Management Corporation | 0.05 | 454.57 | 9.22 | 555.22 | 0.9942 | -0.1472 | |||
| TSCO / Tractor Supply Company | 0.17 | 592.37 | 9.17 | 563.17 | 0.9884 | -0.1328 | |||
| MPC / Marathon Petroleum Corporation | 0.05 | 498.95 | 9.07 | 583.20 | 0.9777 | -0.0992 | |||
| IEX / IDEX Corporation | 0.05 | 761.04 | 8.97 | 735.69 | 0.9670 | 0.0963 | |||
| TMUS / T-Mobile US, Inc. | 0.04 | 527.48 | 8.72 | 460.77 | 0.9404 | -0.3215 | |||
| NTAP / NetApp, Inc. | 0.08 | 8.58 | 0.9251 | 0.9251 | |||||
| FERG / Ferguson Enterprises Inc. | 0.04 | 8.57 | 0.9236 | 0.9236 | |||||
| IDEXY / Industria de Diseño Textil, S.A. - Depositary Receipt (Common Stock) | 0.16 | 942.21 | 8.16 | 989.72 | 0.8802 | 0.2721 | |||
| KVUE / Kenvue Inc. | 0.38 | 474.68 | 7.90 | 401.84 | 0.8518 | -0.4256 | |||
| FP / TotalEnergies SE | 0.13 | 573.86 | 7.83 | 541.52 | 0.8448 | -0.1461 | |||
| FIXED INC CLEARING CORP.REPO / RA (000000000) | 7.81 | 0.8418 | 0.8418 | ||||||
| NKE / NIKE, Inc. | 0.10 | 603.34 | 7.23 | 687.58 | 0.7798 | 0.0346 | |||
| IDEXY / Industria de Diseño Textil, S.A. - Depositary Receipt (Common Stock) | 0.26 | 1,352.46 | 3.45 | 658.46 | 0.3722 | 0.0030 | |||
| FBHS / Fortune Brands Home & Security Inc | 0.04 | 340.75 | 2.28 | 272.95 | 0.2453 | -0.2498 |