Mga Batayang Estadistika
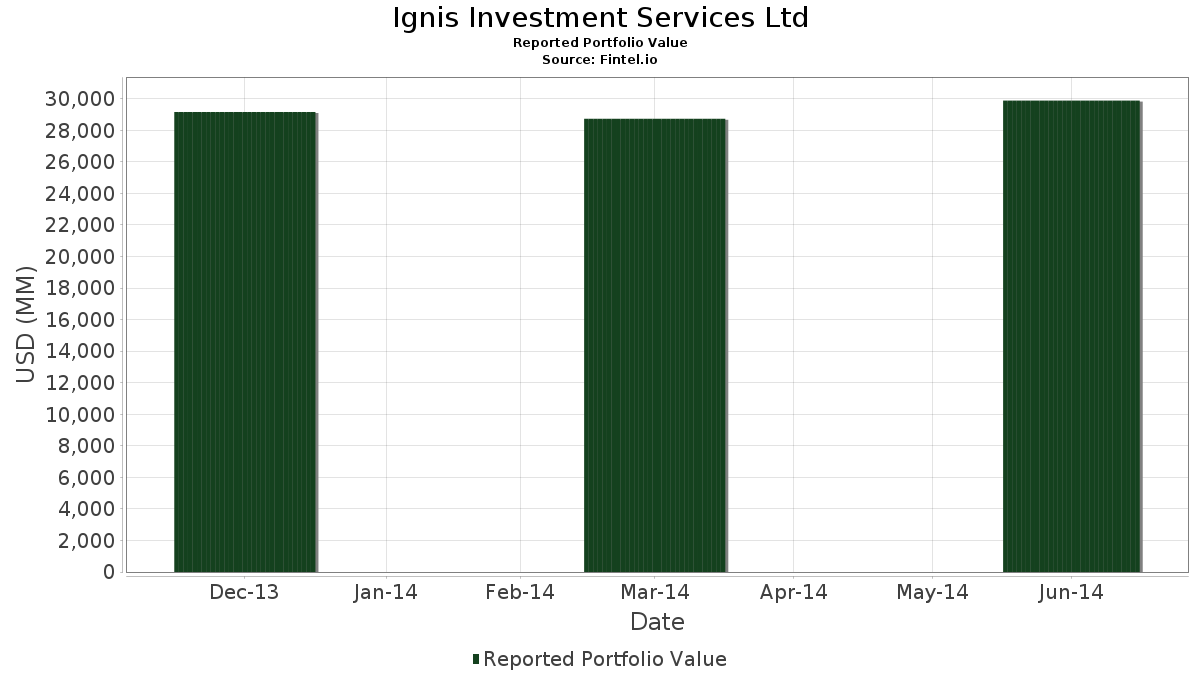
| Nilai Portofolio | $ 29,881,197,000 |
| Posisi Saat Ini | 93 |
Kepemilikan Terbaru, Kinerja, AUM (dari 13F, 13D)
Ignis Investment Services Ltd telah mengungkapkan total kepemilikan 93 dalam pengajuan SEC terbaru mereka. Nilai portofolio terbaru dihitung sebesar $ 29,881,197,000 USD. Aset yang Dikelola (AUM) sebenarnya adalah nilai ini ditambah kas (yang tidak diungkapkan). Aset-aset utama Ignis Investment Services Ltd adalah JPMorgan Chase & Co. (US:JPM) , Apple Inc. (US:AAPL) , The Walt Disney Company (US:DIS) , Union Pacific Corporation (US:UNP) , and Actavis (US:G0083B108) . Posisi baru Ignis Investment Services Ltd meliputi: Anadarko Petroleum Corp. (US:US0325111070) , Schlumberger Limited (US:SLB) , Alphabet Inc. (US:GOOG) , NRG Energy, Inc. (US:NRG) , and Capital One Financial Corporation (US:COF) .
Peningkatan Tertinggi Kuartal Ini
Kami menggunakan perubahan dalam alokasi portofolio karena ini adalah metrik yang paling bermakna. Perubahan dapat disebabkan oleh perdagangan atau perubahan harga saham.
| Keamanan | Saham (MM) |
Nilai (Juta Dolar AS) |
Portfolio % | ΔPorsyento ng Portfolio |
|---|---|---|---|---|
| 0.57 | 543.79 | 1.8198 | 1.8198 | |
| 0.43 | 475.85 | 1.5925 | 1.5925 | |
| 1.09 | 459.51 | 1.5378 | 1.5378 | |
| 0.37 | 432.59 | 1.4477 | 1.4477 | |
| 0.07 | 406.32 | 1.3598 | 1.3598 | |
| 0.70 | 361.70 | 1.2104 | 1.2104 | |
| 3.14 | 334.64 | 1.1199 | 1.1199 | |
| 0.12 | 329.74 | 1.1035 | 1.1035 | |
| 0.97 | 324.23 | 1.0851 | 1.0851 | |
| 1.96 | 484.26 | 1.6206 | 0.9872 |
Penurunan Tertinggi Kuartal Ini
Kami menggunakan perubahan dalam alokasi portofolio karena ini adalah metrik yang paling bermakna. Perubahan dapat disebabkan oleh perdagangan atau perubahan harga saham.
| Keamanan | Saham (MM) |
Nilai (Juta Dolar AS) |
Portfolio % | ΔPorsyento ng Portfolio |
|---|---|---|---|---|
| 0.07 | 412.72 | 1.3812 | -1.3664 | |
| 0.00 | 0.00 | -1.3588 | ||
| 0.00 | 0.00 | -1.1830 | ||
| 0.00 | 0.00 | -1.1437 | ||
| 0.95 | 545.57 | 1.8258 | -1.0768 | |
| 0.00 | 0.00 | -0.9549 | ||
| 0.08 | 31.91 | 0.1068 | -0.8615 | |
| 0.32 | 265.24 | 0.8877 | -0.8213 | |
| 0.00 | 0.00 | -0.8079 | ||
| 0.00 | 0.00 | -0.5793 |
Pengajuan 13F dan Dana
Formulir ini diajukan pada 2014-08-15 untuk periode pelaporan 2014-06-30. Klik ikon tautan untuk melihat riwayat transaksi selengkapnya.
Tingkatkan ke versi premium untuk membuka data premium dan ekspor ke Excel. ![]() .
.
| Keamanan | Ketik | Harga Saham Rata-rata | Saham (MM) |
ΔSaham (%) |
ΔSaham (%) |
Nilai ($MM) |
Portpolyo (%) |
ΔPortofolio (%) |
|
|---|---|---|---|---|---|---|---|---|---|
| JPM / JPMorgan Chase & Co. | 1.64 | 16.12 | 942.06 | 11.27 | 3.1527 | 0.2056 | |||
| AAPL / Apple Inc. | 0.98 | 630.44 | 904.82 | 25.15 | 3.0281 | 0.5114 | |||
| DIS / The Walt Disney Company | 0.91 | 36.35 | 772.17 | 47.24 | 2.5841 | 0.7586 | |||
| UNP / Union Pacific Corporation | 0.70 | 58.10 | 700.95 | -14.73 | 2.3458 | -0.5157 | |||
| G0083B108 / Actavis | 0.30 | 54.83 | 672.75 | 69.64 | 2.2514 | 0.8710 | |||
| XOM / Exxon Mobil Corporation | 0.65 | 0.00 | 662.23 | 3.59 | 2.2162 | -0.0090 | |||
| AIG / American International Group, Inc. | 1.20 | 0.00 | 657.38 | 9.48 | 2.2000 | 0.1099 | |||
| VZ / Verizon Communications Inc. | 1.31 | -2.89 | 644.54 | 1.00 | 2.1570 | -0.0644 | |||
| WFC / Wells Fargo & Company | 1.16 | 0.97 | 614.58 | 8.37 | 2.0567 | 0.0827 | |||
| HD / The Home Depot, Inc. | 0.72 | 26.63 | 581.06 | 30.51 | 1.9446 | 0.3948 | |||
| MRK / Merck & Co., Inc. | 0.95 | -36.34 | 545.57 | -34.57 | 1.8258 | -1.0768 | |||
| AXP / American Express Company | 0.57 | 0.00 | 543.79 | 1.8198 | 1.8198 | ||||
| CSCO / Cisco Systems, Inc. | 1.96 | 140.58 | 484.26 | 166.12 | 1.6206 | 0.9872 | |||
| US0325111070 / Anadarko Petroleum Corp. | 0.43 | 475.85 | 1.5925 | 1.5925 | |||||
| ADBE / Adobe Inc. | 0.66 | 57.41 | 472.23 | 74.68 | 1.5804 | 0.6393 | |||
| MSFT / Microsoft Corporation | 1.09 | -17.46 | 459.51 | -13.47 | 1.5378 | 1.5378 | |||
| INTC / Intel Corporation | 1.43 | -0.03 | 441.73 | 20.69 | 1.4783 | 0.2042 | |||
| HAL / Halliburton Company | 0.62 | 23.86 | 439.09 | 46.79 | 1.4695 | 0.4282 | |||
| BKNG / Booking Holdings Inc. | 0.04 | 0.00 | 436.46 | 1.13 | 1.4607 | -0.0416 | |||
| SLB / Schlumberger Limited | 0.37 | 432.59 | 1.4477 | 1.4477 | |||||
| PRU / Prudential Financial, Inc. | 0.49 | 0.00 | 431.97 | 6.46 | 1.4456 | 0.0332 | |||
| RAI / Reynolds American, Inc. | 0.70 | 48.46 | 425.47 | 69.30 | 1.4239 | 0.5491 | |||
| WMB / The Williams Companies, Inc. | 0.73 | -26.08 | 424.85 | 5.78 | 1.4218 | 0.0238 | |||
| GILD / Gilead Sciences, Inc. | 0.51 | -0.50 | 421.86 | 20.39 | 1.4118 | 0.1921 | |||
| US2782651036 / Eaton Vance Corp. | 0.54 | 22.06 | 417.11 | 27.04 | 1.3959 | 0.2530 | |||
| HCA / HCA Healthcare, Inc. | 0.75 | 27.63 | 413.16 | 38.34 | 1.3827 | 0.3431 | |||
| GOOGL / Alphabet Inc. | 0.07 | 0.00 | 412.72 | -47.71 | 1.3812 | -1.3664 | |||
| GOOG / Alphabet Inc. | 0.07 | 406.32 | 1.3598 | 1.3598 | |||||
| CVS / CVS Health Corporation | 0.53 | 0.00 | 403.65 | 1.97 | 1.3509 | -0.0271 | |||
| ZBH / Zimmer Biomet Holdings, Inc. | 0.38 | 111.04 | 399.12 | 135.00 | 1.3357 | 0.7445 | |||
| REGN / Regeneron Pharmaceuticals, Inc. | 0.13 | 36.66 | 364.63 | 26.27 | 1.2203 | 0.2151 | |||
| DOW / Dow Inc. | 0.70 | 0.00 | 361.70 | 7.07 | 1.2104 | 1.2104 | |||
| MU / Micron Technology, Inc. | 1.14 | 0.00 | 359.88 | 43.82 | 1.2044 | 0.3333 | |||
| GRMN / Garmin Ltd. | 0.59 | 0.00 | 358.81 | 9.03 | 1.2008 | 0.0553 | |||
| AME / AMETEK, Inc. | 0.66 | 0.00 | 347.59 | 3.10 | 1.1632 | -0.0103 | |||
| PCP / Precision Castparts Corporation | 0.13 | -17.75 | 336.53 | -15.50 | 1.1262 | -0.2601 | |||
| EL / The Estée Lauder Companies Inc. | 0.45 | 38.20 | 334.85 | 54.73 | 1.1206 | 0.3673 | |||
| RF / Regions Financial Corporation | 3.14 | 0.00 | 334.64 | -2.56 | 1.1199 | 1.1199 | |||
| LYB / LyondellBasell Industries N.V. | 0.34 | 0.00 | 333.68 | 9.61 | 1.1167 | 0.0570 | |||
| ADS / Bread Financial Holdings Inc | 0.12 | 0.00 | 329.74 | 2.80 | 1.1035 | 1.1035 | |||
| BX / Blackstone Inc. | 0.97 | 0.00 | 324.23 | 1.0851 | 1.0851 | ||||
| STJ / St. Jude Medical, Inc. | 0.45 | 0.00 | 313.83 | 7.35 | 1.0502 | 0.0326 | |||
| NXPI / NXP Semiconductors N.V. | 0.47 | 0.00 | 305.67 | 12.75 | 1.0229 | 0.0793 | |||
| PCAR / PACCAR Inc | 0.48 | 0.00 | 304.53 | -5.50 | 1.0191 | -0.1026 | |||
| NRG / NRG Energy, Inc. | 0.79 | 293.42 | 0.9820 | 0.9820 | |||||
| STZ / Constellation Brands, Inc. | 0.33 | 0.00 | 291.60 | 5.73 | 0.9758 | 0.0159 | |||
| HAR / Harman International Industries, Inc. | 0.27 | 0.00 | 287.79 | 0.9631 | 0.9631 | ||||
| COF / Capital One Financial Corporation | 0.34 | 285.34 | 0.9549 | 0.9549 | |||||
| US20605P1012 / Concho Resources, Inc. | 0.20 | 284.93 | 0.9535 | 0.9535 | |||||
| SBUX / Starbucks Corporation | 0.36 | 0.00 | 284.35 | 0.9516 | 0.9516 | ||||
| AAP / Advance Auto Parts, Inc. | 0.21 | -4.58 | 281.29 | 2.18 | 0.9413 | -0.0169 | |||
| META / Meta Platforms, Inc. | 0.42 | 14.33 | 280.61 | 28.79 | 0.9391 | 0.1806 | |||
| GS / The Goldman Sachs Group, Inc. | 0.17 | 0.00 | 279.76 | 2.76 | 0.9362 | -0.0114 | |||
| IVZ / Invesco Ltd. | 0.73 | 0.00 | 277.10 | 3.57 | 0.9273 | -0.0040 | |||
| CRM / Salesforce, Inc. | 0.48 | 0.00 | 273.36 | 2.92 | 0.9148 | -0.0097 | |||
| BAC / Bank of America Corporation | 1.78 | -2.96 | 272.72 | -12.39 | 0.9127 | 0.9127 | |||
| MCK / McKesson Corporation | 0.14 | -39.11 | 270.69 | -34.43 | 0.9059 | 0.9059 | |||
| UNH / UnitedHealth Group Incorporated | 0.32 | -46.23 | 265.24 | -45.98 | 0.8877 | -0.8213 | |||
| RCL / Royal Caribbean Cruises Ltd. | 0.47 | 0.00 | 264.62 | 4.22 | 0.8856 | 0.0018 | |||
| AVGO / Broadcom Inc. | 0.37 | -4.53 | 262.26 | 5.64 | 0.8777 | 0.0135 | |||
| SBNY / Signature Bank | 0.21 | 10.49 | 260.48 | 13.57 | 0.8717 | 0.0734 | |||
| C / Citigroup Inc. | 0.53 | 0.00 | 250.58 | -0.23 | 0.8386 | 0.8386 | |||
| CB / Chubb Limited | 0.24 | 0.00 | 245.02 | 5.62 | 0.8200 | 0.0125 | |||
| FRC / First Republic Bank | 0.44 | 0.00 | 241.73 | 1.43 | 0.8090 | -0.0206 | |||
| XLNX / Xilinx, Inc. | 0.48 | -6.16 | 226.52 | -18.24 | 0.7581 | 0.7581 | |||
| FL / Foot Locker, Inc. | 0.44 | 0.00 | 222.41 | 9.73 | 0.7443 | 0.0388 | |||
| HPQ / HP Inc. | 0.65 | -12.13 | 220.51 | -7.00 | 0.7380 | 0.7380 | |||
| MET / MetLife, Inc. | 0.38 | 0.00 | 210.48 | 5.69 | 0.7044 | 0.0112 | |||
| HAIN / The Hain Celestial Group, Inc. | 0.24 | -19.49 | 203.91 | -22.65 | 0.6824 | -0.2352 | |||
| CBRE / CBRE Group, Inc. | 0.63 | -17.26 | 201.66 | -1.42 | 0.6749 | 0.6749 | |||
| INCY / Incyte Corporation | 0.35 | 196.07 | 0.6562 | 0.6562 | |||||
| SIVB / SVB Financial Group | 0.17 | 36.54 | 194.21 | 25.67 | 0.6499 | 0.1120 | |||
| AR / Antero Resources Corporation | 0.29 | 0.00 | 188.13 | 1.20 | 0.6296 | -0.0175 | |||
| MHK / Mohawk Industries, Inc. | 0.14 | -29.74 | 187.12 | -28.62 | 0.6262 | -0.2862 | |||
| MA / Mastercard Incorporated | 0.25 | -45.71 | 184.00 | -45.58 | 0.6158 | -0.5611 | |||
| CTXS / Citrix Systems, Inc. | 0.27 | 0.00 | 176.08 | 11.71 | 0.5893 | 0.0406 | |||
| RAD / Rite Aid Corp. | 2.18 | 5.88 | 156.71 | 18.23 | 0.5244 | 0.0630 | |||
| F / Ford Motor Company | 0.89 | 0.00 | 154.22 | 0.5161 | 0.5161 | ||||
| MLM / Martin Marietta Materials, Inc. | 0.11 | 148.97 | 0.4986 | 0.4986 | |||||
| ORCL / Oracle Corporation | 0.32 | -27.53 | 128.35 | -25.77 | 0.4295 | 0.4295 | |||
| PG / The Procter & Gamble Company | 0.16 | -59.35 | 123.75 | -59.72 | 0.4141 | 0.4141 | |||
| IBM / International Business Machines Corporation | 0.06 | 0.00 | 114.26 | -4.59 | 0.3824 | 0.3824 | |||
| TCBI / Texas Capital Bancshares, Inc. | 0.20 | 32.70 | 105.71 | 11.38 | 0.3538 | 0.0234 | |||
| T / AT&T Inc. | 0.25 | 88.02 | 0.2946 | 0.2946 | |||||
| BAP / Credicorp Ltd. | 0.04 | 0.00 | 55.83 | 0.00 | 0.1868 | 0.1868 | |||
| NVO / Novo Nordisk A/S - Depositary Receipt (Common Stock) | 0.12 | -27.72 | 54.76 | -26.58 | 0.1832 | 0.1832 | |||
| CIEN / Ciena Corporation | 0.16 | 51.73 | 34.57 | 46.82 | 0.1157 | 0.0337 | |||
| DAL / Delta Air Lines, Inc. | 0.08 | -90.22 | 31.91 | -88.53 | 0.1068 | -0.8615 | |||
| CSGP / CoStar Group, Inc. | 0.02 | 29.28 | 0.0980 | 0.0980 | |||||
| EVHC / Envision Healthcare Holdings, Inc. | 0.05 | 22.84 | 0.0764 | 0.0764 | |||||
| CVX / Chevron Corporation | 0.01 | 0.00 | 13.02 | 10.01 | 0.0436 | 0.0024 | |||
| SCCO / Southern Copper Corporation | 0.01 | 0.00 | 4.86 | 0.0163 | 0.0163 | ||||
| RGORF / Randgold Resources Ltd. | 0.00 | 0.00 | 0.00 | 0.00 | 0.0000 | 0.0000 | |||
| AMP / Ameriprise Financial, Inc. | 0.00 | -100.00 | 0.00 | -100.00 | 0.0000 | 0.0000 | |||
| LO / | 0.00 | -100.00 | 0.00 | -100.00 | -0.5793 | ||||
| MPC / Marathon Petroleum Corporation | 0.00 | -100.00 | 0.00 | -100.00 | -0.9549 | ||||
| MAS / Masco Corporation | 0.00 | -100.00 | 0.00 | -100.00 | -0.2737 | ||||
| JAH / Jarden Corporation | 0.00 | -100.00 | 0.00 | -100.00 | 0.0000 | 0.0000 | |||
| ICE / Intercontinental Exchange, Inc. | 0.00 | -100.00 | 0.00 | -100.00 | 0.0000 | 0.0000 | |||
| OXY / Occidental Petroleum Corporation | 0.00 | -100.00 | 0.00 | -100.00 | -1.1437 | ||||
| PFE / Pfizer Inc. | 0.00 | -100.00 | 0.00 | -100.00 | 0.0000 | 0.0000 | |||
| ROC / ROC Energy Acquisition Corp | 0.00 | -100.00 | 0.00 | -100.00 | 0.0000 | 0.0000 | |||
| DHR / Danaher Corporation | 0.00 | -100.00 | 0.00 | -100.00 | -1.3588 | ||||
| TEX / Terex Corporation | 0.00 | -100.00 | 0.00 | -100.00 | 0.0000 | 0.0000 | |||
| 891894107 / Towers Watson & Co. | 0.00 | -100.00 | 0.00 | -100.00 | 0.0000 | 0.0000 | |||
| UAL / United Airlines Holdings, Inc. | 0.00 | -100.00 | 0.00 | -100.00 | -0.0426 | ||||
| V / Visa Inc. | 0.00 | -100.00 | 0.00 | -100.00 | -1.1830 | ||||
| COG / Cabot Oil & Gas Corp. | 0.00 | -100.00 | 0.00 | -100.00 | 0.0000 | 0.0000 | |||
| ACN / Accenture plc | 0.00 | -100.00 | 0.00 | -100.00 | -0.8079 | ||||
| NCLH / Norwegian Cruise Line Holdings Ltd. | 0.00 | -100.00 | 0.00 | -100.00 | 0.0000 | 0.0000 | |||
| LLY / Eli Lilly and Company | 0.00 | -100.00 | 0.00 | -100.00 | 0.0000 | 0.0000 |