Mga Batayang Estadistika
| Nilai Portofolio | $ 2,528,268,037 |
| Posisi Saat Ini | 50 |
Kepemilikan Terbaru, Kinerja, AUM (dari 13F, 13D)
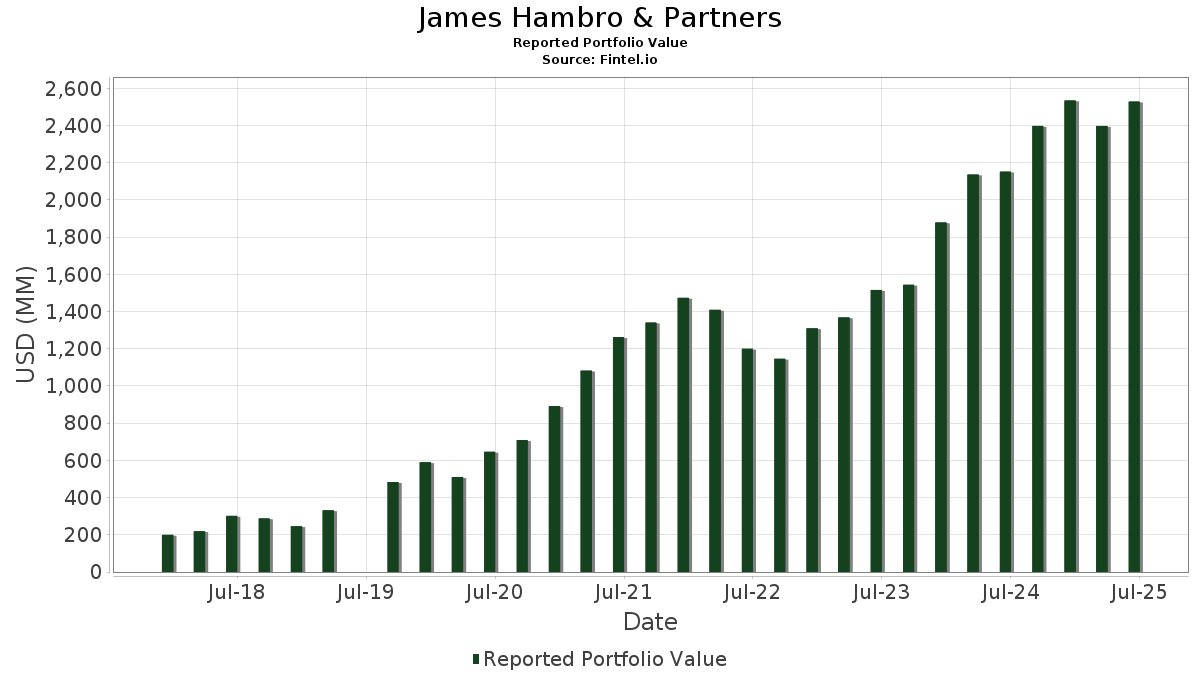
James Hambro & Partners telah mengungkapkan total kepemilikan 50 dalam pengajuan SEC terbaru mereka. Nilai portofolio terbaru dihitung sebesar $ 2,528,268,037 USD. Aset yang Dikelola (AUM) sebenarnya adalah nilai ini ditambah kas (yang tidak diungkapkan). Aset-aset utama James Hambro & Partners adalah JPMorgan Chase & Co. (US:JPM) , Amphenol Corporation (US:APH) , Microsoft Corporation (US:MSFT) , Visa Inc. (US:V) , and Alphabet Inc. (US:GOOGL) .
Peningkatan Tertinggi Kuartal Ini
Kami menggunakan perubahan dalam alokasi portofolio karena ini adalah metrik yang paling bermakna. Perubahan dapat disebabkan oleh perdagangan atau perubahan harga saham.
| Keamanan | Saham (MM) |
Nilai (Juta Dolar AS) |
Portfolio % | ΔPorsyento ng Portfolio |
|---|---|---|---|---|
| 2.01 | 198.07 | 7.8343 | 2.2179 | |
| 0.39 | 192.29 | 7.6054 | 1.7084 | |
| 0.73 | 211.38 | 8.3606 | 0.8572 | |
| 0.67 | 146.80 | 5.8064 | 0.7608 | |
| 0.21 | 109.60 | 4.3350 | 0.6773 | |
| 0.54 | 112.57 | 4.4523 | 0.6033 | |
| 0.90 | 159.31 | 6.3012 | 0.5230 | |
| 0.23 | 127.00 | 5.0234 | 0.3953 | |
| 0.79 | 145.35 | 5.7490 | 0.2043 | |
| 0.66 | 119.98 | 4.7456 | 0.1129 |
Penurunan Tertinggi Kuartal Ini
Kami menggunakan perubahan dalam alokasi portofolio karena ini adalah metrik yang paling bermakna. Perubahan dapat disebabkan oleh perdagangan atau perubahan harga saham.
| Keamanan | Saham (MM) |
Nilai (Juta Dolar AS) |
Portfolio % | ΔPorsyento ng Portfolio |
|---|---|---|---|---|
| 0.50 | 133.83 | 5.2933 | -0.7583 | |
| 0.26 | 104.30 | 4.1252 | -0.7411 | |
| 0.47 | 165.61 | 6.5505 | -0.3286 | |
| 0.29 | 57.85 | 2.2881 | -0.2396 | |
| 0.78 | 96.28 | 3.8081 | -0.1585 | |
| 0.85 | 68.76 | 2.7198 | -0.1534 | |
| 1.39 | 98.33 | 3.8894 | -0.1492 | |
| 0.40 | 91.69 | 3.6267 | -0.1471 | |
| 0.01 | 0.67 | 0.0264 | -0.0835 | |
| 0.00 | 0.00 | -0.0466 |
Pengajuan 13F dan Dana
Formulir ini diajukan pada 2025-07-17 untuk periode pelaporan 2025-06-30. Klik ikon tautan untuk melihat riwayat transaksi selengkapnya.
Tingkatkan ke versi premium untuk membuka data premium dan ekspor ke Excel. ![]() .
.
| Keamanan | Ketik | Harga Saham Rata-rata | Saham (MM) |
ΔSaham (%) |
ΔSaham (%) |
Nilai ($MM) |
Portpolyo (%) |
ΔPortofolio (%) |
|
|---|---|---|---|---|---|---|---|---|---|
| JPM / JPMorgan Chase & Co. | 0.73 | -0.54 | 211.38 | 17.50 | 8.3606 | 0.8572 | |||
| APH / Amphenol Corporation | 2.01 | -2.26 | 198.07 | 47.10 | 7.8343 | 2.2179 | |||
| MSFT / Microsoft Corporation | 0.39 | 2.54 | 192.29 | 36.01 | 7.6054 | 1.7084 | |||
| V / Visa Inc. | 0.47 | -0.83 | 165.61 | 0.42 | 6.5505 | -0.3286 | |||
| GOOGL / Alphabet Inc. | 0.90 | 1.24 | 159.31 | 15.00 | 6.3012 | 0.5230 | |||
| AMZN / Amazon.com, Inc. | 0.67 | 5.26 | 146.80 | 21.36 | 5.8064 | 0.7608 | |||
| ICE / Intercontinental Exchange, Inc. | 0.79 | 2.87 | 145.35 | 9.34 | 5.7490 | 0.2043 | |||
| PGR / The Progressive Corporation | 0.50 | -2.14 | 133.83 | -7.76 | 5.2933 | -0.7583 | |||
| ISRG / Intuitive Surgical, Inc. | 0.23 | 4.28 | 127.00 | 14.46 | 5.0234 | 0.3953 | |||
| SPGI / S&P Global Inc. | 0.23 | 3.66 | 121.96 | 7.51 | 4.8240 | 0.0922 | |||
| AME / AMETEK, Inc. | 0.66 | 2.73 | 119.98 | 8.02 | 4.7456 | 0.1129 | |||
| TXN / Texas Instruments Incorporated | 0.54 | 5.68 | 112.57 | 21.99 | 4.4523 | 0.6033 | |||
| SNPS / Synopsys, Inc. | 0.21 | 4.44 | 109.60 | 24.98 | 4.3350 | 0.6773 | |||
| TMO / Thermo Fisher Scientific Inc. | 0.26 | 9.77 | 104.30 | -10.61 | 4.1252 | -0.7411 | |||
| KO / The Coca-Cola Company | 1.39 | 2.85 | 98.33 | 1.56 | 3.8894 | -0.1492 | |||
| TJX / The TJX Companies, Inc. | 0.78 | -0.16 | 96.28 | 1.24 | 3.8081 | -0.1585 | |||
| UNP / Union Pacific Corporation | 0.40 | 4.08 | 91.69 | 1.35 | 3.6267 | -0.1471 | |||
| ENTG / Entegris, Inc. | 0.85 | 8.44 | 68.76 | -0.17 | 2.7198 | -0.1534 | |||
| DHR / Danaher Corporation | 0.29 | -0.93 | 57.85 | -4.54 | 2.2881 | -0.2396 | |||
| IBM / International Business Machines Corporation | 0.06 | -1.44 | 18.38 | 16.73 | 0.7270 | 0.0702 | |||
| GLD / SPDR Gold Trust | 0.05 | -5.44 | 16.69 | 0.01 | 0.6603 | -0.0359 | |||
| GOOGL / Alphabet Inc. | 0.04 | 3.80 | 7.83 | 18.36 | 0.3098 | 0.0338 | |||
| TSM / Taiwan Semiconductor Manufacturing Company Limited - Depositary Receipt (Common Stock) | 0.02 | -1.42 | 3.50 | 34.51 | 0.1383 | 0.0299 | |||
| AAXJ / iShares Trust - iShares MSCI All Country Asia ex Japan ETF | 0.03 | -8.41 | 2.83 | 2.28 | 0.1118 | -0.0035 | |||
| MA / Mastercard Incorporated | 0.00 | 2.51 | 2.02 | 5.04 | 0.0800 | -0.0003 | |||
| CP / Canadian Pacific Kansas City Limited | 0.02 | -1.63 | 1.51 | 11.36 | 0.0597 | 0.0032 | |||
| FERG / Ferguson Enterprises Inc. | 0.01 | -2.14 | 1.35 | 33.17 | 0.0532 | 0.0110 | |||
| PLD / Prologis, Inc. | 0.01 | 25.59 | 1.31 | 17.99 | 0.0516 | 0.0055 | |||
| IXN / iShares Trust - iShares Global Tech ETF | 0.01 | 0.00 | 1.20 | 21.99 | 0.0476 | 0.0064 | |||
| VHT / Vanguard World Fund - Vanguard Health Care ETF | 0.00 | -12.32 | 0.97 | -17.77 | 0.0385 | -0.0109 | |||
| WMT / Walmart Inc. | 0.01 | 0.00 | 0.92 | 11.30 | 0.0362 | 0.0019 | |||
| NVDD / Direxion Shares ETF Trust - Direxion Daily NVDA Bear 1X Shares | 0.01 | -3.01 | 0.86 | 40.78 | 0.0342 | 0.0086 | |||
| BRK.B / Berkshire Hathaway Inc. | 0.00 | -4.88 | 0.76 | -13.50 | 0.0299 | -0.0065 | |||
| CVX / Chevron Corporation | 0.00 | 0.00 | 0.69 | -14.57 | 0.0272 | -0.0063 | |||
| IRM / Iron Mountain Incorporated | 0.01 | -78.76 | 0.67 | -74.72 | 0.0264 | -0.0835 | |||
| NOC / Northrop Grumman Corporation | 0.00 | 9.83 | 0.56 | 7.31 | 0.0221 | 0.0004 | |||
| AAPL / Apple Inc. | 0.00 | -44.03 | 0.54 | -48.37 | 0.0214 | -0.0222 | |||
| SYY / Sysco Corporation | 0.01 | 0.00 | 0.53 | 0.95 | 0.0210 | -0.0010 | |||
| MMC / Marsh & McLennan Companies, Inc. | 0.00 | -17.25 | 0.51 | -25.84 | 0.0201 | -0.0085 | |||
| INTU / Intuit Inc. | 0.00 | -51.97 | 0.48 | -38.38 | 0.0190 | -0.0135 | |||
| SPY / SPDR S&P 500 ETF | 0.00 | 0.00 | 0.46 | 10.68 | 0.0180 | 0.0008 | |||
| JNJ / Johnson & Johnson | 0.00 | -13.39 | 0.38 | -20.21 | 0.0148 | -0.0048 | |||
| XEL / Xcel Energy Inc. | 0.01 | 0.00 | 0.37 | -3.93 | 0.0145 | -0.0014 | |||
| ABBV / AbbVie Inc. | 0.00 | 0.00 | 0.32 | -11.48 | 0.0128 | -0.0025 | |||
| WFC / Wells Fargo & Company | 0.00 | 0.00 | 0.32 | 11.46 | 0.0127 | 0.0007 | |||
| PODD / Insulet Corporation | 0.00 | 0.00 | 0.29 | 19.58 | 0.0114 | 0.0014 | |||
| ABT / Abbott Laboratories | 0.00 | 0.00 | 0.28 | 2.58 | 0.0110 | -0.0003 | |||
| HD / The Home Depot, Inc. | 0.00 | -16.67 | 0.27 | -16.72 | 0.0109 | -0.0029 | |||
| LLY / Eli Lilly and Company | 0.00 | -3.53 | 0.26 | -8.93 | 0.0101 | -0.0016 | |||
| BAC / Bank of America Corporation | 0.01 | 0.00 | 0.25 | 13.45 | 0.0100 | 0.0007 | |||
| ACN / Accenture plc | 0.00 | -100.00 | 0.00 | 0.0000 | |||||
| WTW / Willis Towers Watson Public Limited Company | 0.00 | -100.00 | 0.00 | 0.0000 | |||||
| UNH / UnitedHealth Group Incorporated | 0.00 | -100.00 | 0.00 | 0.0000 | |||||
| NVO / Novo Nordisk A/S - Depositary Receipt (Common Stock) | 0.00 | -100.00 | 0.00 | -100.00 | -0.0466 |