Mga Batayang Estadistika
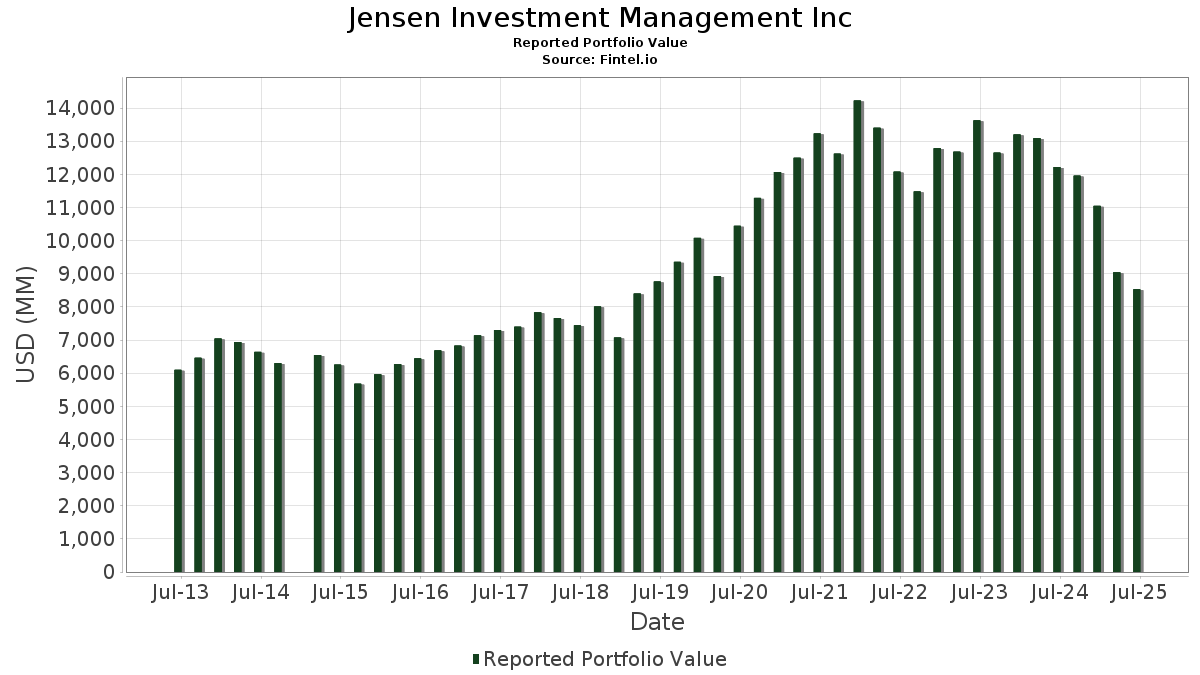
| Nilai Portofolio | $ 8,532,330,700 |
| Posisi Saat Ini | 83 |
Kepemilikan Terbaru, Kinerja, AUM (dari 13F, 13D)
Jensen Investment Management Inc telah mengungkapkan total kepemilikan 83 dalam pengajuan SEC terbaru mereka. Nilai portofolio terbaru dihitung sebesar $ 8,532,330,700 USD. Aset yang Dikelola (AUM) sebenarnya adalah nilai ini ditambah kas (yang tidak diungkapkan). Aset-aset utama Jensen Investment Management Inc adalah Microsoft Corporation (US:MSFT) , Stryker Corporation (US:SYK) , Marsh & McLennan Companies, Inc. (US:MMC) , Intuit Inc. (US:INTU) , and Apple Inc. (US:AAPL) . Posisi baru Jensen Investment Management Inc meliputi: NVIDIA Corporation (US:NVDA) , Meta Platforms, Inc. (US:META) , .
Peningkatan Tertinggi Kuartal Ini
Kami menggunakan perubahan dalam alokasi portofolio karena ini adalah metrik yang paling bermakna. Perubahan dapat disebabkan oleh perdagangan atau perubahan harga saham.
| Keamanan | Saham (MM) |
Nilai (Juta Dolar AS) |
Portfolio % | ΔPorsyento ng Portfolio |
|---|---|---|---|---|
| 1.75 | 276.17 | 3.2367 | 3.2367 | |
| 0.21 | 161.06 | 1.8876 | 1.8876 | |
| 2.38 | 323.51 | 3.7916 | 1.7882 | |
| 1.57 | 780.70 | 9.1499 | 1.7715 | |
| 0.20 | 150.14 | 1.7596 | 1.7596 | |
| 0.82 | 253.73 | 2.9737 | 1.4349 | |
| 2.61 | 257.94 | 3.0230 | 1.1971 | |
| 5.32 | 260.85 | 3.0572 | 0.6717 | |
| 0.39 | 348.47 | 4.0841 | 0.6553 | |
| 1.42 | 560.85 | 6.5733 | 0.3270 |
Penurunan Tertinggi Kuartal Ini
Kami menggunakan perubahan dalam alokasi portofolio karena ini adalah metrik yang paling bermakna. Perubahan dapat disebabkan oleh perdagangan atau perubahan harga saham.
| Keamanan | Saham (MM) |
Nilai (Juta Dolar AS) |
Portfolio % | ΔPorsyento ng Portfolio |
|---|---|---|---|---|
| 0.01 | 3.25 | 0.0380 | -3.4796 | |
| 0.02 | 3.47 | 0.0407 | -2.2924 | |
| 1.33 | 396.63 | 4.6486 | -1.6850 | |
| 0.10 | 13.75 | 0.1612 | -1.6161 | |
| 0.08 | 5.95 | 0.0698 | -1.5452 | |
| 2.32 | 475.43 | 5.5721 | -1.3702 | |
| 0.94 | 290.14 | 3.4005 | -0.9361 | |
| 2.42 | 529.90 | 6.2105 | -0.8855 | |
| 0.16 | 58.88 | 0.6901 | -0.5343 | |
| 0.42 | 63.57 | 0.7451 | -0.3823 |
Pengajuan 13F dan Dana
Formulir ini diajukan pada 2025-08-08 untuk periode pelaporan 2025-06-30. Klik ikon tautan untuk melihat riwayat transaksi selengkapnya.
Tingkatkan ke versi premium untuk membuka data premium dan ekspor ke Excel. ![]() .
.
| Keamanan | Ketik | Harga Saham Rata-rata | Saham (MM) |
ΔSaham (%) |
ΔSaham (%) |
Nilai ($MM) |
Portpolyo (%) |
ΔPortofolio (%) |
|
|---|---|---|---|---|---|---|---|---|---|
| MSFT / Microsoft Corporation | 1.57 | -11.70 | 780.70 | 17.00 | 9.1499 | 1.7715 | |||
| SYK / Stryker Corporation | 1.42 | -6.58 | 560.85 | -0.71 | 6.5733 | 0.3270 | |||
| MMC / Marsh & McLennan Companies, Inc. | 2.42 | -7.84 | 529.90 | -17.42 | 6.2105 | -0.8855 | |||
| INTU / Intuit Inc. | 0.63 | -24.23 | 494.98 | -2.80 | 5.8013 | 0.1703 | |||
| AAPL / Apple Inc. | 2.32 | -18.01 | 475.43 | -24.27 | 5.5721 | -1.3702 | |||
| GOOGL / Alphabet Inc. | 2.38 | -14.30 | 418.58 | -2.33 | 4.9058 | 0.1668 | |||
| ACN / Accenture plc | 1.33 | -27.71 | 396.63 | -30.75 | 4.6486 | -1.6850 | |||
| MA / Mastercard Incorporated | 0.62 | -9.86 | 348.95 | -7.58 | 4.0897 | -0.0855 | |||
| FTXP / Foothills Exploration, Inc. | 0.39 | -14.71 | 348.47 | 12.38 | 4.0841 | 0.6553 | |||
| ABT / Abbott Laboratories | 2.38 | 74.15 | 323.51 | 78.57 | 3.7916 | 1.7882 | |||
| BR / Broadridge Financial Solutions, Inc. | 1.30 | -6.46 | 315.23 | -6.24 | 3.6945 | -0.0231 | |||
| ADP / Automatic Data Processing, Inc. | 0.94 | -26.71 | 290.14 | -26.02 | 3.4005 | -0.9361 | |||
| NVDA / NVIDIA Corporation | 1.75 | 276.17 | 3.2367 | 3.2367 | |||||
| WM / Waste Management, Inc. | 1.17 | -7.89 | 268.64 | -8.96 | 3.1485 | -0.1144 | |||
| EFX / Equifax Inc. | 1.03 | -3.73 | 266.27 | 2.51 | 3.1207 | 0.2485 | |||
| CPRT / Copart, Inc. | 5.32 | 39.45 | 260.85 | 20.92 | 3.0572 | 0.6717 | |||
| APH / Amphenol Corporation | 2.61 | 3.75 | 257.94 | 56.20 | 3.0230 | 1.1971 | |||
| CDNS / Cadence Design Systems, Inc. | 0.82 | 50.49 | 253.73 | 82.33 | 2.9737 | 1.4349 | |||
| ZTS / Zoetis Inc. | 1.62 | -11.31 | 251.93 | -15.99 | 2.9526 | -0.3636 | |||
| GJR / Strats Trust For Procter & Gambel Security - Preferred Security | 1.43 | -4.06 | 228.02 | -10.31 | 2.6724 | -0.1389 | |||
| SHW / The Sherwin-Williams Company | 0.56 | -3.99 | 191.68 | -5.60 | 2.2465 | 0.0013 | |||
| LLY / Eli Lilly and Company | 0.21 | 161.06 | 1.8876 | 1.8876 | |||||
| META / Meta Platforms, Inc. | 0.20 | 150.14 | 1.7596 | 1.7596 | |||||
| MCD / McDonald's Corporation | 0.50 | -4.09 | 145.80 | -10.29 | 1.7088 | -0.0884 | |||
| VRSK / Verisk Analytics, Inc. | 0.28 | -14.44 | 87.76 | -10.45 | 1.0286 | -0.0551 | |||
| JNJ / Johnson & Johnson | 0.42 | -32.30 | 63.57 | -37.64 | 0.7451 | -0.3823 | |||
| HD / The Home Depot, Inc. | 0.16 | -46.85 | 58.88 | -46.83 | 0.6901 | -0.5343 | |||
| ORCL / Oracle Corporation | 0.15 | -1.28 | 31.75 | 54.38 | 0.3721 | 0.1447 | |||
| ECL / Ecolab Inc. | 0.07 | -1.45 | 18.32 | 4.74 | 0.2147 | 0.0213 | |||
| ADBE / Adobe Inc. | 0.04 | 0.00 | 17.02 | 0.87 | 0.1995 | 0.0129 | |||
| WAT / Waters Corporation | 0.04 | -0.89 | 15.34 | -6.14 | 0.1797 | -0.0009 | |||
| PEP / PepsiCo, Inc. | 0.10 | -90.28 | 13.75 | -91.44 | 0.1612 | -1.6161 | |||
| EMR / Emerson Electric Co. | 0.09 | 0.00 | 12.35 | 21.61 | 0.1447 | 0.0324 | |||
| CTSH / Cognizant Technology Solutions Corporation | 0.12 | -1.03 | 9.65 | 0.95 | 0.1132 | 0.0074 | |||
| CL / Colgate-Palmolive Company | 0.10 | -0.06 | 8.88 | -3.06 | 0.1041 | 0.0028 | |||
| KO / The Coca-Cola Company | 0.12 | -0.20 | 8.81 | -1.42 | 0.1032 | 0.0044 | |||
| CLX / The Clorox Company | 0.07 | 5.63 | 8.52 | -13.87 | 0.0999 | -0.0095 | |||
| LH / Labcorp Holdings Inc. | 0.03 | -4.14 | 7.18 | 8.14 | 0.0841 | 0.0107 | |||
| EHC / Encompass Health Corporation | 0.06 | -18.73 | 7.06 | -1.60 | 0.0827 | 0.0034 | |||
| CCK / Crown Holdings, Inc. | 0.07 | -13.33 | 6.73 | 0.00 | 0.0789 | 0.0045 | |||
| G / Genpact Limited | 0.15 | 3.83 | 6.52 | -9.29 | 0.0764 | -0.0031 | |||
| GIS / General Mills, Inc. | 0.13 | 2.01 | 6.49 | -11.60 | 0.0760 | -0.0051 | |||
| MSCI / MSCI Inc. | 0.01 | 19.59 | 6.37 | 21.95 | 0.0747 | 0.0169 | |||
| NKE / NIKE, Inc. | 0.08 | -96.36 | 5.95 | -95.92 | 0.0698 | -1.5452 | |||
| VEEV / Veeva Systems Inc. | 0.02 | -6.59 | 5.88 | 16.12 | 0.0689 | 0.0129 | |||
| KEYS / Keysight Technologies, Inc. | 0.04 | 4.82 | 5.81 | 14.68 | 0.0680 | 0.0121 | |||
| TSCO / Tractor Supply Company | 0.11 | 2.91 | 5.78 | -1.45 | 0.0677 | 0.0029 | |||
| KR / The Kroger Co. | 0.08 | -4.86 | 5.76 | 0.82 | 0.0675 | 0.0043 | |||
| IDXX / IDEXX Laboratories, Inc. | 0.01 | 27.11 | 5.58 | 62.34 | 0.0654 | 0.0274 | |||
| OMC / Omnicom Group Inc. | 0.08 | -0.65 | 5.47 | -13.80 | 0.0641 | -0.0061 | |||
| ROST / Ross Stores, Inc. | 0.04 | 5.61 | 5.09 | 5.44 | 0.0597 | 0.0063 | |||
| FDS / FactSet Research Systems Inc. | 0.01 | 0.00 | 4.65 | -1.63 | 0.0545 | 0.0022 | |||
| DCI / Donaldson Company, Inc. | 0.07 | 0.00 | 4.63 | 3.42 | 0.0543 | 0.0048 | |||
| FFIV / F5, Inc. | 0.01 | 0.00 | 4.41 | 10.52 | 0.0517 | 0.0076 | |||
| MMM / 3M Company | 0.03 | -0.14 | 4.23 | 3.52 | 0.0496 | 0.0044 | |||
| ABBV / AbbVie Inc. | 0.02 | 0.00 | 4.13 | -11.42 | 0.0484 | -0.0031 | |||
| CPB / The Campbell's Company | 0.13 | 0.75 | 4.09 | -22.66 | 0.0480 | -0.0105 | |||
| TSM / Taiwan Semiconductor Manufacturing Company Limited - Depositary Receipt (Common Stock) | 0.02 | -15.58 | 3.93 | 15.17 | 0.0460 | 0.0083 | |||
| BAH / Booz Allen Hamilton Holding Corporation | 0.04 | 0.00 | 3.84 | -0.41 | 0.0450 | 0.0024 | |||
| HOLX / Hologic, Inc. | 0.06 | 13.44 | 3.79 | 19.68 | 0.0445 | 0.0094 | |||
| APD / Air Products and Chemicals, Inc. | 0.01 | 0.00 | 3.57 | -4.35 | 0.0418 | 0.0006 | |||
| GNTX / Gentex Corporation | 0.16 | 0.00 | 3.55 | -5.61 | 0.0416 | 0.0000 | |||
| AON / Aon plc | 0.01 | 10.99 | 3.50 | -0.77 | 0.0410 | 0.0020 | |||
| CHD / Church & Dwight Co., Inc. | 0.04 | -20.69 | 3.47 | -30.76 | 0.0407 | -0.0148 | |||
| TXN / Texas Instruments Incorporated | 0.02 | -98.58 | 3.47 | -98.35 | 0.0407 | -2.2924 | |||
| UNH / UnitedHealth Group Incorporated | 0.01 | -98.29 | 3.25 | -98.98 | 0.0380 | -3.4796 | |||
| GPC / Genuine Parts Company | 0.03 | 0.00 | 3.23 | 1.83 | 0.0378 | 0.0028 | |||
| TROW / T. Rowe Price Group, Inc. | 0.03 | 0.00 | 3.08 | 5.04 | 0.0361 | 0.0037 | |||
| LEVI / Levi Strauss & Co. | 0.16 | -14.56 | 2.92 | 1.32 | 0.0342 | 0.0024 | |||
| TJX / The TJX Companies, Inc. | 0.02 | -11.80 | 2.87 | -10.56 | 0.0336 | -0.0019 | |||
| BBY / Best Buy Co., Inc. | 0.04 | -12.03 | 2.80 | -19.79 | 0.0328 | -0.0058 | |||
| TTC / The Toro Company | 0.04 | 0.00 | 2.79 | -2.86 | 0.0327 | 0.0009 | |||
| MANH / Manhattan Associates, Inc. | 0.01 | -5.76 | 2.58 | 7.54 | 0.0303 | 0.0037 | |||
| RTX / RTX Corporation | 0.02 | -0.51 | 2.57 | 9.65 | 0.0301 | 0.0042 | |||
| TECH / Bio-Techne Corporation | 0.05 | 0.00 | 2.44 | -12.23 | 0.0286 | -0.0022 | |||
| UPS / United Parcel Service, Inc. | 0.02 | -0.14 | 2.20 | -8.36 | 0.0258 | -0.0008 | |||
| ON / ON Semiconductor Corporation | 0.04 | 0.00 | 2.17 | 28.83 | 0.0255 | 0.0068 | |||
| BDX / Becton, Dickinson and Company | 0.01 | -6.16 | 2.15 | -29.43 | 0.0252 | -0.0085 | |||
| URI / United Rentals, Inc. | 0.00 | 0.00 | 2.02 | 20.25 | 0.0237 | 0.0051 | |||
| PAYX / Paychex, Inc. | 0.01 | -5.19 | 1.36 | -10.62 | 0.0159 | -0.0009 | |||
| BMY / Bristol-Myers Squibb Company | 0.03 | 0.00 | 1.22 | -24.13 | 0.0143 | -0.0035 | |||
| K / Kellanova | 0.01 | 0.00 | 0.91 | -3.61 | 0.0107 | 0.0002 | |||
| LIN / Linde plc | 0.00 | -4.50 | 0.65 | -3.72 | 0.0076 | 0.0001 | |||
| SBUX / Starbucks Corporation | 0.00 | -100.00 | 0.00 | 0.0000 | |||||
| MCHP / Microchip Technology Incorporated | 0.00 | -100.00 | 0.00 | 0.0000 | |||||
| LII / Lennox International Inc. | 0.00 | -100.00 | 0.00 | 0.0000 | |||||
| MAR / Marriott International, Inc. | 0.00 | -100.00 | 0.00 | 0.0000 |