Mga Batayang Estadistika
| Manajer | Hamish Douglass |
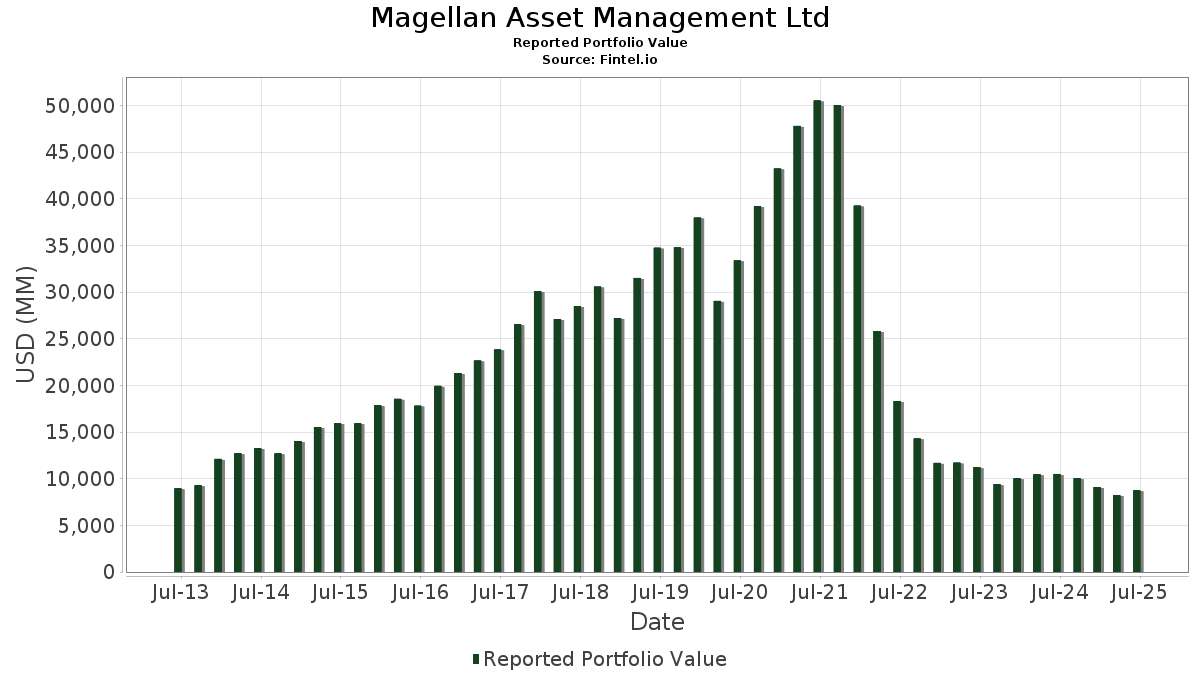
| Nilai Portofolio | $ 8,748,475,403 |
| Posisi Saat Ini | 84 |
Kepemilikan Terbaru, Kinerja, AUM (dari 13F, 13D)
Magellan Asset Management Ltd telah mengungkapkan total kepemilikan 84 dalam pengajuan SEC terbaru mereka. Manajer portofolio tercantum sebagai Hamish Douglass. Nilai portofolio terbaru dihitung sebesar $ 8,748,475,403 USD. Aset yang Dikelola (AUM) sebenarnya adalah nilai ini ditambah kas (yang tidak diungkapkan). Aset-aset utama Magellan Asset Management Ltd adalah Microsoft Corporation (US:MSFT) , Amazon.com, Inc. (US:AMZN) , Meta Platforms, Inc. (US:META) , Eversource Energy (US:ES) , and Taiwan Semiconductor Manufacturing Company Limited - Depositary Receipt (Common Stock) (US:TSM) .
Peningkatan Tertinggi Kuartal Ini
Kami menggunakan perubahan dalam alokasi portofolio karena ini adalah metrik yang paling bermakna. Perubahan dapat disebabkan oleh perdagangan atau perubahan harga saham.
| Keamanan | Saham (MM) |
Nilai (Juta Dolar AS) |
Portfolio % | ΔPorsyento ng Portfolio |
|---|---|---|---|---|
| 0.31 | 175.91 | 2.0108 | 2.0108 | |
| 2.36 | 162.98 | 1.8630 | 1.7325 | |
| 0.49 | 133.97 | 1.5314 | 1.5302 | |
| 1.93 | 436.15 | 4.9855 | 1.3478 | |
| 0.63 | 468.06 | 5.3502 | 1.2039 | |
| 3.15 | 691.93 | 7.9091 | 0.9033 | |
| 1.71 | 272.50 | 3.1148 | 0.7501 | |
| 1.94 | 137.52 | 1.5719 | 0.6866 | |
| 2.31 | 341.84 | 3.9074 | 0.6594 | |
| 0.96 | 43.27 | 0.4946 | 0.4828 |
Penurunan Tertinggi Kuartal Ini
Kami menggunakan perubahan dalam alokasi portofolio karena ini adalah metrik yang paling bermakna. Perubahan dapat disebabkan oleh perdagangan atau perubahan harga saham.
| Keamanan | Saham (MM) |
Nilai (Juta Dolar AS) |
Portfolio % | ΔPorsyento ng Portfolio |
|---|---|---|---|---|
| 1.68 | 115.83 | 1.3240 | -0.8763 | |
| 0.82 | 256.71 | 2.9343 | -0.6183 | |
| 0.62 | 110.61 | 1.2643 | -0.5561 | |
| 1.12 | 196.94 | 2.2511 | -0.5122 | |
| 0.66 | 369.06 | 4.2186 | -0.4454 | |
| 0.41 | 155.39 | 1.7761 | -0.4036 | |
| 1.32 | 137.25 | 1.5688 | -0.3725 | |
| 1.33 | 136.76 | 1.5632 | -0.3396 | |
| 0.84 | 185.06 | 2.1153 | -0.2537 | |
| 2.26 | 171.09 | 1.9556 | -0.2527 |
Pengajuan 13F dan Dana
Formulir ini diajukan pada 2025-08-07 untuk periode pelaporan 2025-06-30. Klik ikon tautan untuk melihat riwayat transaksi selengkapnya.
Tingkatkan ke versi premium untuk membuka data premium dan ekspor ke Excel. ![]() .
.
| Keamanan | Ketik | Harga Saham Rata-rata | Saham (MM) |
ΔSaham (%) |
ΔSaham (%) |
Nilai ($MM) |
Portpolyo (%) |
ΔPortofolio (%) |
|
|---|---|---|---|---|---|---|---|---|---|
| MSFT / Microsoft Corporation | 1.41 | -15.11 | 703.03 | 12.49 | 8.0360 | 0.4374 | |||
| AMZN / Amazon.com, Inc. | 3.15 | 4.14 | 691.93 | 20.08 | 7.9091 | 0.9033 | |||
| META / Meta Platforms, Inc. | 0.63 | 7.17 | 468.06 | 37.25 | 5.3502 | 1.2039 | |||
| ES / Eversource Energy | 6.95 | 1.10 | 442.29 | 3.56 | 5.0557 | -0.1369 | |||
| TSM / Taiwan Semiconductor Manufacturing Company Limited - Depositary Receipt (Common Stock) | 1.93 | 6.84 | 436.15 | 45.77 | 4.9855 | 1.3478 | |||
| MA / Mastercard Incorporated | 0.66 | -6.16 | 369.06 | -3.79 | 4.2186 | -0.4454 | |||
| YUM / Yum! Brands, Inc. | 2.31 | 35.89 | 341.84 | 27.96 | 3.9074 | 0.6594 | |||
| V / Visa Inc. | 0.88 | -1.80 | 311.26 | -0.51 | 3.5579 | -0.2459 | |||
| NFLX / Netflix, Inc. | 0.22 | -27.33 | 292.00 | 4.35 | 3.3378 | -0.0644 | |||
| CMG / Chipotle Mexican Grill, Inc. | 4.90 | 3.44 | 275.19 | 15.67 | 3.1455 | 0.2532 | |||
| PG / The Procter & Gamble Company | 1.71 | 49.86 | 272.50 | 40.10 | 3.1148 | 0.7501 | |||
| ICE / Intercontinental Exchange, Inc. | 1.45 | -3.64 | 266.49 | 2.49 | 3.0462 | -0.1151 | |||
| UNH / UnitedHealth Group Incorporated | 0.82 | 47.49 | 256.71 | -12.15 | 2.9343 | -0.6183 | |||
| SYK / Stryker Corporation | 0.53 | -1.06 | 209.98 | 5.16 | 2.4002 | -0.0276 | |||
| INTU / Intuit Inc. | 0.26 | -21.24 | 207.15 | 1.03 | 2.3678 | -0.1250 | |||
| D / Dominion Energy, Inc. | 3.64 | -0.86 | 205.56 | -0.06 | 2.3497 | -0.1510 | |||
| GOOGL / Alphabet Inc. | 1.12 | -23.97 | 196.94 | -13.35 | 2.2511 | -0.5122 | |||
| AMT / American Tower Corporation | 0.84 | -6.50 | 185.06 | -5.03 | 2.1153 | -0.2537 | |||
| MSCI / MSCI Inc. | 0.31 | 175.91 | 2.0108 | 2.0108 | |||||
| SRE / Sempra | 2.26 | -11.29 | 171.09 | -5.81 | 1.9556 | -0.2527 | |||
| EVRG / Evergy, Inc. | 2.36 | 1,418.68 | 162.98 | 1,418.25 | 1.8630 | 1.7325 | |||
| HCA / HCA Healthcare, Inc. | 0.41 | -21.83 | 155.39 | -13.33 | 1.7761 | -0.4036 | |||
| KO / The Coca-Cola Company | 1.94 | 91.18 | 137.52 | 88.86 | 1.5719 | 0.6866 | |||
| WEC / WEC Energy Group, Inc. | 1.32 | -10.10 | 137.25 | -14.05 | 1.5688 | -0.3725 | |||
| CCI / Crown Castle Inc. | 1.33 | -11.34 | 136.76 | -12.62 | 1.5632 | -0.3396 | |||
| XEL / Xcel Energy Inc. | 2.00 | -3.39 | 136.41 | -7.06 | 1.5592 | -0.2252 | |||
| CME / CME Group Inc. | 0.49 | 131,625.47 | 133.97 | 138,012.37 | 1.5314 | 1.5302 | |||
| NVO / Novo Nordisk A/S - Depositary Receipt (Common Stock) | 1.68 | -35.61 | 115.83 | -36.00 | 1.3240 | -0.8763 | |||
| GOOG / Alphabet Inc. | 0.62 | -34.94 | 110.61 | -26.13 | 1.2643 | -0.5561 | |||
| CSX / CSX Corporation | 3.18 | -8.96 | 103.69 | 0.94 | 1.1853 | -0.0636 | |||
| NSC / Norfolk Southern Corporation | 0.40 | -13.10 | 101.94 | -6.09 | 1.1653 | -0.1545 | |||
| BKNG / Booking Holdings Inc. | 0.01 | -29.06 | 49.19 | -10.85 | 0.5623 | -0.1086 | |||
| ZBH / Zimmer Biomet Holdings, Inc. | 0.51 | 16.76 | 46.14 | -5.91 | 0.5274 | -0.0688 | |||
| USB / U.S. Bancorp | 0.96 | 4,029.27 | 43.27 | 4,329.27 | 0.4946 | 0.4828 | |||
| DG / Dollar General Corporation | 0.37 | -37.33 | 42.16 | -18.48 | 0.4819 | -0.1469 | |||
| BRK.A / Berkshire Hathaway Inc. | 0.08 | 11.82 | 39.72 | 2.00 | 0.4541 | -0.0195 | |||
| AEP / American Electric Power Company, Inc. | 0.32 | 9.69 | 33.12 | 4.16 | 0.3786 | -0.0080 | |||
| EXC / Exelon Corporation | 0.76 | 4.39 | 32.96 | -1.63 | 0.3768 | -0.0306 | |||
| DUK / Duke Energy Corporation | 0.28 | 10.49 | 32.82 | 6.89 | 0.3751 | 0.0018 | |||
| SO / The Southern Company | 0.35 | 9.21 | 32.55 | 9.07 | 0.3720 | 0.0092 | |||
| NEE / NextEra Energy, Inc. | 0.47 | 17.67 | 32.40 | 15.23 | 0.3703 | 0.0285 | |||
| PEG / Public Service Enterprise Group Incorporated | 0.35 | 9.76 | 29.82 | 12.26 | 0.3408 | 0.0179 | |||
| ULTA / Ulta Beauty, Inc. | 0.06 | -19.56 | 29.80 | 2.67 | 0.3407 | -0.0123 | |||
| ED / Consolidated Edison, Inc. | 0.28 | 9.79 | 27.62 | -0.37 | 0.3157 | -0.0213 | |||
| MELI / MercadoLibre, Inc. | 0.01 | -11.07 | 25.52 | 19.14 | 0.2917 | 0.0313 | |||
| ETR / Entergy Corporation | 0.30 | 3.70 | 25.05 | 0.83 | 0.2863 | -0.0157 | |||
| MS / Morgan Stanley | 0.16 | 3.22 | 23.22 | 24.63 | 0.2655 | 0.0389 | |||
| CRM / Salesforce, Inc. | 0.08 | 9.23 | 21.46 | 10.99 | 0.2453 | 0.0102 | |||
| AWK / American Water Works Company, Inc. | 0.15 | -5.65 | 20.73 | -11.03 | 0.2370 | -0.0463 | |||
| AEE / Ameren Corporation | 0.21 | 8.58 | 20.16 | 3.86 | 0.2304 | -0.0055 | |||
| SBAC / SBA Communications Corporation | 0.08 | -0.52 | 19.12 | 6.19 | 0.2186 | -0.0004 | |||
| DTE / DTE Energy Company | 0.14 | 0.05 | 18.78 | -4.15 | 0.2147 | -0.0236 | |||
| YUMC / Yum China Holdings, Inc. | 0.41 | 18.48 | 0.2113 | 0.2113 | |||||
| ATO / Atmos Energy Corporation | 0.12 | -0.54 | 17.92 | -0.84 | 0.2048 | -0.0149 | |||
| FE / FirstEnergy Corp. | 0.41 | -1.03 | 16.66 | -1.42 | 0.1904 | -0.0150 | |||
| PPL / PPL Corporation | 0.48 | -0.69 | 16.21 | -6.79 | 0.1853 | -0.0262 | |||
| CNP / CenterPoint Energy, Inc. | 0.44 | -0.28 | 16.20 | 1.12 | 0.1852 | -0.0096 | |||
| CMS / CMS Energy Corporation | 0.20 | -0.42 | 13.89 | -8.15 | 0.1588 | -0.0251 | |||
| NI / NiSource Inc. | 0.34 | -0.94 | 13.85 | -0.32 | 0.1584 | -0.0106 | |||
| LNT / Alliant Energy Corporation | 0.17 | -0.75 | 10.41 | -6.73 | 0.1190 | -0.0167 | |||
| WTRG / Essential Utilities, Inc. | 0.20 | -0.53 | 7.40 | -6.54 | 0.0846 | -0.0117 | |||
| PNW / Pinnacle West Capital Corporation | 0.08 | -1.66 | 7.33 | -7.62 | 0.0837 | -0.0127 | |||
| OGE / OGE Energy Corp. | 0.13 | -1.48 | 5.90 | -4.87 | 0.0674 | -0.0080 | |||
| TMO / Thermo Fisher Scientific Inc. | 0.01 | 115.72 | 5.05 | 75.79 | 0.0577 | 0.0228 | |||
| IDA / IDACORP, Inc. | 0.04 | -3.47 | 4.06 | -4.11 | 0.0464 | -0.0051 | |||
| MDLZ / Mondelez International, Inc. | 0.06 | 1.10 | 3.86 | 0.47 | 0.0441 | -0.0026 | |||
| SPGI / S&P Global Inc. | 0.01 | 0.00 | 3.23 | 3.75 | 0.0370 | -0.0009 | |||
| TXNM / TXNM Energy, Inc. | 0.06 | -0.14 | 3.23 | 5.18 | 0.0369 | -0.0004 | |||
| POR / Portland General Electric Company | 0.07 | -0.97 | 3.01 | -9.77 | 0.0344 | -0.0062 | |||
| SR / Spire Inc. | 0.04 | -3.01 | 2.97 | -9.54 | 0.0339 | -0.0060 | |||
| OGS / ONE Gas, Inc. | 0.04 | -2.80 | 2.92 | -7.58 | 0.0333 | -0.0050 | |||
| ALE / ALLETE, Inc. | 0.04 | -2.48 | 2.66 | -4.91 | 0.0304 | -0.0036 | |||
| BKH / Black Hills Corporation | 0.05 | -0.53 | 2.56 | -7.96 | 0.0292 | -0.0046 | |||
| NWE / NorthWestern Energy Group, Inc. | 0.05 | -2.59 | 2.45 | -13.65 | 0.0281 | -0.0065 | |||
| AWR / American States Water Company | 0.03 | -2.09 | 2.04 | -4.63 | 0.0233 | -0.0027 | |||
| CWT / California Water Service Group | 0.04 | -4.51 | 1.98 | -10.37 | 0.0226 | -0.0042 | |||
| AVA / Avista Corporation | 0.05 | -3.54 | 1.92 | -12.55 | 0.0219 | -0.0047 | |||
| MGEE / MGE Energy, Inc. | 0.02 | -4.95 | 1.91 | -9.56 | 0.0218 | -0.0039 | |||
| CPK / Chesapeake Utilities Corporation | 0.01 | 1.44 | 1.44 | -5.07 | 0.0165 | -0.0020 | |||
| HTO / H2O America | 0.02 | -2.50 | 1.08 | -7.39 | 0.0123 | -0.0018 | |||
| NWN / Northwest Natural Holding Company | 0.02 | 3.47 | 0.86 | -3.80 | 0.0098 | -0.0010 | |||
| MSEX / Middlesex Water Company | 0.01 | -1.89 | 0.65 | -17.03 | 0.0075 | -0.0021 | |||
| PEP / PepsiCo, Inc. | 0.00 | 22.54 | 0.10 | 8.42 | 0.0012 | 0.0000 | |||
| BLK / BlackRock, Inc. | 0.00 | 14.29 | 0.08 | 27.12 | 0.0009 | 0.0001 | |||
| CL / Colgate-Palmolive Company | 0.00 | -100.00 | 0.00 | 0.0000 | |||||
| MCD / McDonald's Corporation | 0.00 | -100.00 | 0.00 | 0.0000 | |||||
| RSG / Republic Services, Inc. | 0.00 | -100.00 | 0.00 | 0.0000 | |||||
| AAPL / Apple Inc. | 0.00 | -100.00 | 0.00 | 0.0000 | |||||
| ADBE / Adobe Inc. | 0.00 | -100.00 | 0.00 | 0.0000 |