Mga Batayang Estadistika
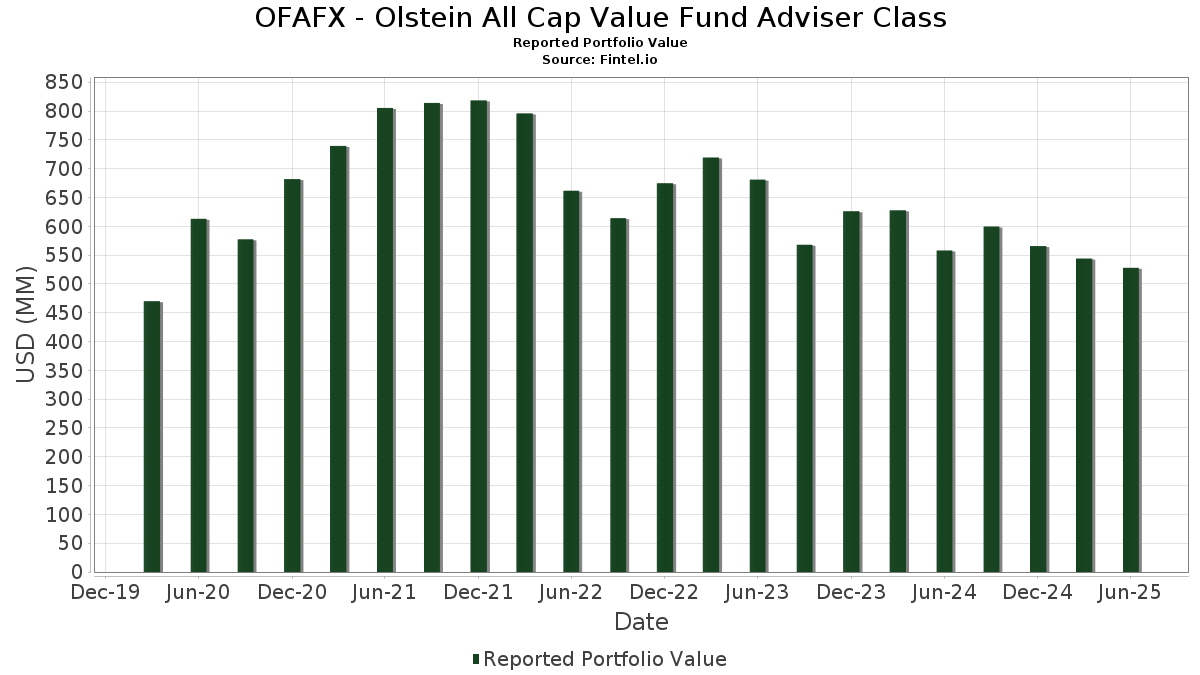
| Nilai Portofolio | $ 527,766,940 |
| Posisi Saat Ini | 83 |
Kepemilikan Terbaru, Kinerja, AUM (dari 13F, 13D)
OFAFX - Olstein All Cap Value Fund Adviser Class telah mengungkapkan total kepemilikan 83 dalam pengajuan SEC terbaru mereka. Nilai portofolio terbaru dihitung sebesar $ 527,766,940 USD. Aset yang Dikelola (AUM) sebenarnya adalah nilai ini ditambah kas (yang tidak diungkapkan). Aset-aset utama OFAFX - Olstein All Cap Value Fund Adviser Class adalah First American Funds Inc - First American Government Obligations Fund Class X (US:FGXXX) , The Walt Disney Company (US:DIS) , Johnson & Johnson (US:JNJ) , General Dynamics Corporation (US:GD) , and Becton, Dickinson and Company (US:BDX) . Posisi baru OFAFX - Olstein All Cap Value Fund Adviser Class meliputi: Adobe Inc. (US:ADBE) , Ralliant Corporation (US:RAL) , .
Peningkatan Tertinggi Kuartal Ini
Kami menggunakan perubahan dalam alokasi portofolio karena ini adalah metrik yang paling bermakna. Perubahan dapat disebabkan oleh perdagangan atau perubahan harga saham.
| Keamanan | Saham (MM) |
Nilai (Juta Dolar AS) |
Portfolio % | ΔPorsyento ng Portfolio |
|---|---|---|---|---|
| 27.83 | 27.83 | 5.5633 | 5.5633 | |
| 0.01 | 3.87 | 0.7734 | 0.7734 | |
| 0.01 | 3.24 | 0.6484 | 0.6484 | |
| 16.17 | 16.17 | 3.2320 | 0.6353 | |
| 0.02 | 4.93 | 0.9845 | 0.4481 | |
| 0.04 | 7.11 | 1.4216 | 0.3794 | |
| 0.02 | 5.88 | 1.1760 | 0.3270 | |
| 0.10 | 7.18 | 1.4343 | 0.3066 | |
| 0.03 | 5.50 | 1.0998 | 0.2840 | |
| 0.03 | 1.32 | 0.2633 | 0.2633 |
Penurunan Tertinggi Kuartal Ini
Kami menggunakan perubahan dalam alokasi portofolio karena ini adalah metrik yang paling bermakna. Perubahan dapat disebabkan oleh perdagangan atau perubahan harga saham.
| Keamanan | Saham (MM) |
Nilai (Juta Dolar AS) |
Portfolio % | ΔPorsyento ng Portfolio |
|---|---|---|---|---|
| 0.27 | 8.15 | 1.6282 | -0.4729 | |
| 0.08 | 5.31 | 1.0617 | -0.4493 | |
| 0.09 | 7.01 | 1.4004 | -0.4378 | |
| 0.06 | 5.96 | 1.1905 | -0.4377 | |
| 0.20 | 7.25 | 1.4500 | -0.4223 | |
| 0.04 | 4.51 | 0.9020 | -0.4173 | |
| 0.02 | 6.42 | 1.2835 | -0.3868 | |
| 0.25 | 8.55 | 1.7094 | -0.3697 | |
| 0.18 | 4.31 | 0.8608 | -0.3609 | |
| 0.15 | 4.77 | 0.9537 | -0.3188 |
Pengajuan 13F dan Dana
Formulir ini diajukan pada 2025-08-27 untuk periode pelaporan 2025-06-30. Klik ikon tautan untuk melihat riwayat transaksi selengkapnya.
Tingkatkan ke versi premium untuk membuka data premium dan ekspor ke Excel. ![]() .
.
| Keamanan | Ketik | Harga Saham Rata-rata | Saham (MM) |
ΔSaham (%) |
ΔSaham (%) |
Nilai ($MM) |
Portpolyo (%) |
ΔPortofolio (%) |
|
|---|---|---|---|---|---|---|---|---|---|
| Mount Vernon Liquid Assets Portfolio, LLC / STIV (N/A) | 27.83 | 27.83 | 5.5633 | 5.5633 | |||||
| FGXXX / First American Funds Inc - First American Government Obligations Fund Class X | 16.17 | 22.89 | 16.17 | 22.89 | 3.2320 | 0.6353 | |||
| DIS / The Walt Disney Company | 0.11 | -19.71 | 13.89 | 0.88 | 2.7764 | 0.0588 | |||
| JNJ / Johnson & Johnson | 0.06 | -7.58 | 9.32 | -14.87 | 1.8626 | -0.2978 | |||
| GD / General Dynamics Corporation | 0.03 | -6.06 | 9.04 | 0.51 | 1.8073 | 0.0320 | |||
| Aptiv PLC / EC (JE00BTDN8H13) | 0.13 | -5.84 | 8.80 | 7.96 | 1.7592 | 0.1503 | |||
| BDX / Becton, Dickinson and Company | 0.05 | 18.60 | 8.78 | -10.81 | 1.7560 | -0.1880 | |||
| VNT / Vontier Corporation | 0.24 | 1.71 | 8.78 | 14.26 | 1.7555 | 0.2383 | |||
| S94 / Sensata Technologies Holding plc | 0.29 | -16.24 | 8.78 | 3.93 | 1.7545 | 0.0875 | |||
| SLB / Schlumberger Limited | 0.25 | 0.40 | 8.55 | -18.82 | 1.7094 | -0.3697 | |||
| ABM / ABM Industries Incorporated | 0.17 | 10.39 | 8.23 | 10.04 | 1.6459 | 0.1690 | |||
| BAX / Baxter International Inc. | 0.27 | -13.50 | 8.15 | -23.49 | 1.6282 | -0.4729 | |||
| NDAQ / Nasdaq, Inc. | 0.09 | -1.09 | 8.14 | 16.59 | 1.6266 | 0.2491 | |||
| DAL / Delta Air Lines, Inc. | 0.16 | -5.20 | 8.07 | 6.93 | 1.6123 | 0.1235 | |||
| OMC / Omnicom Group Inc. | 0.11 | 11.11 | 7.91 | -3.59 | 1.5818 | -0.0382 | |||
| UNH / UnitedHealth Group Incorporated | 0.03 | 75.44 | 7.80 | 4.50 | 1.5590 | 0.0860 | |||
| TGT / Target Corporation | 0.08 | 5.33 | 7.79 | -0.43 | 1.5579 | 0.0130 | |||
| IFF / International Flavors & Fragrances Inc. | 0.10 | 0.00 | 7.72 | -5.24 | 1.5437 | -0.0647 | |||
| USB / U.S. Bancorp | 0.17 | 0.60 | 7.65 | 7.83 | 1.5286 | 0.1287 | |||
| AVTR / Avantor, Inc. | 0.56 | 12.46 | 7.50 | -6.61 | 1.4987 | -0.0859 | |||
| HOLX / Hologic, Inc. | 0.12 | 0.00 | 7.49 | 5.49 | 1.4979 | 0.0958 | |||
| MDT / Medtronic plc | 0.08 | 0.00 | 7.32 | -2.99 | 1.4637 | -0.0261 | |||
| FDX / FedEx Corporation | 0.03 | 3.23 | 7.27 | -3.76 | 1.4540 | -0.0376 | |||
| LKQ / LKQ Corporation | 0.20 | -12.11 | 7.25 | -23.54 | 1.4500 | -0.4223 | |||
| DGX / Quest Diagnostics Incorporated | 0.04 | -13.04 | 7.19 | -7.68 | 1.4363 | -0.0999 | |||
| NKE / NIKE, Inc. | 0.10 | 12.22 | 7.18 | 25.59 | 1.4343 | 0.3066 | |||
| FIS / Fidelity National Information Services, Inc. | 0.09 | -24.79 | 7.16 | -18.00 | 1.4321 | -0.2925 | |||
| WCC / WESCO International, Inc. | 0.04 | 12.94 | 7.11 | 34.68 | 1.4216 | 0.3794 | |||
| CFG / Citizens Financial Group, Inc. | 0.16 | 3.87 | 7.08 | 13.46 | 1.4151 | 0.1836 | |||
| HSIC / Henry Schein, Inc. | 0.10 | -3.02 | 7.04 | 3.42 | 1.4068 | 0.0639 | |||
| CTVA / Corteva, Inc. | 0.09 | -36.49 | 7.01 | -24.78 | 1.4004 | -0.4378 | |||
| CSCO / Cisco Systems, Inc. | 0.10 | -7.55 | 6.80 | 3.94 | 1.3591 | 0.0681 | |||
| CBRE / CBRE Group, Inc. | 0.05 | 4.87 | 6.61 | 12.35 | 1.3218 | 0.1602 | |||
| WFC / Wells Fargo & Company | 0.08 | -4.34 | 6.57 | 6.76 | 1.3133 | 0.0987 | |||
| TRV / The Travelers Companies, Inc. | 0.02 | -25.00 | 6.42 | -24.13 | 1.2835 | -0.3868 | |||
| LHX / L3Harris Technologies, Inc. | 0.03 | -31.51 | 6.27 | -17.91 | 1.2535 | -0.2543 | |||
| FITB / Fifth Third Bancorp | 0.15 | 5.67 | 6.13 | 10.87 | 1.2250 | 0.1341 | |||
| REYN / Reynolds Consumer Products Inc. | 0.29 | 5.37 | 6.12 | -5.41 | 1.2227 | -0.0536 | |||
| GM / General Motors Company | 0.12 | -13.89 | 6.10 | -9.89 | 1.2198 | -0.1169 | |||
| ZBH / Zimmer Biomet Holdings, Inc. | 0.07 | -1.49 | 6.02 | -20.63 | 1.2033 | -0.2933 | |||
| CMCSA / Comcast Corporation | 0.17 | 0.00 | 5.96 | -3.28 | 1.1914 | -0.0248 | |||
| UPS / United Parcel Service, Inc. | 0.06 | -21.33 | 5.96 | -27.81 | 1.1905 | -0.4377 | |||
| JLL / Jones Lang LaSalle Incorporated | 0.02 | 32.56 | 5.88 | 36.76 | 1.1760 | 0.3270 | |||
| MHK / Mohawk Industries, Inc. | 0.06 | 0.00 | 5.83 | -8.18 | 1.1648 | -0.0878 | |||
| SWK / Stanley Black & Decker, Inc. | 0.09 | 2.38 | 5.83 | -9.77 | 1.1647 | -0.1099 | |||
| SYY / Sysco Corporation | 0.07 | 0.00 | 5.68 | 0.92 | 1.1355 | 0.0247 | |||
| EMN / Eastman Chemical Company | 0.07 | 4.23 | 5.52 | -11.69 | 1.1044 | -0.1303 | |||
| ON / ON Semiconductor Corporation | 0.10 | -31.37 | 5.50 | -11.60 | 1.1000 | -0.1287 | |||
| TXN / Texas Instruments Incorporated | 0.03 | 15.22 | 5.50 | 33.10 | 1.0998 | 0.2840 | |||
| FI / Fiserv, Inc. | 0.03 | 65.79 | 5.43 | 29.44 | 1.0856 | 0.2575 | |||
| DOV / Dover Corporation | 0.03 | 11.25 | 5.41 | 16.04 | 1.0805 | 0.1610 | |||
| SSNC / SS&C Technologies Holdings, Inc. | 0.07 | 2.72 | 5.38 | 1.84 | 1.0758 | 0.0326 | |||
| AAPL / Apple Inc. | 0.03 | 13.04 | 5.33 | 4.42 | 1.0663 | 0.0580 | |||
| CVS / CVS Health Corporation | 0.08 | -31.86 | 5.31 | -30.62 | 1.0617 | -0.4493 | |||
| GLW / Corning Incorporated | 0.10 | -7.48 | 5.21 | 6.29 | 1.0407 | 0.0739 | |||
| WTY / Willis Towers Watson Public Limited Company | 0.02 | -5.71 | 5.06 | -14.49 | 1.0109 | -0.1564 | |||
| MIDD / The Middleby Corporation | 0.03 | 12.78 | 5.03 | 6.86 | 1.0064 | 0.0765 | |||
| HON / Honeywell International Inc. | 0.02 | 10.26 | 5.01 | 21.24 | 1.0009 | 0.1859 | |||
| KLIC / Kulicke and Soffa Industries, Inc. | 0.14 | -24.65 | 4.98 | -20.96 | 0.9955 | -0.2478 | |||
| MSFT / Microsoft Corporation | 0.01 | 0.00 | 4.97 | 32.53 | 0.9943 | 0.2534 | |||
| GS / The Goldman Sachs Group, Inc. | 0.01 | -12.50 | 4.95 | 13.36 | 0.9903 | 0.1277 | |||
| CB / Chubb Limited | 0.02 | 88.89 | 4.93 | 81.27 | 0.9845 | 0.4481 | |||
| GOOG / Alphabet Inc. | 0.03 | -8.33 | 4.88 | 4.10 | 0.9751 | 0.0501 | |||
| LUV / Southwest Airlines Co. | 0.15 | -23.40 | 4.77 | -26.01 | 0.9537 | -0.3188 | |||
| KMB / Kimberly-Clark Corporation | 0.04 | -25.53 | 4.51 | -32.50 | 0.9020 | -0.4173 | |||
| CMI / Cummins Inc. | 0.01 | 12.50 | 4.42 | 17.55 | 0.8838 | 0.1414 | |||
| DIN / Dine Brands Global, Inc. | 0.18 | -33.46 | 4.31 | -30.42 | 0.8608 | -0.3609 | |||
| FTV / Fortive Corporation | 0.08 | 2.52 | 4.25 | -26.97 | 0.8493 | -0.2990 | |||
| IVZ / Invesco Ltd. | 0.26 | 0.00 | 4.13 | 3.95 | 0.8263 | 0.0415 | |||
| EFX / Equifax Inc. | 0.01 | 0.00 | 3.89 | 6.49 | 0.7777 | 0.0566 | |||
| ADBE / Adobe Inc. | 0.01 | 3.87 | 0.7734 | 0.7734 | |||||
| RTX / RTX Corporation | 0.03 | -19.73 | 3.80 | -11.52 | 0.7589 | -0.0879 | |||
| KFY / Korn Ferry | 0.05 | -8.35 | 3.74 | -0.93 | 0.7483 | 0.0026 | |||
| PEP / PepsiCo, Inc. | 0.03 | 33.33 | 3.70 | 17.44 | 0.7390 | 0.1176 | |||
| BRK.B / Berkshire Hathaway Inc. | 0.01 | -13.14 | 3.69 | -20.79 | 0.7380 | -0.1818 | |||
| DE / Deere & Company | 0.01 | -33.33 | 3.56 | -27.78 | 0.7115 | -0.2612 | |||
| META / Meta Platforms, Inc. | 0.00 | 12.50 | 3.32 | 44.08 | 0.6639 | 0.2089 | |||
| TMO / Thermo Fisher Scientific Inc. | 0.01 | 3.24 | 0.6484 | 0.6484 | |||||
| SPGI / S&P Global Inc. | 0.01 | 0.00 | 2.85 | 3.79 | 0.5692 | 0.0276 | |||
| EBAY / eBay Inc. | 0.04 | -5.00 | 2.83 | 4.43 | 0.5656 | 0.0309 | |||
| V / Visa Inc. | 0.01 | -14.29 | 2.13 | -13.17 | 0.4258 | -0.0584 | |||
| RAL / Ralliant Corporation | 0.03 | 1.32 | 0.2633 | 0.2633 | |||||
| 8AMMF0A92 / US Bank MM Deposit Account Global Fund | 0.85 | 22.89 | 0.85 | 22.83 | 0.1701 | 0.0334 |