Mga Batayang Estadistika
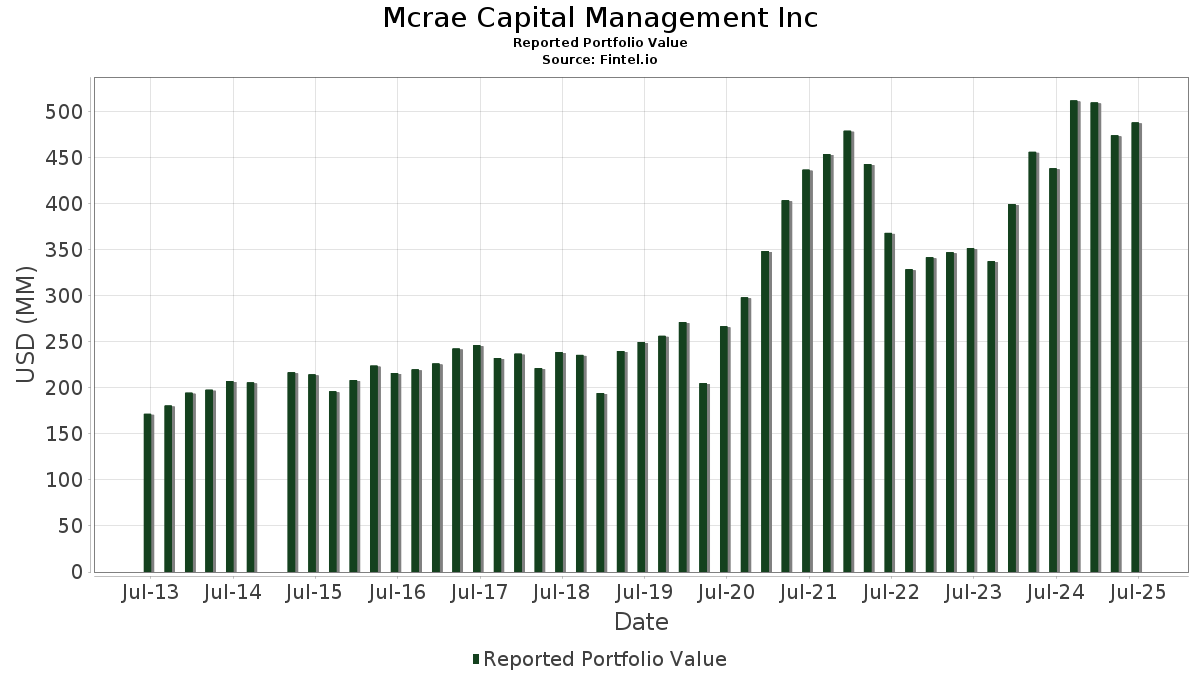
| Nilai Portofolio | $ 488,405,699 |
| Posisi Saat Ini | 102 |
Kepemilikan Terbaru, Kinerja, AUM (dari 13F, 13D)
Mcrae Capital Management Inc telah mengungkapkan total kepemilikan 102 dalam pengajuan SEC terbaru mereka. Nilai portofolio terbaru dihitung sebesar $ 488,405,699 USD. Aset yang Dikelola (AUM) sebenarnya adalah nilai ini ditambah kas (yang tidak diungkapkan). Aset-aset utama Mcrae Capital Management Inc adalah Microsoft Corporation (US:MSFT) , Check Point Software Technologies Ltd. (US:CHKP) , Nasdaq, Inc. (US:NDAQ) , Williams-Sonoma, Inc. (US:WSM) , and Labcorp Holdings Inc. (US:LH) . Posisi baru Mcrae Capital Management Inc meliputi: Fidelity Covington Trust - Fidelity Enhanced Mid Cap ETF (US:FMDE) , Fidelity Covington Trust - Fidelity MSCI Information Technology Index ETF (US:FTEC) , Fidelity Covington Trust - Fidelity Enhanced Small Cap ETF (US:FESM) , Fidelity Covington Trust - Fidelity MSCI Financials Index ETF (US:FNCL) , and Fidelity Covington Trust - Fidelity MSCI Health Care Index ETF (US:FHLC) .
Peningkatan Tertinggi Kuartal Ini
Kami menggunakan perubahan dalam alokasi portofolio karena ini adalah metrik yang paling bermakna. Perubahan dapat disebabkan oleh perdagangan atau perubahan harga saham.
| Keamanan | Saham (MM) |
Nilai (Juta Dolar AS) |
Portfolio % | ΔPorsyento ng Portfolio |
|---|---|---|---|---|
| 0.07 | 34.24 | 7.0112 | 1.4122 | |
| 0.05 | 19.00 | 3.8895 | 1.1602 | |
| 0.05 | 8.04 | 1.6453 | 0.6961 | |
| 0.29 | 25.77 | 5.2758 | 0.6177 | |
| 0.01 | 5.35 | 1.0945 | 0.5259 | |
| 0.09 | 22.42 | 4.5896 | 0.3753 | |
| 0.02 | 13.02 | 2.6659 | 0.3564 | |
| 0.05 | 14.46 | 2.9615 | 0.3555 | |
| 0.19 | 13.99 | 2.8652 | 0.3099 | |
| 0.03 | 7.00 | 1.4326 | 0.2739 |
Penurunan Tertinggi Kuartal Ini
Kami menggunakan perubahan dalam alokasi portofolio karena ini adalah metrik yang paling bermakna. Perubahan dapat disebabkan oleh perdagangan atau perubahan harga saham.
| Keamanan | Saham (MM) |
Nilai (Juta Dolar AS) |
Portfolio % | ΔPorsyento ng Portfolio |
|---|---|---|---|---|
| 0.02 | 7.31 | 1.4962 | -1.8332 | |
| 0.05 | 8.38 | 1.7165 | -0.9462 | |
| 0.22 | 15.52 | 3.1770 | -0.6929 | |
| 0.13 | 21.90 | 4.4843 | -0.5678 | |
| 0.12 | 25.96 | 5.3147 | -0.3954 | |
| 0.09 | 19.79 | 4.0520 | -0.3782 | |
| 0.03 | 12.49 | 2.5564 | -0.3286 | |
| 0.03 | 13.56 | 2.7759 | -0.3235 | |
| 0.05 | 16.11 | 3.2990 | -0.2706 | |
| 0.06 | 14.25 | 2.9174 | -0.1455 |
Pengajuan 13F dan Dana
Formulir ini diajukan pada 2025-08-06 untuk periode pelaporan 2025-06-30. Klik ikon tautan untuk melihat riwayat transaksi selengkapnya.
Tingkatkan ke versi premium untuk membuka data premium dan ekspor ke Excel. ![]() .
.
| Keamanan | Ketik | Harga Saham Rata-rata | Saham (MM) |
ΔSaham (%) |
ΔSaham (%) |
Nilai ($MM) |
Portpolyo (%) |
ΔPortofolio (%) |
|
|---|---|---|---|---|---|---|---|---|---|
| MSFT / Microsoft Corporation | 0.07 | -2.71 | 34.24 | 28.92 | 7.0112 | 1.4122 | |||
| CHKP / Check Point Software Technologies Ltd. | 0.12 | -1.29 | 25.96 | -4.18 | 5.3147 | -0.3954 | |||
| NDAQ / Nasdaq, Inc. | 0.29 | -1.08 | 25.77 | 16.60 | 5.2758 | 0.6177 | |||
| WSM / Williams-Sonoma, Inc. | 0.14 | -0.09 | 23.09 | 3.24 | 4.7280 | 0.0133 | |||
| LH / Labcorp Holdings Inc. | 0.09 | -0.59 | 22.42 | 12.12 | 4.5896 | 0.3753 | |||
| XPRO / Expro Group Holdings N.V. | 0.13 | 17.05 | 21.90 | -8.62 | 4.4843 | -0.5678 | |||
| LOW / Lowe's Companies, Inc. | 0.09 | -1.02 | 19.79 | -5.83 | 4.0520 | -0.3782 | |||
| PWR / Quanta Services, Inc. | 0.05 | -1.36 | 19.00 | 46.72 | 3.8895 | 1.1602 | |||
| KEYS / Keysight Technologies, Inc. | 0.12 | 0.55 | 18.86 | 10.01 | 3.8625 | 0.2476 | |||
| SNA / Snap-on Incorporated | 0.05 | 3.04 | 16.11 | -4.85 | 3.2990 | -0.2706 | |||
| OMC / Omnicom Group Inc. | 0.22 | -2.59 | 15.52 | -15.48 | 3.1770 | -0.6929 | |||
| WDAY / Workday, Inc. | 0.06 | 2.56 | 14.84 | 5.40 | 3.0378 | 0.0705 | |||
| CRM / Salesforce, Inc. | 0.05 | 15.14 | 14.46 | 17.00 | 2.9615 | 0.3555 | |||
| BR / Broadridge Financial Solutions, Inc. | 0.06 | -2.17 | 14.25 | -1.94 | 2.9174 | -0.1455 | |||
| PYPL / PayPal Holdings, Inc. | 0.19 | 1.35 | 13.99 | 15.43 | 2.8652 | 0.3099 | |||
| VRTX / Vertex Pharmaceuticals Incorporated | 0.03 | 0.41 | 13.56 | -7.79 | 2.7759 | -0.3235 | |||
| URI / United Rentals, Inc. | 0.02 | -1.14 | 13.02 | 18.84 | 2.6659 | 0.3564 | |||
| TFC / Truist Financial Corporation | 0.30 | 3.82 | 12.99 | 8.46 | 2.6589 | 0.1350 | |||
| CB / Chubb Limited | 0.04 | 2.23 | 12.70 | -1.92 | 2.6010 | -0.1294 | |||
| TMO / Thermo Fisher Scientific Inc. | 0.03 | 11.96 | 12.49 | -8.78 | 2.5564 | -0.3286 | |||
| LULU / lululemon athletica inc. | 0.04 | 36.89 | 9.18 | 14.91 | 1.8798 | 0.1955 | |||
| BDX / Becton, Dickinson and Company | 0.05 | -11.74 | 8.38 | -33.63 | 1.7165 | -0.9462 | |||
| ACN / Accenture plc | 0.03 | 6.53 | 8.36 | 2.04 | 1.7126 | -0.0153 | |||
| GOOGL / Alphabet Inc. | 0.05 | 56.59 | 8.04 | 78.44 | 1.6453 | 0.6961 | |||
| JPM / JPMorgan Chase & Co. | 0.03 | -0.84 | 7.67 | 17.19 | 1.5701 | 0.1909 | |||
| UNH / UnitedHealth Group Incorporated | 0.02 | -22.33 | 7.31 | -53.74 | 1.4962 | -1.8332 | |||
| AMZN / Amazon.com, Inc. | 0.03 | 10.39 | 7.00 | 27.29 | 1.4326 | 0.2739 | |||
| GS / The Goldman Sachs Group, Inc. | 0.01 | 52.96 | 5.35 | 98.18 | 1.0945 | 0.5259 | |||
| AAPL / Apple Inc. | 0.02 | -0.20 | 5.13 | -7.80 | 1.0500 | -0.1227 | |||
| SO / The Southern Company | 0.03 | 0.00 | 2.81 | -0.14 | 0.5744 | -0.0177 | |||
| GBTC / Grayscale Bitcoin Trust (BTC) | 0.03 | -30.61 | 2.62 | -9.67 | 0.5374 | -0.0752 | |||
| GLD / SPDR Gold Trust | 0.01 | 0.59 | 2.58 | 6.40 | 0.5280 | 0.0172 | |||
| TT / Trane Technologies plc | 0.01 | -1.73 | 2.48 | 27.57 | 0.5080 | 0.0980 | |||
| HON / Honeywell International Inc. | 0.01 | 1.41 | 2.42 | 11.52 | 0.4958 | 0.0381 | |||
| JNJ / Johnson & Johnson | 0.01 | -3.94 | 1.92 | -11.54 | 0.3925 | -0.0642 | |||
| PFF / iShares Trust - iShares Preferred and Income Securities ETF | 0.06 | 1.33 | 1.81 | 1.17 | 0.3709 | -0.0066 | |||
| WM / Waste Management, Inc. | 0.01 | -0.07 | 1.74 | -1.25 | 0.3558 | -0.0151 | |||
| IVV / iShares Trust - iShares Core S&P 500 ETF | 0.00 | -12.62 | 1.73 | -3.46 | 0.3539 | -0.0234 | |||
| INTU / Intuit Inc. | 0.00 | 0.69 | 1.72 | 29.18 | 0.3528 | 0.0716 | |||
| ISRG / Intuitive Surgical, Inc. | 0.00 | -21.39 | 1.60 | -13.77 | 0.3271 | -0.0633 | |||
| META / Meta Platforms, Inc. | 0.00 | 5.79 | 1.55 | 35.58 | 0.3176 | 0.0762 | |||
| BK / The Bank of New York Mellon Corporation | 0.02 | 0.00 | 1.42 | 8.63 | 0.2915 | 0.0152 | |||
| ZBRA / Zebra Technologies Corporation | 0.00 | 0.00 | 1.34 | 9.11 | 0.2750 | 0.0156 | |||
| FMDE / Fidelity Covington Trust - Fidelity Enhanced Mid Cap ETF | 0.03 | 1.09 | 0.2236 | 0.2236 | |||||
| VOO / Vanguard Index Funds - Vanguard S&P 500 ETF | 0.00 | 0.00 | 0.98 | 10.52 | 0.2002 | 0.0137 | |||
| COST / Costco Wholesale Corporation | 0.00 | 0.00 | 0.92 | 4.68 | 0.1881 | 0.0031 | |||
| FTEC / Fidelity Covington Trust - Fidelity MSCI Information Technology Index ETF | 0.00 | 0.88 | 0.1811 | 0.1811 | |||||
| PLTR / Palantir Technologies Inc. | 0.01 | -2.27 | 0.88 | 57.81 | 0.1800 | 0.0626 | |||
| AEM / Agnico Eagle Mines Limited | 0.01 | -12.50 | 0.83 | -4.04 | 0.1705 | -0.0124 | |||
| FDX / FedEx Corporation | 0.00 | 0.00 | 0.80 | -6.75 | 0.1640 | -0.0171 | |||
| PFE / Pfizer Inc. | 0.03 | -0.91 | 0.80 | -5.24 | 0.1629 | -0.0140 | |||
| DHR / Danaher Corporation | 0.00 | -24.56 | 0.76 | -27.33 | 0.1553 | -0.0646 | |||
| PEP / PepsiCo, Inc. | 0.01 | -18.02 | 0.75 | -27.88 | 0.1537 | -0.0655 | |||
| LLY / Eli Lilly and Company | 0.00 | -10.09 | 0.73 | -15.13 | 0.1494 | -0.0318 | |||
| UNP / Union Pacific Corporation | 0.00 | 0.00 | 0.70 | -2.66 | 0.1425 | -0.0081 | |||
| MRK / Merck & Co., Inc. | 0.01 | 2.39 | 0.68 | -9.73 | 0.1387 | -0.0194 | |||
| HD / The Home Depot, Inc. | 0.00 | 1.46 | 0.64 | 1.44 | 0.1303 | -0.0019 | |||
| MMC / Marsh & McLennan Companies, Inc. | 0.00 | -1.72 | 0.62 | -11.88 | 0.1276 | -0.0216 | |||
| XOM / Exxon Mobil Corporation | 0.01 | 0.00 | 0.61 | -9.31 | 0.1258 | -0.0171 | |||
| AGI / Alamos Gold Inc. | 0.02 | 0.00 | 0.61 | -0.65 | 0.1245 | -0.0045 | |||
| AMP / Ameriprise Financial, Inc. | 0.00 | 4.61 | 0.61 | 15.24 | 0.1240 | 0.0133 | |||
| IJH / iShares Trust - iShares Core S&P Mid-Cap ETF | 0.01 | -19.87 | 0.58 | -14.87 | 0.1197 | -0.0250 | |||
| CVX / Chevron Corporation | 0.00 | 0.00 | 0.58 | -14.54 | 0.1194 | -0.0242 | |||
| ADP / Automatic Data Processing, Inc. | 0.00 | 1.79 | 0.58 | 2.85 | 0.1184 | -0.0002 | |||
| NVDA / NVIDIA Corporation | 0.00 | 0.00 | 0.57 | 45.64 | 0.1165 | 0.0342 | |||
| WMT / Walmart Inc. | 0.01 | 0.00 | 0.57 | 11.42 | 0.1160 | 0.0088 | |||
| ABT / Abbott Laboratories | 0.00 | -35.61 | 0.54 | -33.98 | 0.1114 | -0.0623 | |||
| NEM / Newmont Corporation | 0.01 | 0.00 | 0.52 | 20.74 | 0.1074 | 0.0158 | |||
| FESM / Fidelity Covington Trust - Fidelity Enhanced Small Cap ETF | 0.02 | 0.51 | 0.1054 | 0.1054 | |||||
| GJR / Strats Trust For Procter & Gambel Security - Preferred Security | 0.00 | -3.25 | 0.47 | -9.71 | 0.0972 | -0.0134 | |||
| IJR / iShares Trust - iShares Core S&P Small-Cap ETF | 0.00 | -25.46 | 0.47 | -22.24 | 0.0968 | -0.0311 | |||
| ETN / Eaton Corporation plc | 0.00 | 0.00 | 0.47 | 31.37 | 0.0960 | 0.0208 | |||
| XYL / Xylem Inc. | 0.00 | 0.00 | 0.46 | 8.20 | 0.0947 | 0.0047 | |||
| CSCO / Cisco Systems, Inc. | 0.01 | 0.00 | 0.46 | 12.32 | 0.0936 | 0.0079 | |||
| NVT / nVent Electric plc | 0.01 | 0.00 | 0.46 | 40.00 | 0.0932 | 0.0245 | |||
| FNCL / Fidelity Covington Trust - Fidelity MSCI Financials Index ETF | 0.01 | 0.45 | 0.0926 | 0.0926 | |||||
| FHLC / Fidelity Covington Trust - Fidelity MSCI Health Care Index ETF | 0.01 | 0.44 | 0.0911 | 0.0911 | |||||
| PEG / Public Service Enterprise Group Incorporated | 0.01 | -0.58 | 0.43 | 1.66 | 0.0879 | -0.0011 | |||
| BTC / Grayscale Bitcoin Mini Trust | 0.01 | 0.00 | 0.43 | 30.77 | 0.0872 | 0.0186 | |||
| MET / MetLife, Inc. | 0.01 | 0.00 | 0.40 | 0.00 | 0.0829 | -0.0023 | |||
| NFLX / Netflix, Inc. | 0.00 | 0.00 | 0.40 | 43.73 | 0.0823 | 0.0233 | |||
| FIDU / Fidelity Covington Trust - Fidelity MSCI Industrials Index ETF | 0.01 | 0.40 | 0.0813 | 0.0813 | |||||
| RTX / RTX Corporation | 0.00 | -3.97 | 0.35 | 6.01 | 0.0724 | 0.0020 | |||
| DIS / The Walt Disney Company | 0.00 | 0.35 | 0.35 | 26.16 | 0.0722 | 0.0133 | |||
| BGH / Barings Global Short Duration High Yield Fund | 0.02 | 1.28 | 0.33 | 3.11 | 0.0680 | 0.0001 | |||
| AMGN / Amgen Inc. | 0.00 | 0.00 | 0.33 | -10.30 | 0.0678 | -0.0101 | |||
| COP / ConocoPhillips | 0.00 | 0.00 | 0.32 | -14.44 | 0.0656 | -0.0134 | |||
| FDIS / Fidelity Covington Trust - Fidelity MSCI Consumer Discretionary Index ETF | 0.00 | 0.30 | 0.0624 | 0.0624 | |||||
| GOOGL / Alphabet Inc. | 0.00 | 0.00 | 0.30 | 13.48 | 0.0622 | 0.0058 | |||
| PNC / The PNC Financial Services Group, Inc. | 0.00 | 0.00 | 0.28 | 6.04 | 0.0577 | 0.0017 | |||
| AVGO / Broadcom Inc. | 0.00 | 0.28 | 0.0564 | 0.0564 | |||||
| SPY / SPDR S&P 500 ETF | 0.00 | 0.00 | 0.26 | 10.68 | 0.0531 | 0.0036 | |||
| OPOF / Old Point Financial Corporation | 0.01 | 0.25 | 0.0509 | 0.0509 | |||||
| IBM / International Business Machines Corporation | 0.00 | 0.00 | 0.24 | 18.54 | 0.0498 | 0.0066 | |||
| ABBV / AbbVie Inc. | 0.00 | 0.00 | 0.24 | -11.40 | 0.0494 | -0.0080 | |||
| PGF / Invesco Exchange-Traded Fund Trust - Invesco Financial Preferred ETF | 0.02 | 0.00 | 0.23 | -1.30 | 0.0468 | -0.0020 | |||
| USB / U.S. Bancorp | 0.01 | 0.00 | 0.23 | 7.11 | 0.0463 | 0.0018 | |||
| ORCL / Oracle Corporation | 0.00 | 0.22 | 0.0445 | 0.0445 | |||||
| XLK / The Select Sector SPDR Trust - The Technology Select Sector SPDR Fund | 0.00 | 0.21 | 0.0430 | 0.0430 | |||||
| KO / The Coca-Cola Company | 0.00 | 0.00 | 0.20 | -0.98 | 0.0414 | -0.0017 | |||
| FCOM / Fidelity Covington Trust - Fidelity MSCI Communication Services Index ETF | 0.00 | 0.20 | 0.0413 | 0.0413 | |||||
| VUZI / Vuzix Corporation | 0.02 | 0.00 | 0.07 | 45.65 | 0.0138 | 0.0039 | |||
| HL / Hecla Mining Company | 0.00 | -100.00 | 0.00 | 0.0000 | |||||
| HSY / The Hershey Company | 0.00 | -100.00 | 0.00 | 0.0000 | |||||
| FTV / Fortive Corporation | 0.00 | -100.00 | 0.00 | 0.0000 | |||||
| ED / Consolidated Edison, Inc. | 0.00 | -100.00 | 0.00 | 0.0000 |