Mga Batayang Estadistika
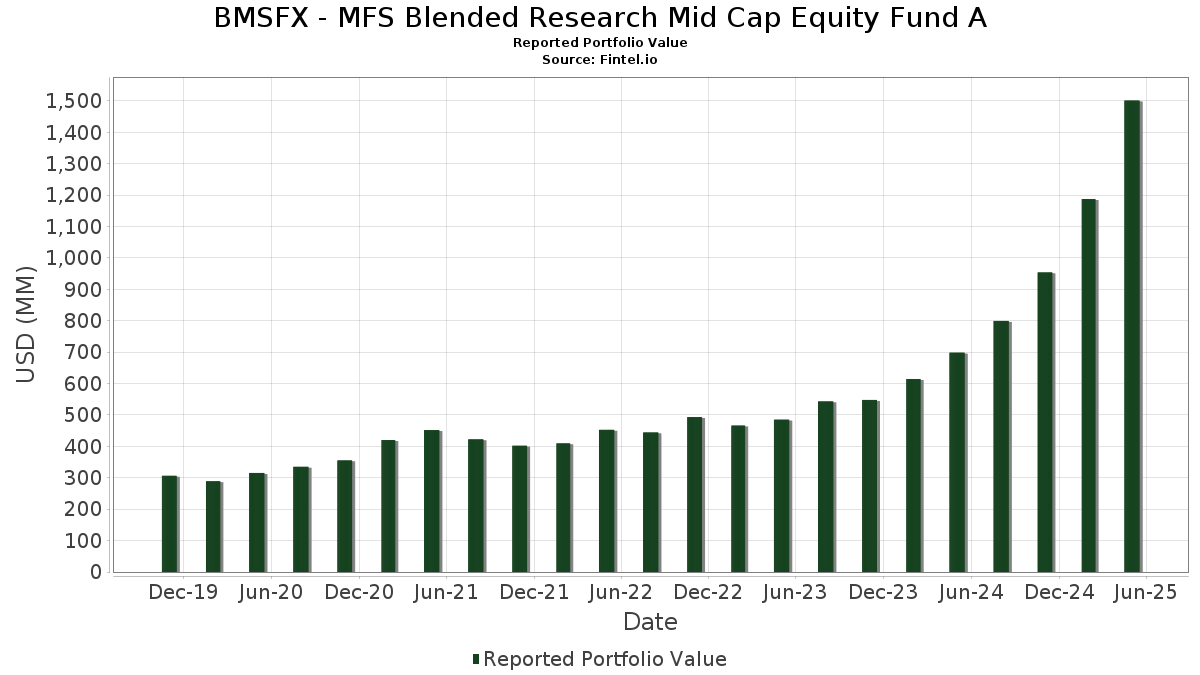
| Nilai Portofolio | $ 1,501,088,368 |
| Posisi Saat Ini | 148 |
Kepemilikan Terbaru, Kinerja, AUM (dari 13F, 13D)
BMSFX - MFS Blended Research Mid Cap Equity Fund A telah mengungkapkan total kepemilikan 148 dalam pengajuan SEC terbaru mereka. Nilai portofolio terbaru dihitung sebesar $ 1,501,088,368 USD. Aset yang Dikelola (AUM) sebenarnya adalah nilai ini ditambah kas (yang tidak diungkapkan). Aset-aset utama BMSFX - MFS Blended Research Mid Cap Equity Fund A adalah NRG Energy, Inc. (US:NRG) , Ameriprise Financial, Inc. (US:AMP) , Westinghouse Air Brake Technologies Corporation (US:WAB) , Veeva Systems Inc. (US:VEEV) , and Roblox Corporation (US:RBLX) . Posisi baru BMSFX - MFS Blended Research Mid Cap Equity Fund A meliputi: Entergy Corporation (MX:ETR) , Humana Inc. (US:HUM) , Palantir Technologies Inc. (US:PLTR) , Ameren Corporation (US:AEE) , and International Paper Company (MX:IP) .
Peningkatan Tertinggi Kuartal Ini
Kami menggunakan perubahan dalam alokasi portofolio karena ini adalah metrik yang paling bermakna. Perubahan dapat disebabkan oleh perdagangan atau perubahan harga saham.
| Keamanan | Saham (MM) |
Nilai (Juta Dolar AS) |
Portfolio % | ΔPorsyento ng Portfolio |
|---|---|---|---|---|
| 0.30 | 26.13 | 1.7373 | 1.0591 | |
| 0.16 | 13.10 | 0.8709 | 0.8709 | |
| 0.05 | 11.90 | 0.7915 | 0.7915 | |
| 0.20 | 30.79 | 2.0475 | 0.6902 | |
| 0.07 | 8.58 | 0.5707 | 0.5707 | |
| 0.34 | 19.05 | 1.2667 | 0.5242 | |
| 0.13 | 9.98 | 0.6635 | 0.5188 | |
| 0.03 | 7.60 | 0.5055 | 0.5055 | |
| 0.07 | 6.72 | 0.4471 | 0.4471 | |
| 0.04 | 6.43 | 0.4277 | 0.4277 |
Penurunan Tertinggi Kuartal Ini
Kami menggunakan perubahan dalam alokasi portofolio karena ini adalah metrik yang paling bermakna. Perubahan dapat disebabkan oleh perdagangan atau perubahan harga saham.
| Keamanan | Saham (MM) |
Nilai (Juta Dolar AS) |
Portfolio % | ΔPorsyento ng Portfolio |
|---|---|---|---|---|
| 0.01 | 2.26 | 0.1504 | -1.3024 | |
| 0.01 | 9.19 | 0.6112 | -1.0156 | |
| 0.05 | 8.32 | 0.5530 | -0.8948 | |
| 0.33 | 11.32 | 0.7526 | -0.7635 | |
| 11.42 | 11.42 | 0.7593 | -0.7531 | |
| 0.27 | 8.82 | 0.5867 | -0.4194 | |
| 0.85 | 7.81 | 0.5194 | -0.3018 | |
| 0.24 | 7.65 | 0.5088 | -0.2626 | |
| 0.09 | 12.31 | 0.8182 | -0.2580 | |
| 0.22 | 17.30 | 1.1502 | -0.2538 |
Pengajuan 13F dan Dana
Formulir ini diajukan pada 2025-07-25 untuk periode pelaporan 2025-05-31. Klik ikon tautan untuk melihat riwayat transaksi selengkapnya.
Tingkatkan ke versi premium untuk membuka data premium dan ekspor ke Excel. ![]() .
.
| Keamanan | Ketik | Harga Saham Rata-rata | Saham (MM) |
ΔSaham (%) |
ΔSaham (%) |
Nilai ($MM) |
Portpolyo (%) |
ΔPortofolio (%) |
|
|---|---|---|---|---|---|---|---|---|---|
| NRG / NRG Energy, Inc. | 0.20 | 29.21 | 30.79 | 90.55 | 2.0475 | 0.6902 | |||
| AMP / Ameriprise Financial, Inc. | 0.06 | 29.21 | 29.44 | 22.46 | 1.9575 | -0.0617 | |||
| WAB / Westinghouse Air Brake Technologies Corporation | 0.13 | 29.21 | 26.60 | 41.03 | 1.7688 | 0.1845 | |||
| VEEV / Veeva Systems Inc. | 0.09 | 7.63 | 26.43 | 34.31 | 1.7572 | 0.1046 | |||
| RBLX / Roblox Corporation | 0.30 | 136.77 | 26.13 | 223.63 | 1.7373 | 1.0591 | |||
| VRSK / Verisk Analytics, Inc. | 0.08 | 22.78 | 26.03 | 29.90 | 1.7311 | 0.0478 | |||
| FTI / TechnipFMC plc | 0.77 | 29.21 | 23.94 | 36.71 | 1.5917 | 0.1210 | |||
| SPOT / Spotify Technology S.A. | 0.04 | 29.21 | 23.94 | 41.35 | 1.5916 | 0.1692 | |||
| US21871X1090 / Corebridge Financial, Inc. | 0.73 | 29.21 | 23.93 | 21.49 | 1.5912 | -0.0632 | |||
| CNH / CNH Industrial N.V. | 1.89 | 29.21 | 23.62 | 25.50 | 1.5707 | -0.0103 | |||
| HIG / The Hartford Insurance Group, Inc. | 0.18 | 10.24 | 23.56 | 21.02 | 1.5662 | -0.0686 | |||
| ORLY / O'Reilly Automotive, Inc. | 0.02 | 29.20 | 23.11 | 28.62 | 1.5367 | 0.0275 | |||
| BPOP / Popular, Inc. | 0.22 | 29.21 | 23.06 | 33.19 | 1.5331 | 0.0791 | |||
| SYF / Synchrony Financial | 0.39 | 42.62 | 22.51 | 35.50 | 1.4965 | 0.1014 | |||
| ARMK / Aramark | 0.55 | 34.67 | 22.33 | 47.21 | 1.4850 | 0.2107 | |||
| GDDY / GoDaddy Inc. | 0.12 | 43.04 | 21.72 | 45.15 | 1.4445 | 0.1874 | |||
| Aptiv plc / EC (JE00BTDN8H13) | 0.32 | 29.21 | 21.55 | 32.56 | 1.4329 | 0.0675 | |||
| GWRE / Guidewire Software, Inc. | 0.10 | 29.21 | 21.53 | 38.00 | 1.4317 | 0.1212 | |||
| GIS / General Mills, Inc. | 0.39 | 29.21 | 21.34 | 15.65 | 1.4192 | -0.1309 | |||
| NTRS / Northern Trust Corporation | 0.20 | 21.73 | 21.25 | 17.89 | 1.4127 | -0.1010 | |||
| UHS / Universal Health Services, Inc. | 0.11 | 41.02 | 20.90 | 53.18 | 1.3898 | 0.2437 | |||
| APH / Amphenol Corporation | 0.22 | 29.21 | 20.16 | 74.47 | 1.3408 | 0.3700 | |||
| LDOS / Leidos Holdings, Inc. | 0.14 | 5.72 | 20.14 | 20.81 | 1.3389 | -0.0611 | |||
| RPM / RPM International Inc. | 0.17 | 29.21 | 19.20 | 18.72 | 1.2767 | -0.0817 | |||
| RJF / Raymond James Financial, Inc. | 0.13 | 29.20 | 19.15 | 22.78 | 1.2731 | -0.0367 | |||
| EIX / Edison International | 0.34 | 110.81 | 19.05 | 115.51 | 1.2667 | 0.5242 | |||
| APP / AppLovin Corporation | 0.05 | 10.36 | 19.04 | 33.16 | 1.2660 | 0.0650 | |||
| HIW / Highwoods Properties, Inc. | 0.64 | 25.56 | 18.88 | 28.01 | 1.2552 | 0.0166 | |||
| EG / Everest Group, Ltd. | 0.05 | 29.21 | 18.66 | 27.00 | 1.2410 | 0.0067 | |||
| DDOG / Datadog, Inc. | 0.16 | 29.21 | 18.63 | 30.68 | 1.2387 | 0.0414 | |||
| TCBI / Texas Capital Bancshares, Inc. | 0.25 | 37.59 | 18.19 | 24.61 | 1.2097 | -0.0166 | |||
| PSX / Phillips 66 | 0.16 | 29.21 | 17.72 | 13.06 | 1.1780 | -0.1382 | |||
| VLO / Valero Energy Corporation | 0.14 | 35.19 | 17.65 | 33.36 | 1.1737 | 0.0620 | |||
| MAS / Masco Corporation | 0.28 | 29.21 | 17.51 | 7.27 | 1.1643 | -0.2067 | |||
| MTB / M&T Bank Corporation | 0.10 | 10.94 | 17.38 | 5.69 | 1.1558 | -0.2256 | |||
| EMN / Eastman Chemical Company | 0.22 | 29.21 | 17.30 | 3.48 | 1.1502 | -0.2538 | |||
| JLL / Jones Lang LaSalle Incorporated | 0.08 | 29.21 | 16.87 | 5.83 | 1.1219 | -0.2172 | |||
| VFC / V.F. Corporation | 1.35 | 257.23 | 16.84 | 78.54 | 1.1198 | 0.3275 | |||
| BLDR / Builders FirstSource, Inc. | 0.15 | 43.76 | 16.45 | 11.37 | 1.0941 | -0.1468 | |||
| MHK / Mohawk Industries, Inc. | 0.16 | 29.20 | 16.20 | 10.55 | 1.0770 | -0.1537 | |||
| WPC / W. P. Carey Inc. | 0.25 | 29.21 | 15.54 | 26.29 | 1.0335 | -0.0002 | |||
| EXEL / Exelixis, Inc. | 0.36 | 29.21 | 15.48 | 43.73 | 1.0295 | 0.1247 | |||
| INGR / Ingredion Incorporated | 0.11 | 29.21 | 15.40 | 37.63 | 1.0242 | 0.0842 | |||
| AVNT / Avient Corporation | 0.42 | 29.21 | 15.04 | 9.15 | 1.0000 | -0.1573 | |||
| OKTA / Okta, Inc. | 0.14 | 29.21 | 14.25 | 47.30 | 0.9477 | 0.1351 | |||
| OMC / Omnicom Group Inc. | 0.19 | 15.12 | 13.81 | 2.15 | 0.9180 | -0.2172 | |||
| LAMR / Lamar Advertising Company | 0.11 | 29.21 | 13.48 | 25.37 | 0.8961 | -0.0068 | |||
| ETR / Entergy Corporation | 0.16 | 13.10 | 0.8709 | 0.8709 | |||||
| TXT / Textron Inc. | 0.18 | 57.49 | 13.00 | 56.02 | 0.8643 | 0.1645 | |||
| IQV / IQVIA Holdings Inc. | 0.09 | 29.21 | 12.31 | -3.96 | 0.8182 | -0.2580 | |||
| TXRH / Texas Roadhouse, Inc. | 0.06 | 29.20 | 12.25 | 37.01 | 0.8146 | 0.0636 | |||
| HUM / Humana Inc. | 0.05 | 11.90 | 0.7915 | 0.7915 | |||||
| UAL / United Airlines Holdings, Inc. | 0.15 | 29.21 | 11.70 | 9.41 | 0.7782 | -0.1202 | |||
| NFG / National Fuel Gas Company | 0.14 | 29.21 | 11.46 | 41.83 | 0.7623 | 0.0833 | |||
| US55291X1090 / MFS Institutional Money Market Portfolio | 11.42 | -36.58 | 11.42 | -36.58 | 0.7593 | -0.7531 | |||
| PPL / PPL Corporation | 0.33 | -36.46 | 11.32 | -37.29 | 0.7526 | -0.7635 | |||
| NWL / Newell Brands Inc. | 2.12 | 29.21 | 11.24 | 6.67 | 0.7476 | -0.1377 | |||
| NVST / Envista Holdings Corporation | 0.60 | 731.82 | 10.90 | 619.26 | 0.7250 | 0.2442 | |||
| SWK / Stanley Black & Decker, Inc. | 0.16 | 117.36 | 10.56 | 64.36 | 0.7023 | 0.1625 | |||
| INCY / Incyte Corporation | 0.16 | 47.18 | 10.53 | 30.28 | 0.7004 | 0.0213 | |||
| ZM / Zoom Communications Inc. | 0.13 | 29.21 | 10.51 | 42.44 | 0.6985 | 0.0791 | |||
| DBX / Dropbox, Inc. | 0.36 | 29.21 | 10.35 | 43.54 | 0.6879 | 0.0825 | |||
| USFD / US Foods Holding Corp. | 0.13 | 424.84 | 9.98 | 479.44 | 0.6635 | 0.5188 | |||
| TNET / TriNet Group, Inc. | 0.12 | -0.11 | 9.86 | 12.77 | 0.6554 | -0.0787 | |||
| SKYW / SkyWest, Inc. | 0.10 | 29.21 | 9.82 | 32.54 | 0.6527 | 0.0306 | |||
| CUZ / Cousins Properties Incorporated | 0.35 | 29.21 | 9.75 | 19.58 | 0.6483 | -0.0365 | |||
| JXN / Jackson Financial Inc. | 0.12 | 19.72 | 9.69 | 7.01 | 0.6442 | -0.1162 | |||
| ESS / Essex Property Trust, Inc. | 0.03 | 29.20 | 9.68 | 17.73 | 0.6439 | -0.0470 | |||
| MCK / McKesson Corporation | 0.01 | -57.77 | 9.19 | -52.55 | 0.6112 | -1.0156 | |||
| SLM / SLM Corporation | 0.27 | -31.30 | 8.82 | -26.34 | 0.5867 | -0.4194 | |||
| PLTR / Palantir Technologies Inc. | 0.07 | 8.58 | 0.5707 | 0.5707 | |||||
| CBRE / CBRE Group, Inc. | 0.07 | 29.20 | 8.52 | 13.81 | 0.5668 | -0.0623 | |||
| AME / AMETEK, Inc. | 0.05 | 29.21 | 8.50 | 22.00 | 0.5649 | -0.0200 | |||
| FLS / Flowserve Corporation | 0.17 | 29.21 | 8.35 | 17.15 | 0.5555 | -0.0434 | |||
| EXPE / Expedia Group, Inc. | 0.05 | -23.39 | 8.32 | -6.64 | 0.5530 | -0.8948 | |||
| CTRE / CareTrust REIT, Inc. | 0.28 | 29.21 | 8.19 | 43.63 | 0.5446 | 0.0657 | |||
| J / Jacobs Solutions Inc. | 0.06 | 53.04 | 8.16 | 50.89 | 0.5428 | 0.0884 | |||
| MLI / Mueller Industries, Inc. | 0.10 | 29.20 | 8.10 | 25.49 | 0.5385 | -0.0036 | |||
| MPWR / Monolithic Power Systems, Inc. | 0.01 | 29.23 | 7.83 | 40.00 | 0.5206 | 0.0509 | |||
| OGN / Organon & Co. | 0.85 | 29.21 | 7.81 | -20.10 | 0.5194 | -0.3018 | |||
| EPRT / Essential Properties Realty Trust, Inc. | 0.24 | -16.12 | 7.65 | -16.69 | 0.5088 | -0.2626 | |||
| VRSN / VeriSign, Inc. | 0.03 | 7.60 | 0.5055 | 0.5055 | |||||
| AR / Antero Resources Corporation | 0.20 | 29.21 | 7.59 | 31.86 | 0.5050 | 0.0212 | |||
| ILMN / Illumina, Inc. | 0.09 | -3.14 | 7.48 | -10.23 | 0.4976 | -0.2026 | |||
| ZBRA / Zebra Technologies Corporation | 0.03 | 13.38 | 7.48 | 4.30 | 0.4972 | -0.1051 | |||
| BIIB / Biogen Inc. | 0.06 | 29.21 | 7.41 | 19.36 | 0.4927 | -0.0287 | |||
| EQH / Equitable Holdings, Inc. | 0.14 | 466.69 | 7.22 | 444.75 | 0.4800 | 0.3686 | |||
| PFG / Principal Financial Group, Inc. | 0.09 | 107.00 | 6.83 | 81.06 | 0.4539 | 0.1373 | |||
| AEE / Ameren Corporation | 0.07 | 6.72 | 0.4471 | 0.4471 | |||||
| SPG / Simon Property Group, Inc. | 0.04 | 6.43 | 0.4277 | 0.4277 | |||||
| CTVA / Corteva, Inc. | 0.08 | 100.30 | 5.65 | 180.85 | 0.3753 | 0.0042 | |||
| PVH / PVH Corp. | 0.07 | -29.80 | 5.47 | -21.42 | 0.3637 | -0.2210 | |||
| AMKR / Amkor Technology, Inc. | 0.30 | 29.21 | 5.38 | 10.34 | 0.3578 | -0.0518 | |||
| HIMS / Hims & Hers Health, Inc. | 0.09 | 5.19 | 0.3450 | 0.3450 | |||||
| CRUS / Cirrus Logic, Inc. | 0.05 | 29.21 | 4.93 | 21.96 | 0.3280 | -0.0117 | |||
| BHF / Brighthouse Financial, Inc. | 0.08 | 29.21 | 4.69 | 30.31 | 0.3119 | 0.0095 | |||
| PEGA / Pegasystems Inc. | 0.05 | 74.90 | 4.63 | 118.64 | 0.3081 | 0.1301 | |||
| GAP / The Gap, Inc. | 0.20 | -10.87 | 4.36 | -12.06 | 0.2896 | -0.1263 | |||
| ACIW / ACI Worldwide, Inc. | 0.09 | 29.21 | 4.18 | 4.21 | 0.2780 | -0.0589 | |||
| QTWO / Q2 Holdings, Inc. | 0.05 | 143.60 | 4.17 | 144.05 | 0.2770 | 0.1336 | |||
| VOYA / Voya Financial, Inc. | 0.06 | 29.21 | 4.10 | 18.93 | 0.2729 | -0.0169 | |||
| SLVM / Sylvamo Corporation | 0.08 | 29.21 | 4.09 | -3.75 | 0.2717 | -0.0848 | |||
| DXCM / DexCom, Inc. | 0.05 | 4.00 | 0.2656 | 0.2656 | |||||
| EXE / Expand Energy Corporation | 0.03 | 29.20 | 3.83 | 51.76 | 0.2546 | 0.0427 | |||
| BBWI / Bath & Body Works, Inc. | 0.12 | 29.20 | 3.51 | 0.29 | 0.2334 | -0.0606 | |||
| UGI / UGI Corporation | 0.10 | 6.00 | 3.48 | 11.90 | 0.2313 | -0.0298 | |||
| GMS / GMS Inc. | 0.05 | -30.00 | 3.48 | -33.41 | 0.2313 | -0.2075 | |||
| TYL / Tyler Technologies, Inc. | 0.01 | -35.13 | 3.44 | -38.48 | 0.2286 | -0.2407 | |||
| BNL / Broadstone Net Lease, Inc. | 0.21 | 29.21 | 3.42 | 22.00 | 0.2272 | -0.0080 | |||
| COKE / Coca-Cola Consolidated, Inc. | 0.03 | 1,192.49 | 3.41 | 4.57 | 0.2269 | -0.0472 | |||
| PFGC / Performance Food Group Company | 0.04 | 29.21 | 3.23 | 35.93 | 0.2146 | 0.0152 | |||
| EAT / Brinker International, Inc. | 0.02 | 29.21 | 3.06 | 35.37 | 0.2034 | 0.0135 | |||
| IP / International Paper Company | 0.06 | 3.03 | 0.2016 | 0.2016 | |||||
| BILL / BILL Holdings, Inc. | 0.06 | 265.34 | 2.83 | 189.36 | 0.1880 | 0.1058 | |||
| CCL / Carnival Corporation & plc | 0.12 | 29.20 | 2.76 | 25.35 | 0.1838 | -0.0014 | |||
| PINS / Pinterest, Inc. | 0.08 | 29.21 | 2.51 | 8.70 | 0.1671 | -0.0271 | |||
| CSTM / Constellium SE | 0.20 | 29.21 | 2.47 | 37.80 | 0.1642 | 0.0137 | |||
| VC / Visteon Corporation | 0.03 | -13.63 | 2.32 | -15.93 | 0.1541 | -0.0774 | |||
| RGA / Reinsurance Group of America, Incorporated | 0.01 | 29.20 | 2.31 | 29.56 | 0.1536 | 0.0039 | |||
| VST / Vistra Corp. | 0.01 | -89.11 | 2.26 | -86.92 | 0.1504 | -1.3024 | |||
| KMPR / Kemper Corporation | 0.04 | 94.23 | 2.26 | 83.12 | 0.1501 | 0.0466 | |||
| SARO / StandardAero, Inc. | 0.07 | 29.20 | 2.03 | 34.24 | 0.1351 | 0.0080 | |||
| THG / The Hanover Insurance Group, Inc. | 0.01 | 106.01 | 2.00 | 112.63 | 0.1332 | 0.0541 | |||
| LNTH / Lantheus Holdings, Inc. | 0.03 | -30.14 | 1.95 | -43.75 | 0.1296 | -0.1614 | |||
| WNS / WNS (Holdings) Limited | 0.03 | 29.21 | 1.94 | 31.75 | 0.1292 | 0.0053 | |||
| LNC / Lincoln National Corporation | 0.06 | 29.21 | 1.84 | 9.78 | 0.1224 | -0.0184 | |||
| AXS / AXIS Capital Holdings Limited | 0.02 | 29.21 | 1.79 | 38.47 | 0.1190 | 0.0104 | |||
| UFPI / UFP Industries, Inc. | 0.02 | 29.20 | 1.77 | 17.81 | 0.1174 | -0.0085 | |||
| AVT / Avnet, Inc. | 0.03 | 1.50 | 0.0996 | 0.0996 | |||||
| OC / Owens Corning | 0.01 | 29.19 | 1.49 | 12.34 | 0.0993 | -0.0124 | |||
| OPCH / Option Care Health, Inc. | 0.04 | 1.23 | 0.0818 | 0.0818 | |||||
| LOPE / Grand Canyon Education, Inc. | 0.01 | 29.23 | 1.17 | 42.18 | 0.0780 | 0.0087 | |||
| COLM / Columbia Sportswear Company | 0.02 | 1.14 | 0.0759 | 0.0759 | |||||
| AIN / Albany International Corp. | 0.02 | 29.20 | 1.14 | 11.47 | 0.0756 | -0.0101 | |||
| AIZ / Assurant, Inc. | 0.01 | 29.14 | 1.11 | 26.16 | 0.0741 | -0.0001 | |||
| TAP / Molson Coors Beverage Company | 0.02 | 1.03 | 0.0684 | 0.0684 | |||||
| LNG / Cheniere Energy, Inc. | 0.00 | 29.18 | 0.94 | 34.09 | 0.0628 | 0.0036 | |||
| DTE / DTE Energy Company | 0.01 | 29.17 | 0.92 | 32.00 | 0.0615 | 0.0027 | |||
| MWA / Mueller Water Products, Inc. | 0.03 | 29.21 | 0.84 | 23.05 | 0.0557 | -0.0015 | |||
| DKNG / DraftKings Inc. | 0.02 | 0.84 | 0.0555 | 0.0555 | |||||
| PNR / Pentair plc | 0.01 | 0.82 | 0.0542 | 0.0542 | |||||
| AEIS / Advanced Energy Industries, Inc. | 0.01 | 29.24 | 0.74 | 28.82 | 0.0494 | 0.0010 | |||
| VTR / Ventas, Inc. | 0.01 | 0.70 | 0.0466 | 0.0466 | |||||
| FORM / FormFactor, Inc. | 0.02 | 29.20 | 0.46 | 15.87 | 0.0306 | -0.0028 | |||
| DEI / Douglas Emmett, Inc. | 0.03 | -66.05 | 0.46 | -72.09 | 0.0303 | -0.1067 | |||
| BCC / Boise Cascade Company | 0.00 | 28.03 | 0.43 | 7.48 | 0.0287 | -0.0051 | |||
| NOV / NOV Inc. | 0.03 | 26.41 | 0.39 | 1.55 | 0.0262 | -0.0063 | |||
| AMTM / Amentum Holdings, Inc. | 0.00 | 0.08 | 0.0053 | 0.0053 | |||||
| SON / Sonoco Products Company | 0.00 | -100.00 | 0.00 | -100.00 | -0.0606 |