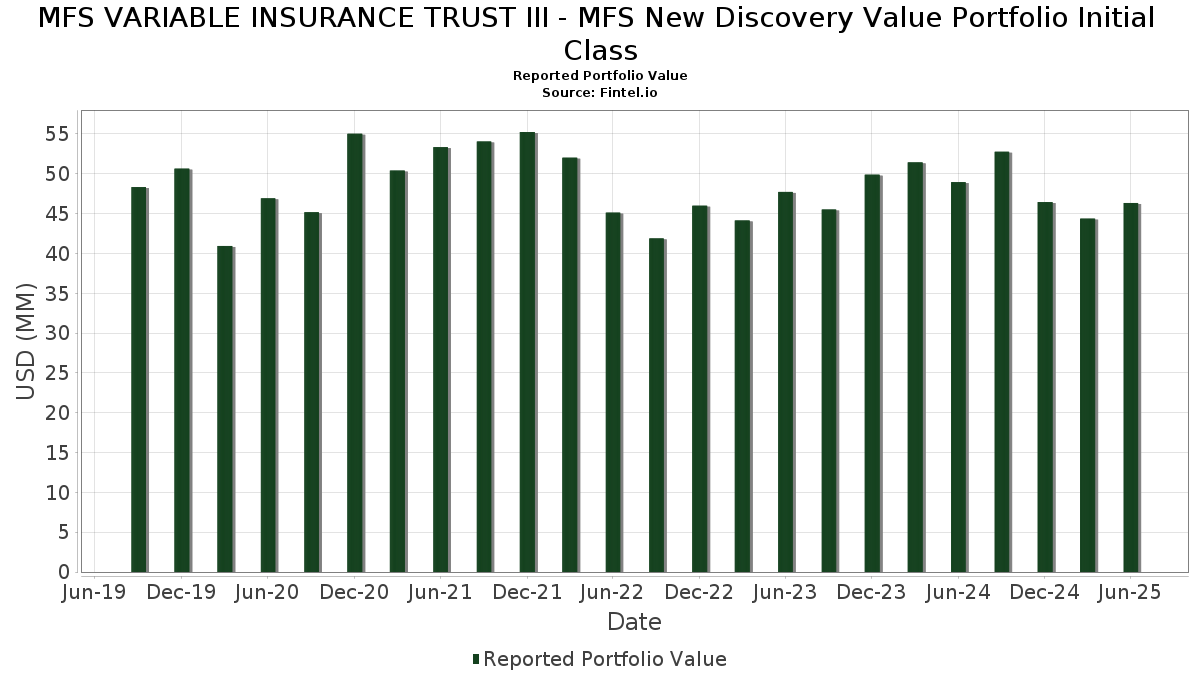
Mga Batayang Estadistika
| Nilai Portofolio | $ 46,337,637 |
| Posisi Saat Ini | 127 |
Kepemilikan Terbaru, Kinerja, AUM (dari 13F, 13D)
MFS VARIABLE INSURANCE TRUST III - MFS New Discovery Value Portfolio Initial Class telah mengungkapkan total kepemilikan 127 dalam pengajuan SEC terbaru mereka. Nilai portofolio terbaru dihitung sebesar $ 46,337,637 USD. Aset yang Dikelola (AUM) sebenarnya adalah nilai ini ditambah kas (yang tidak diungkapkan). Aset-aset utama MFS VARIABLE INSURANCE TRUST III - MFS New Discovery Value Portfolio Initial Class adalah MFS Institutional Money Market Portfolio (US:US55291X1090) , Popular, Inc. (US:BPOP) , TTM Technologies, Inc. (US:TTMI) , Prosperity Bancshares, Inc. (US:PB) , and Pacific Premier Bancorp, Inc. (US:PPBI) . Posisi baru MFS VARIABLE INSURANCE TRUST III - MFS New Discovery Value Portfolio Initial Class meliputi: SmartStop Self Storage REIT, Inc. (US:SMA) , M/I Homes, Inc. (US:MHO) , Advanced Energy Industries, Inc. (US:AEIS) , Mirion Technologies, Inc. (US:MIR) , and Nexstar Media Group, Inc. (US:NXST) .
Peningkatan Tertinggi Kuartal Ini
Kami menggunakan perubahan dalam alokasi portofolio karena ini adalah metrik yang paling bermakna. Perubahan dapat disebabkan oleh perdagangan atau perubahan harga saham.
| Keamanan | Saham (MM) |
Nilai (Juta Dolar AS) |
Portfolio % | ΔPorsyento ng Portfolio |
|---|---|---|---|---|
| 0.00 | 0.46 | 0.9838 | 0.8912 | |
| 0.01 | 0.40 | 0.8685 | 0.8685 | |
| 0.00 | 0.37 | 0.8049 | 0.8049 | |
| 0.00 | 0.32 | 0.6940 | 0.6940 | |
| 0.02 | 0.63 | 1.3634 | 0.6819 | |
| 0.01 | 0.31 | 0.6760 | 0.6760 | |
| 0.00 | 0.30 | 0.6559 | 0.6559 | |
| 0.01 | 0.30 | 0.6442 | 0.6442 | |
| 0.01 | 0.29 | 0.6224 | 0.6224 | |
| 0.01 | 0.28 | 0.6077 | 0.6077 |
Penurunan Tertinggi Kuartal Ini
Kami menggunakan perubahan dalam alokasi portofolio karena ini adalah metrik yang paling bermakna. Perubahan dapat disebabkan oleh perdagangan atau perubahan harga saham.
| Keamanan | Saham (MM) |
Nilai (Juta Dolar AS) |
Portfolio % | ΔPorsyento ng Portfolio |
|---|---|---|---|---|
| 0.00 | 0.00 | -0.8633 | ||
| 0.00 | 0.02 | 0.0403 | -0.7378 | |
| 0.07 | 0.07 | 0.1414 | -0.5773 | |
| 0.00 | 0.44 | 0.9579 | -0.4357 | |
| 0.00 | 0.00 | -0.3853 | ||
| 0.01 | 0.49 | 1.0661 | -0.3603 | |
| 0.01 | 0.33 | 0.7048 | -0.2623 | |
| 0.01 | 0.36 | 0.7867 | -0.1851 | |
| 0.02 | 0.43 | 0.9271 | -0.1798 | |
| 0.00 | 0.40 | 0.8606 | -0.1743 |
Pengajuan 13F dan Dana
Formulir ini diajukan pada 2025-08-25 untuk periode pelaporan 2025-06-30. Klik ikon tautan untuk melihat riwayat transaksi selengkapnya.
Tingkatkan ke versi premium untuk membuka data premium dan ekspor ke Excel. ![]() .
.
| Keamanan | Ketik | Harga Saham Rata-rata | Saham (MM) |
ΔSaham (%) |
ΔSaham (%) |
Nilai ($MM) |
Portpolyo (%) |
ΔPortofolio (%) |
|
|---|---|---|---|---|---|---|---|---|---|
| US55291X1090 / MFS Institutional Money Market Portfolio | 0.83 | -4.08 | 0.83 | -4.04 | 1.7975 | -0.1695 | |||
| BPOP / Popular, Inc. | 0.01 | 5.52 | 0.66 | 26.00 | 1.4241 | 0.2368 | |||
| TTMI / TTM Technologies, Inc. | 0.02 | 5.51 | 0.63 | 110.33 | 1.3634 | 0.6819 | |||
| PB / Prosperity Bancshares, Inc. | 0.01 | -4.31 | 0.59 | -5.80 | 1.2649 | -0.1450 | |||
| PPBI / Pacific Premier Bancorp, Inc. | 0.03 | 5.51 | 0.57 | 4.39 | 1.2339 | -0.0070 | |||
| AL / Air Lease Corporation | 0.01 | -16.77 | 0.57 | 0.71 | 1.2223 | -0.0508 | |||
| PBH / Prestige Consumer Healthcare Inc. | 0.01 | 5.49 | 0.56 | -2.09 | 1.2155 | -0.0866 | |||
| PAGP / Plains GP Holdings, L.P. - Limited Partnership | 0.03 | 5.51 | 0.56 | -4.10 | 1.2150 | -0.1138 | |||
| FHB / First Hawaiian, Inc. | 0.02 | 5.51 | 0.56 | 7.88 | 1.2118 | 0.0313 | |||
| HWC / Hancock Whitney Corporation | 0.01 | 5.50 | 0.54 | 15.42 | 1.1661 | 0.1059 | |||
| EPRT / Essential Properties Realty Trust, Inc. | 0.02 | 5.51 | 0.54 | 3.27 | 1.1606 | -0.0204 | |||
| NWE / NorthWestern Energy Group, Inc. | 0.01 | 5.51 | 0.52 | -6.61 | 1.1313 | -0.1383 | |||
| NATL / NCR Atleos Corporation | 0.02 | 16.69 | 0.52 | 26.09 | 1.1288 | 0.1899 | |||
| NOMD / Nomad Foods Limited | 0.03 | 5.51 | 0.52 | -8.74 | 1.1280 | -0.1699 | |||
| AR / Antero Resources Corporation | 0.01 | -3.88 | 0.51 | -4.29 | 1.1097 | -0.1069 | |||
| CATY / Cathay General Bancorp | 0.01 | 5.51 | 0.51 | 11.65 | 1.0979 | 0.0656 | |||
| SLM / SLM Corporation | 0.02 | -8.05 | 0.50 | 2.65 | 1.0903 | -0.0245 | |||
| VNT / Vontier Corporation | 0.01 | 5.50 | 0.50 | 18.40 | 1.0855 | 0.1240 | |||
| SLGN / Silgan Holdings Inc. | 0.01 | 5.51 | 0.50 | 11.88 | 1.0782 | 0.0661 | |||
| FIBK / First Interstate BancSystem, Inc. | 0.02 | 0.24 | 0.50 | 0.81 | 1.0747 | -0.0440 | |||
| POR / Portland General Electric Company | 0.01 | -13.89 | 0.49 | -21.62 | 1.0661 | -0.3603 | |||
| ESI / Element Solutions Inc | 0.02 | 20.50 | 0.49 | 20.90 | 1.0503 | 0.1370 | |||
| UGI / UGI Corporation | 0.01 | 5.52 | 0.48 | 16.14 | 1.0421 | 0.1008 | |||
| UCB / United Community Banks, Inc. | 0.02 | 5.50 | 0.48 | 11.68 | 1.0330 | 0.0625 | |||
| EWBC / East West Bancorp, Inc. | 0.00 | -9.40 | 0.47 | 1.94 | 1.0257 | -0.0306 | |||
| OPCH / Option Care Health, Inc. | 0.01 | 5.50 | 0.47 | -2.07 | 1.0252 | -0.0723 | |||
| COLB / Columbia Banking System, Inc. | 0.02 | 5.51 | 0.47 | -1.05 | 1.0156 | -0.0622 | |||
| ATMU / Atmus Filtration Technologies Inc. | 0.01 | 5.50 | 0.46 | 4.56 | 0.9928 | -0.0034 | |||
| BELFB / Bel Fuse Inc. | 0.00 | 754.03 | 0.46 | 1,037.50 | 0.9838 | 0.8912 | |||
| TCBI / Texas Capital Bancshares, Inc. | 0.01 | -1.84 | 0.45 | 4.37 | 0.9812 | -0.0059 | |||
| THG / The Hanover Insurance Group, Inc. | 0.00 | -26.12 | 0.44 | -27.85 | 0.9579 | -0.4357 | |||
| CON / Concentra Group Holdings Parent, Inc. | 0.02 | 18.04 | 0.44 | 11.76 | 0.9452 | 0.0585 | |||
| FTI / TechnipFMC plc | 0.01 | 5.51 | 0.43 | 14.55 | 0.9365 | 0.0793 | |||
| AIN / Albany International Corp. | 0.01 | 5.51 | 0.43 | 7.21 | 0.9312 | 0.0192 | |||
| PECO / Phillips Edison & Company, Inc. | 0.01 | 5.50 | 0.43 | 1.18 | 0.9298 | -0.0338 | |||
| IRT / Independence Realty Trust, Inc. | 0.02 | 5.51 | 0.43 | -12.09 | 0.9271 | -0.1798 | |||
| UMBF / UMB Financial Corporation | 0.00 | -10.29 | 0.43 | -6.58 | 0.9205 | -0.1150 | |||
| OGS / ONE Gas, Inc. | 0.01 | 5.50 | 0.42 | 0.24 | 0.9079 | -0.0423 | |||
| HXL / Hexcel Corporation | 0.01 | 5.50 | 0.41 | 8.66 | 0.8956 | 0.0319 | |||
| GPK / Graphic Packaging Holding Company | 0.02 | 11.41 | 0.41 | -9.73 | 0.8829 | -0.1420 | |||
| CUZ / Cousins Properties Incorporated | 0.01 | 5.51 | 0.40 | 7.45 | 0.8736 | 0.0198 | |||
| LOPE / Grand Canyon Education, Inc. | 0.00 | -14.03 | 0.40 | -6.29 | 0.8703 | -0.1025 | |||
| HAYW / Hayward Holdings, Inc. | 0.03 | 5.51 | 0.40 | 4.69 | 0.8691 | -0.0030 | |||
| SMA / SmartStop Self Storage REIT, Inc. | 0.01 | 0.40 | 0.8685 | 0.8685 | |||||
| AXV / AXIS Capital Holdings Limited | 0.00 | -15.72 | 0.40 | -12.72 | 0.8606 | -0.1743 | |||
| NVT / nVent Electric plc | 0.01 | -0.17 | 0.40 | 39.79 | 0.8575 | 0.2123 | |||
| RRX / Regal Rexnord Corporation | 0.00 | 17.51 | 0.40 | 49.43 | 0.8572 | 0.2558 | |||
| EBC / Eastern Bankshares, Inc. | 0.03 | 5.51 | 0.40 | -1.74 | 0.8571 | -0.0587 | |||
| VC / Visteon Corporation | 0.00 | 5.51 | 0.40 | 26.92 | 0.8564 | 0.1476 | |||
| MTDR / Matador Resources Company | 0.01 | 5.52 | 0.40 | -1.25 | 0.8553 | -0.0556 | |||
| PR / Permian Resources Corporation | 0.03 | 5.51 | 0.39 | 3.72 | 0.8438 | -0.0098 | |||
| NSIT / Insight Enterprises, Inc. | 0.00 | 14.05 | 0.39 | 5.12 | 0.8425 | 0.0003 | |||
| BRX / Brixmor Property Group Inc. | 0.01 | 5.51 | 0.39 | 3.48 | 0.8372 | -0.0119 | |||
| FLS / Flowserve Corporation | 0.01 | 5.50 | 0.39 | 13.16 | 0.8366 | 0.0601 | |||
| TKR / The Timken Company | 0.01 | 13.34 | 0.39 | 14.24 | 0.8336 | 0.0688 | |||
| DAN / Dana Incorporated | 0.02 | -10.04 | 0.38 | 15.71 | 0.8287 | 0.0772 | |||
| NVST / Envista Holdings Corporation | 0.02 | 5.51 | 0.38 | 19.50 | 0.8215 | 0.0996 | |||
| NJR / New Jersey Resources Corporation | 0.01 | 5.50 | 0.38 | -3.55 | 0.8209 | -0.0731 | |||
| CVBF / CVB Financial Corp. | 0.02 | 5.51 | 0.37 | 13.33 | 0.8084 | 0.0582 | |||
| BKH / Black Hills Corporation | 0.01 | 5.51 | 0.37 | -2.35 | 0.8080 | -0.0611 | |||
| MHO / M/I Homes, Inc. | 0.00 | 0.37 | 0.8049 | 0.8049 | |||||
| SIGI / Selective Insurance Group, Inc. | 0.00 | 5.51 | 0.37 | -0.27 | 0.8034 | -0.0410 | |||
| EFN / Element Fleet Management Corp. | 0.01 | -27.15 | 0.37 | -8.25 | 0.7934 | -0.1139 | |||
| REXR / Rexford Industrial Realty, Inc. | 0.01 | 5.50 | 0.37 | -3.93 | 0.7927 | -0.0754 | |||
| PX / P10, Inc. | 0.04 | 22.42 | 0.37 | 6.40 | 0.7921 | 0.0112 | |||
| VNOM / Viper Energy, Inc. | 0.01 | 0.61 | 0.36 | -14.95 | 0.7867 | -0.1851 | |||
| FORM / FormFactor, Inc. | 0.01 | 27.37 | 0.36 | 55.17 | 0.7793 | 0.2513 | |||
| LNC / Lincoln National Corporation | 0.01 | 5.50 | 0.36 | 1.69 | 0.7791 | -0.0254 | |||
| FCPT / Four Corners Property Trust, Inc. | 0.01 | 5.51 | 0.36 | -1.10 | 0.7781 | -0.0475 | |||
| ACIW / ACI Worldwide, Inc. | 0.01 | 5.50 | 0.36 | -11.47 | 0.7680 | -0.1425 | |||
| PFSI / PennyMac Financial Services, Inc. | 0.00 | 5.51 | 0.35 | 5.04 | 0.7659 | 0.0004 | |||
| HAS / Hasbro, Inc. | 0.00 | -13.92 | 0.35 | 3.55 | 0.7562 | -0.0119 | |||
| ESAB / ESAB Corporation | 0.00 | 5.48 | 0.35 | 9.09 | 0.7522 | 0.0288 | |||
| IP / International Paper Company | 0.01 | 5.49 | 0.35 | -7.47 | 0.7501 | -0.1002 | |||
| TRS / TriMas Corporation | 0.01 | 5.51 | 0.33 | 29.07 | 0.7199 | 0.1334 | |||
| TNET / TriNet Group, Inc. | 0.00 | 5.51 | 0.33 | -2.63 | 0.7198 | -0.0560 | |||
| KWR / Quaker Chemical Corporation | 0.00 | 36.21 | 0.33 | 23.42 | 0.7185 | 0.1071 | |||
| SARO / StandardAero, Inc. | 0.01 | 5.50 | 0.33 | 25.67 | 0.7086 | 0.1152 | |||
| LKQ / LKQ Corporation | 0.01 | -12.07 | 0.33 | -23.47 | 0.7048 | -0.2623 | |||
| ASH / Ashland Inc. | 0.01 | 5.50 | 0.33 | -10.44 | 0.7047 | -0.1221 | |||
| BRSL / Brightstar Lottery PLC | 0.02 | 5.50 | 0.32 | 2.53 | 0.7006 | -0.0163 | |||
| AEIS / Advanced Energy Industries, Inc. | 0.00 | 0.32 | 0.6940 | 0.6940 | |||||
| AVNT / Avient Corporation | 0.01 | 16.94 | 0.32 | 1.61 | 0.6837 | -0.0221 | |||
| MIR / Mirion Technologies, Inc. | 0.01 | 0.31 | 0.6760 | 0.6760 | |||||
| SMPL / The Simply Good Foods Company | 0.01 | 5.50 | 0.31 | -3.45 | 0.6659 | -0.0574 | |||
| ECG / Everus Construction Group, Inc. | 0.00 | 5.49 | 0.30 | 80.36 | 0.6564 | 0.2751 | |||
| NXST / Nexstar Media Group, Inc. | 0.00 | 0.30 | 0.6559 | 0.6559 | |||||
| THRY / Thryv Holdings, Inc. | 0.02 | 18.62 | 0.30 | 12.31 | 0.6521 | 0.0442 | |||
| KMPR / Kemper Corporation | 0.00 | 5.49 | 0.30 | 2.04 | 0.6482 | -0.0199 | |||
| PATK / Patrick Industries, Inc. | 0.00 | 5.50 | 0.30 | 15.00 | 0.6465 | 0.0570 | |||
| AUB / Atlantic Union Bankshares Corporation | 0.01 | 0.30 | 0.6442 | 0.6442 | |||||
| UE / Urban Edge Properties | 0.02 | 5.51 | 0.30 | 3.86 | 0.6397 | -0.0083 | |||
| PLXS / Plexus Corp. | 0.00 | -8.46 | 0.29 | -3.31 | 0.6324 | -0.0543 | |||
| STC / Stewart Information Services Corporation | 0.00 | 25.31 | 0.29 | 14.51 | 0.6320 | 0.0518 | |||
| UA / Under Armour, Inc. | 0.04 | 5.51 | 0.29 | 15.14 | 0.6257 | 0.0550 | |||
| KBR / KBR, Inc. | 0.01 | 5.53 | 0.29 | 1.76 | 0.6247 | -0.0209 | |||
| AHL.PRF / Aspen Insurance Holdings Limited - Preferred Security | 0.01 | 0.29 | 0.6224 | 0.6224 | |||||
| XPRO / Expro Group Holdings N.V. | 0.03 | 73.41 | 0.29 | 50.00 | 0.6222 | 0.1864 | |||
| PET / Pet Valu Holdings Ltd. | 0.01 | 0.28 | 0.6077 | 0.6077 | |||||
| DEI / Douglas Emmett, Inc. | 0.02 | 5.51 | 0.27 | -1.08 | 0.5936 | -0.0346 | |||
| HRI / Herc Holdings Inc. | 0.00 | 5.56 | 0.27 | 3.45 | 0.5836 | -0.0081 | |||
| AXTA / Axalta Coating Systems Ltd. | 0.01 | 5.51 | 0.27 | -5.61 | 0.5824 | -0.0649 | |||
| IJF / ICON Public Limited Company | 0.00 | 84.07 | 0.27 | 53.45 | 0.5771 | 0.1812 | |||
| NCNO / nCino, Inc. | 0.01 | 5.51 | 0.27 | 7.29 | 0.5741 | 0.0132 | |||
| NWL / Newell Brands Inc. | 0.05 | 7.71 | 0.26 | -6.07 | 0.5693 | -0.0677 | |||
| ATGE / Adtalem Global Education Inc. | 0.00 | 0.26 | 0.5691 | 0.5691 | |||||
| CHEF / The Chefs' Warehouse, Inc. | 0.00 | 5.52 | 0.26 | 23.81 | 0.5634 | 0.0851 | |||
| BANC / Banc of California, Inc. | 0.02 | 5.51 | 0.26 | 4.45 | 0.5586 | -0.0027 | |||
| TOL / Toll Brothers, Inc. | 0.00 | 5.56 | 0.26 | 13.84 | 0.5526 | 0.0442 | |||
| TWO / Two Harbors Investment Corp. | 0.02 | 5.51 | 0.26 | -15.00 | 0.5511 | -0.1290 | |||
| BC / Brunswick Corporation | 0.00 | 5.49 | 0.25 | 8.19 | 0.5433 | 0.0163 | |||
| 2IY / Cushman & Wakefield plc | 0.02 | 5.51 | 0.25 | 14.61 | 0.5423 | 0.0442 | |||
| CC / The Chemours Company | 0.02 | 5.51 | 0.20 | -11.01 | 0.4384 | -0.0770 | |||
| MDU / MDU Resources Group, Inc. | 0.01 | 5.51 | 0.19 | 3.76 | 0.4187 | -0.0038 | |||
| UTZ / Utz Brands, Inc. | 0.02 | 0.19 | 0.4070 | 0.4070 | |||||
| KAI / Kadant Inc. | 0.00 | 0.18 | 0.3990 | 0.3990 | |||||
| LNTH / Lantheus Holdings, Inc. | 0.00 | 0.18 | 0.3966 | 0.3966 | |||||
| COLM / Columbia Sportswear Company | 0.00 | 0.18 | 0.3954 | 0.3954 | |||||
| RXO / RXO, Inc. | 0.01 | 5.51 | 0.18 | -13.53 | 0.3884 | -0.0811 | |||
| GTLS / Chart Industries, Inc. | 0.00 | 0.16 | 0.3556 | 0.3556 | |||||
| HUT / Hut 8 Corp. | 0.01 | 5.51 | 0.15 | 68.60 | 0.3144 | 0.1190 | |||
| OGN / Organon & Co. | 0.01 | 5.50 | 0.14 | -31.31 | 0.2941 | -0.1560 | |||
| SDHC / Smith Douglas Homes Corp. | 0.01 | 22.47 | 0.13 | 21.15 | 0.2737 | 0.0379 | |||
| BIPC / Brookfield Infrastructure Corporation | 0.00 | 0.09 | 0.1960 | 0.1960 | |||||
| ASTS / AST SpaceMobile, Inc. | 0.00 | -45.17 | 0.09 | 12.66 | 0.1937 | 0.0132 | |||
| MGMXX / JPMorgan Trust II - JPMorgan U.S. Government Money Market Fund IM | 0.07 | -79.35 | 0.07 | -79.50 | 0.1414 | -0.5773 | |||
| NSA / National Storage Affiliates Trust | 0.00 | -93.30 | 0.02 | -94.75 | 0.0403 | -0.7378 | |||
| KRMN / Karman Holdings Inc. | 0.00 | -100.00 | 0.00 | -100.00 | -0.3853 | ||||
| SKX / Skechers U.S.A., Inc. | 0.00 | -100.00 | 0.00 | -100.00 | -0.8633 |