Mga Batayang Estadistika
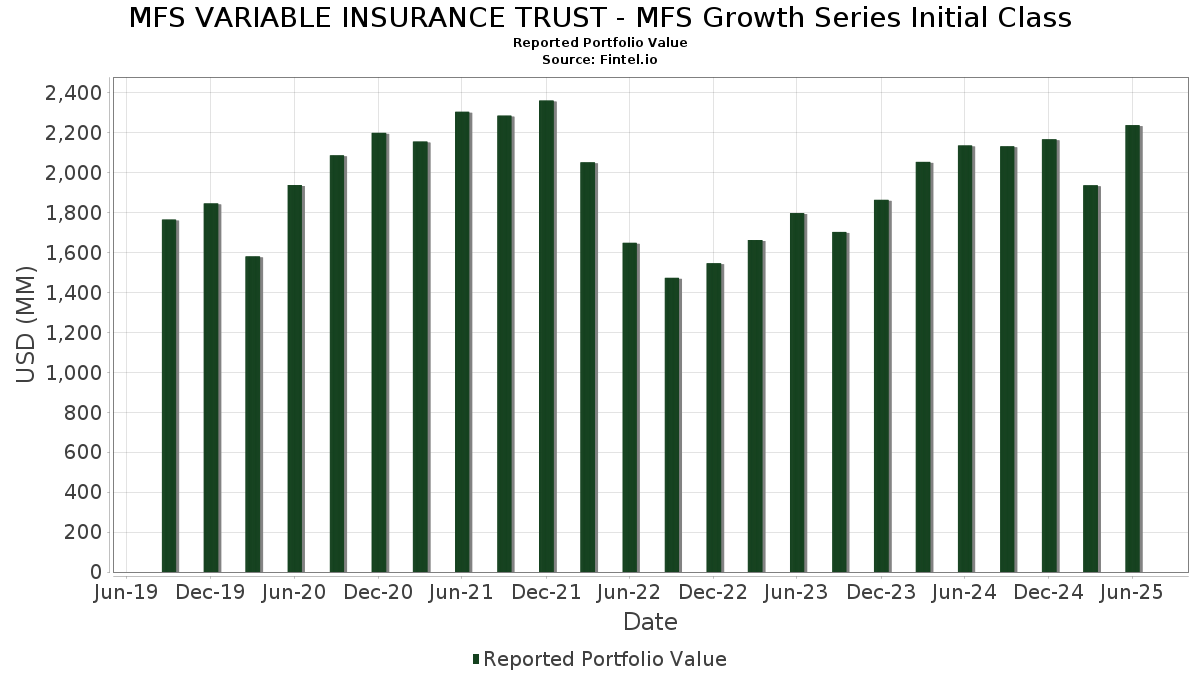
| Nilai Portofolio | $ 2,238,128,366 |
| Posisi Saat Ini | 71 |
Kepemilikan Terbaru, Kinerja, AUM (dari 13F, 13D)
MFS VARIABLE INSURANCE TRUST - MFS Growth Series Initial Class telah mengungkapkan total kepemilikan 71 dalam pengajuan SEC terbaru mereka. Nilai portofolio terbaru dihitung sebesar $ 2,238,128,366 USD. Aset yang Dikelola (AUM) sebenarnya adalah nilai ini ditambah kas (yang tidak diungkapkan). Aset-aset utama MFS VARIABLE INSURANCE TRUST - MFS Growth Series Initial Class adalah Microsoft Corporation (US:MSFT) , NVIDIA Corporation (US:NVDA) , Amazon.com, Inc. (US:AMZN) , Meta Platforms, Inc. (US:META) , and Apple Inc. (US:AAPL) . Posisi baru MFS VARIABLE INSURANCE TRUST - MFS Growth Series Initial Class meliputi: Nasdaq, Inc. (US:NDAQ) , SAP SE (DE:SAP) , DexCom, Inc. (US:DXCM) , The Cigna Group (US:CI) , and LPL Financial Holdings Inc. (US:LPLA) .
Peningkatan Tertinggi Kuartal Ini
Kami menggunakan perubahan dalam alokasi portofolio karena ini adalah metrik yang paling bermakna. Perubahan dapat disebabkan oleh perdagangan atau perubahan harga saham.
| Keamanan | Saham (MM) |
Nilai (Juta Dolar AS) |
Portfolio % | ΔPorsyento ng Portfolio |
|---|---|---|---|---|
| 1.27 | 201.09 | 9.0009 | 2.0653 | |
| 0.57 | 283.79 | 12.7028 | 1.9401 | |
| 0.11 | 29.58 | 1.3242 | 0.8638 | |
| 0.05 | 68.56 | 3.0689 | 0.8119 | |
| 0.23 | 167.03 | 7.4763 | 0.6891 | |
| 0.16 | 14.55 | 0.6512 | 0.6512 | |
| 0.42 | 41.75 | 1.8688 | 0.5980 | |
| 0.04 | 13.11 | 0.5866 | 0.5866 | |
| 0.07 | 34.81 | 1.5581 | 0.5725 | |
| 0.78 | 171.97 | 7.6976 | 0.4785 |
Penurunan Tertinggi Kuartal Ini
Kami menggunakan perubahan dalam alokasi portofolio karena ini adalah metrik yang paling bermakna. Perubahan dapat disebabkan oleh perdagangan atau perubahan harga saham.
| Keamanan | Saham (MM) |
Nilai (Juta Dolar AS) |
Portfolio % | ΔPorsyento ng Portfolio |
|---|---|---|---|---|
| 9.11 | 9.11 | 0.4078 | -2.1092 | |
| 0.48 | 99.37 | 4.4480 | -1.3521 | |
| 0.48 | 85.45 | 3.8249 | -0.9834 | |
| 0.01 | 5.15 | 0.2307 | -0.8345 | |
| 0.02 | 9.03 | 0.4044 | -0.6772 | |
| 0.05 | 8.24 | 0.3690 | -0.6126 | |
| 0.04 | 14.77 | 0.6613 | -0.5095 | |
| 0.02 | 8.76 | 0.3920 | -0.3872 | |
| 0.08 | 21.60 | 0.9666 | -0.3827 | |
| 0.32 | 34.41 | 1.5402 | -0.3665 |
Pengajuan 13F dan Dana
Formulir ini diajukan pada 2025-08-25 untuk periode pelaporan 2025-06-30. Klik ikon tautan untuk melihat riwayat transaksi selengkapnya.
Tingkatkan ke versi premium untuk membuka data premium dan ekspor ke Excel. ![]() .
.
| Keamanan | Ketik | Harga Saham Rata-rata | Saham (MM) |
ΔSaham (%) |
ΔSaham (%) |
Nilai ($MM) |
Portpolyo (%) |
ΔPortofolio (%) |
|
|---|---|---|---|---|---|---|---|---|---|
| MSFT / Microsoft Corporation | 0.57 | 2.74 | 283.79 | 36.13 | 12.7028 | 1.9401 | |||
| NVDA / NVIDIA Corporation | 1.27 | 2.69 | 201.09 | 49.69 | 9.0009 | 2.0653 | |||
| AMZN / Amazon.com, Inc. | 0.78 | 6.66 | 171.97 | 22.99 | 7.6976 | 0.4785 | |||
| META / Meta Platforms, Inc. | 0.23 | -0.79 | 167.03 | 27.05 | 7.4763 | 0.6891 | |||
| AAPL / Apple Inc. | 0.48 | -4.24 | 99.37 | -11.55 | 4.4480 | -1.3521 | |||
| GOOGL / Alphabet Inc. | 0.48 | -19.49 | 85.45 | -8.25 | 3.8249 | -0.9834 | |||
| MA / Mastercard Incorporated | 0.15 | 2.67 | 81.70 | 5.26 | 3.6567 | -0.3502 | |||
| NFLX / Netflix, Inc. | 0.05 | 9.21 | 68.56 | 56.83 | 3.0689 | 0.8119 | |||
| SPF / Spotify Technology S.A. | 0.06 | -5.78 | 44.70 | 31.45 | 2.0007 | 0.2452 | |||
| APH / Amphenol Corporation | 0.42 | 12.66 | 41.75 | 69.62 | 1.8688 | 0.5980 | |||
| V / Visa Inc. | 0.12 | 1.80 | 41.19 | 3.13 | 1.8439 | -0.2182 | |||
| PM / Philip Morris International Inc. | 0.22 | 5.79 | 39.53 | 21.38 | 1.7693 | 0.0880 | |||
| HWM / Howmet Aerospace Inc. | 0.21 | 2.62 | 39.50 | 47.24 | 1.7682 | 0.3831 | |||
| GEV / GE Vernova Inc. | 0.07 | 5.20 | 34.81 | 82.35 | 1.5581 | 0.5725 | |||
| KKR / KKR & Co. Inc. | 0.26 | -1.14 | 34.50 | 13.75 | 1.5444 | -0.0216 | |||
| BSX / Boston Scientific Corporation | 0.32 | -12.49 | 34.41 | -6.83 | 1.5402 | -0.3665 | |||
| ETN / Eaton Corporation plc | 0.09 | 6.74 | 33.20 | 40.17 | 1.4862 | 0.2633 | |||
| ADSK / Autodesk, Inc. | 0.10 | 1.22 | 31.58 | 19.69 | 1.4134 | 0.0513 | |||
| AVGO / Broadcom Inc. | 0.11 | 101.49 | 29.58 | 231.73 | 1.3242 | 0.8638 | |||
| GE / General Electric Company | 0.11 | 3.93 | 27.31 | 33.65 | 1.2225 | 0.1675 | |||
| VRSK / Verisk Analytics, Inc. | 0.07 | -4.37 | 22.72 | 0.09 | 1.0169 | -0.1550 | |||
| LNG / Cheniere Energy, Inc. | 0.09 | 0.30 | 22.47 | 5.55 | 1.0057 | -0.0932 | |||
| LIN / Linde plc | 0.05 | 6.29 | 22.20 | 7.09 | 0.9935 | -0.0765 | |||
| TTWO / Take-Two Interactive Software, Inc. | 0.09 | 4.35 | 22.00 | 22.28 | 0.9847 | 0.0558 | |||
| ISRG / Intuitive Surgical, Inc. | 0.04 | 0.29 | 21.96 | 10.04 | 0.9828 | -0.0473 | |||
| HLT / Hilton Worldwide Holdings Inc. | 0.08 | -29.41 | 21.60 | -17.37 | 0.9666 | -0.3827 | |||
| VMC / Vulcan Materials Company | 0.08 | 2.73 | 21.39 | 14.85 | 0.9572 | -0.0041 | |||
| TRU / TransUnion | 0.23 | -0.57 | 20.39 | 5.43 | 0.9128 | -0.0858 | |||
| TT / Trane Technologies plc | 0.04 | 6.43 | 19.49 | 38.17 | 0.8724 | 0.1441 | |||
| CDNS / Cadence Design Systems, Inc. | 0.06 | 21.56 | 18.81 | 47.29 | 0.8419 | 0.1826 | |||
| NOW / ServiceNow, Inc. | 0.02 | -4.13 | 17.85 | 23.80 | 0.7992 | 0.0546 | |||
| VST / Vistra Corp. | 0.09 | -15.78 | 16.97 | 38.98 | 0.7596 | 0.1292 | |||
| TEAM / Atlassian Corporation | 0.08 | -10.34 | 16.90 | -14.20 | 0.7565 | -0.2604 | |||
| ASML / ASML Holding N.V. - Depositary Receipt (Common Stock) | 0.02 | 13.14 | 16.47 | 36.82 | 0.7371 | 0.1158 | |||
| ARES / Ares Management Corporation | 0.09 | -14.29 | 15.90 | 1.25 | 0.7116 | -0.0990 | |||
| AJG / Arthur J. Gallagher & Co. | 0.05 | -0.75 | 15.86 | -7.97 | 0.7098 | -0.1798 | |||
| ORLY / O'Reilly Automotive, Inc. | 0.17 | 1,540.55 | 15.73 | 3.22 | 0.7039 | -0.0827 | |||
| TSM / Taiwan Semiconductor Manufacturing Company Limited - Depositary Receipt (Common Stock) | 0.07 | -14.74 | 15.43 | 16.33 | 0.6907 | 0.0059 | |||
| TMO / Thermo Fisher Scientific Inc. | 0.04 | -20.05 | 14.77 | -34.85 | 0.6613 | -0.5095 | |||
| KLAC / KLA Corporation | 0.02 | 28.99 | 14.73 | 69.96 | 0.6593 | 0.2119 | |||
| ABT / Abbott Laboratories | 0.11 | 28.92 | 14.57 | 32.19 | 0.6520 | 0.0831 | |||
| NDAQ / Nasdaq, Inc. | 0.16 | 14.55 | 0.6512 | 0.6512 | |||||
| MCO / Moody's Corporation | 0.03 | 0.11 | 13.24 | 7.83 | 0.5926 | -0.0413 | |||
| MDT / Medtronic plc | 0.15 | 30.15 | 13.23 | 26.26 | 0.5920 | 0.0512 | |||
| SAP / SAP SE | 0.04 | 13.11 | 0.5866 | 0.5866 | |||||
| GWRE / Guidewire Software, Inc. | 0.05 | 11.33 | 12.70 | 39.92 | 0.5686 | 0.0999 | |||
| SBUX / Starbucks Corporation | 0.14 | 23.97 | 12.60 | 15.80 | 0.5642 | 0.0023 | |||
| CRWD / CrowdStrike Holdings, Inc. | 0.02 | 27.13 | 11.85 | 83.65 | 0.5304 | 0.1973 | |||
| VEEV / Veeva Systems Inc. | 0.04 | 0.06 | 11.33 | 24.41 | 0.5069 | 0.0369 | |||
| APO / Apollo Global Management, Inc. | 0.07 | -17.97 | 10.28 | -15.02 | 0.4600 | -0.1643 | |||
| CSGP / CoStar Group, Inc. | 0.12 | -3.14 | 9.48 | -1.72 | 0.4243 | -0.0736 | |||
| US55291X1090 / MFS Institutional Money Market Portfolio | 9.11 | -81.31 | 9.11 | -81.31 | 0.4078 | -2.1092 | |||
| VRTX / Vertex Pharmaceuticals Incorporated | 0.02 | -53.04 | 9.03 | -56.88 | 0.4044 | -0.6772 | |||
| ROP / Roper Technologies, Inc. | 0.02 | -26.10 | 8.87 | 6.14 | 0.3970 | -0.1105 | |||
| MC / LVMH Moët Hennessy - Louis Vuitton, Société Européenne | 0.02 | -30.83 | 8.76 | -41.97 | 0.3920 | -0.3872 | |||
| CBRE / CBRE Group, Inc. | 0.06 | 1.81 | 8.70 | 9.08 | 0.3894 | -0.0224 | |||
| APP / AppLovin Corporation | 0.02 | -1.99 | 8.51 | 29.50 | 0.3810 | 0.0416 | |||
| SHOP / Shopify Inc. | 0.07 | -35.48 | 8.51 | -21.98 | 0.3808 | -0.1821 | |||
| FI / Fiserv, Inc. | 0.05 | -44.46 | 8.24 | -56.64 | 0.3690 | -0.6126 | |||
| DXCM / DexCom, Inc. | 0.09 | 7.71 | 0.3452 | 0.3452 | |||||
| CI / The Cigna Group | 0.02 | 7.56 | 0.3384 | 0.3384 | |||||
| DDOG / Datadog, Inc. | 0.06 | -16.20 | 7.46 | 13.47 | 0.3337 | -0.0055 | |||
| LPLA / LPL Financial Holdings Inc. | 0.02 | 6.30 | 0.2820 | 0.2820 | |||||
| SNPS / Synopsys, Inc. | 0.01 | 0.17 | 5.60 | 19.76 | 0.2505 | 0.0092 | |||
| LLY / Eli Lilly and Company | 0.01 | -73.53 | 5.15 | -75.02 | 0.2307 | -0.8345 | |||
| GS / The Goldman Sachs Group, Inc. | 0.01 | -36.39 | 5.00 | -17.60 | 0.2238 | -0.0894 | |||
| CMG / Chipotle Mexican Grill, Inc. | 0.09 | -51.15 | 4.83 | -45.38 | 0.2160 | -0.2401 | |||
| MSCI / MSCI Inc. | 0.01 | -45.77 | 4.81 | -44.69 | 0.2155 | -0.2339 | |||
| CW / Curtiss-Wright Corporation | 0.01 | 4.54 | 0.2030 | 0.2030 | |||||
| DHR / Danaher Corporation | 0.02 | -41.56 | 4.46 | -43.68 | 0.1995 | -0.2092 | |||
| NEE / NextEra Energy, Inc. | 0.05 | 0.51 | 3.38 | -1.57 | 0.1515 | -0.0260 | |||
| HUBS / HubSpot, Inc. | 0.00 | -100.00 | 0.00 | -100.00 | -0.1697 |