Mga Batayang Estadistika
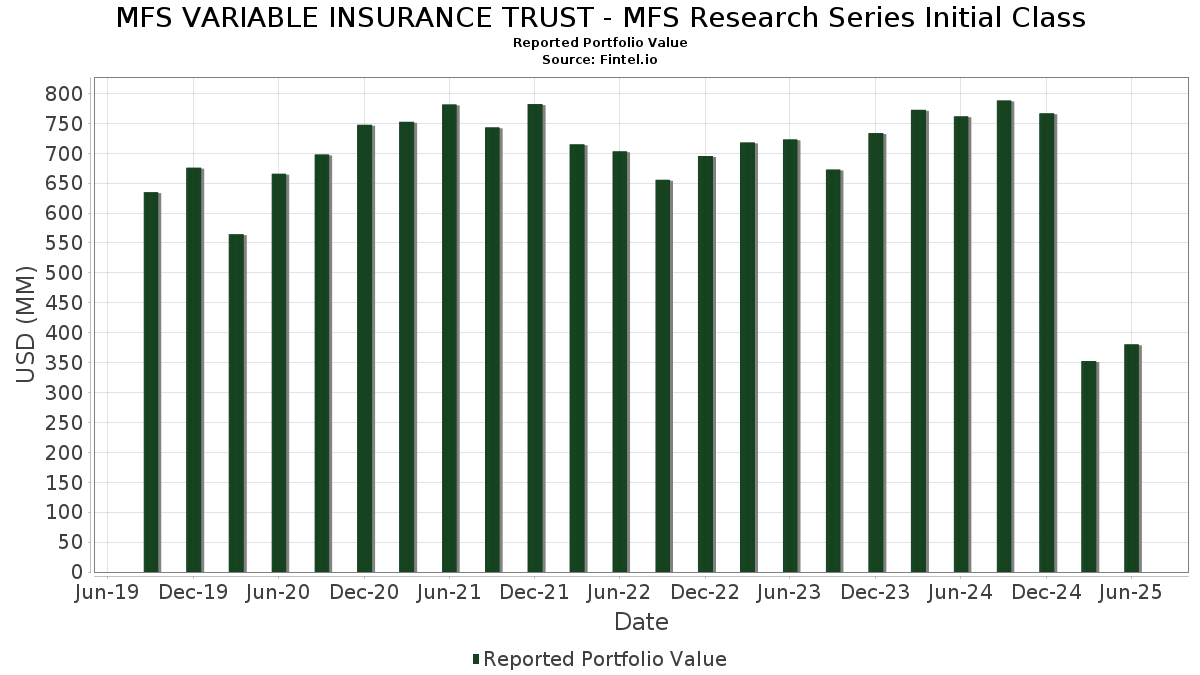
| Nilai Portofolio | $ 380,420,753 |
| Posisi Saat Ini | 105 |
Kepemilikan Terbaru, Kinerja, AUM (dari 13F, 13D)
MFS VARIABLE INSURANCE TRUST - MFS Research Series Initial Class telah mengungkapkan total kepemilikan 105 dalam pengajuan SEC terbaru mereka. Nilai portofolio terbaru dihitung sebesar $ 380,420,753 USD. Aset yang Dikelola (AUM) sebenarnya adalah nilai ini ditambah kas (yang tidak diungkapkan). Aset-aset utama MFS VARIABLE INSURANCE TRUST - MFS Research Series Initial Class adalah Microsoft Corporation (US:MSFT) , NVIDIA Corporation (US:NVDA) , Amazon.com, Inc. (US:AMZN) , Meta Platforms, Inc. (US:META) , and Apple Inc. (US:AAPL) . Posisi baru MFS VARIABLE INSURANCE TRUST - MFS Research Series Initial Class meliputi: The TJX Companies, Inc. (US:TJX) , Union Pacific Corporation (US:UNP) , BJ's Wholesale Club Holdings, Inc. (US:BJ) , American International Group, Inc. (US:AIG) , and Vistra Corp. (US:VST) .
Peningkatan Tertinggi Kuartal Ini
Kami menggunakan perubahan dalam alokasi portofolio karena ini adalah metrik yang paling bermakna. Perubahan dapat disebabkan oleh perdagangan atau perubahan harga saham.
| Keamanan | Saham (MM) |
Nilai (Juta Dolar AS) |
Portfolio % | ΔPorsyento ng Portfolio |
|---|---|---|---|---|
| 0.02 | 11.33 | 2.9802 | 2.9802 | |
| 0.03 | 9.57 | 2.5174 | 2.0228 | |
| 0.03 | 5.06 | 1.3298 | 1.3298 | |
| 0.07 | 32.72 | 8.6067 | 1.2493 | |
| 0.02 | 3.80 | 0.9991 | 0.9991 | |
| 0.13 | 20.61 | 5.4227 | 0.9552 | |
| 0.02 | 2.32 | 0.6092 | 0.6092 | |
| 0.02 | 17.94 | 4.7192 | 0.5939 | |
| 0.01 | 1.75 | 0.4609 | 0.4609 | |
| 0.02 | 1.71 | 0.4490 | 0.4490 |
Penurunan Tertinggi Kuartal Ini
Kami menggunakan perubahan dalam alokasi portofolio karena ini adalah metrik yang paling bermakna. Perubahan dapat disebabkan oleh perdagangan atau perubahan harga saham.
| Keamanan | Saham (MM) |
Nilai (Juta Dolar AS) |
Portfolio % | ΔPorsyento ng Portfolio |
|---|---|---|---|---|
| 0.00 | 1.15 | 0.3020 | -0.8434 | |
| 0.01 | 3.10 | 0.8168 | -0.6316 | |
| 3.24 | 3.24 | 0.8533 | -0.5505 | |
| 0.01 | 1.18 | 0.3104 | -0.4683 | |
| 0.01 | 3.69 | 0.9711 | -0.3735 | |
| 0.00 | 0.48 | 0.1265 | -0.3342 | |
| 0.02 | 4.35 | 1.1441 | -0.3017 | |
| 0.05 | 9.68 | 2.5464 | -0.2887 | |
| 0.01 | 2.47 | 0.6492 | -0.2740 | |
| 0.03 | 4.66 | 1.2251 | -0.2640 |
Pengajuan 13F dan Dana
Formulir ini diajukan pada 2025-08-25 untuk periode pelaporan 2025-06-30. Klik ikon tautan untuk melihat riwayat transaksi selengkapnya.
Tingkatkan ke versi premium untuk membuka data premium dan ekspor ke Excel. ![]() .
.
| Keamanan | Ketik | Harga Saham Rata-rata | Saham (MM) |
ΔSaham (%) |
ΔSaham (%) |
Nilai ($MM) |
Portpolyo (%) |
ΔPortofolio (%) |
|
|---|---|---|---|---|---|---|---|---|---|
| MSFT / Microsoft Corporation | 0.07 | -4.81 | 32.72 | 26.13 | 8.6067 | 1.2493 | |||
| NVDA / NVIDIA Corporation | 0.13 | -10.22 | 20.61 | 30.87 | 5.4227 | 0.9552 | |||
| AMZN / Amazon.com, Inc. | 0.08 | -3.69 | 18.34 | 11.06 | 4.8248 | 0.1406 | |||
| META / Meta Platforms, Inc. | 0.02 | -3.69 | 17.94 | 23.34 | 4.7192 | 0.5939 | |||
| AAPL / Apple Inc. | 0.08 | 24.08 | 15.73 | 14.61 | 4.1368 | 0.2450 | |||
| MA / Mastercard Incorporated | 0.02 | 11.33 | 2.9802 | 2.9802 | |||||
| JPM / JPMorgan Chase & Co. | 0.03 | -3.69 | 9.80 | 13.83 | 2.5770 | 0.1360 | |||
| GOOGL / Alphabet Inc. | 0.05 | -15.02 | 9.68 | -3.16 | 2.5464 | -0.2887 | |||
| AVGO / Broadcom Inc. | 0.03 | 233.35 | 9.57 | 449.05 | 2.5174 | 2.0228 | |||
| CRM / Salesforce, Inc. | 0.02 | -3.69 | 5.23 | -2.15 | 1.3765 | -0.1401 | |||
| RTX / RTX Corporation | 0.03 | 5.06 | 1.3298 | 1.3298 | |||||
| JNJ / Johnson & Johnson | 0.03 | -3.69 | 4.66 | -11.30 | 1.2251 | -0.2640 | |||
| ABBV / AbbVie Inc. | 0.02 | -3.69 | 4.35 | -14.68 | 1.1441 | -0.3017 | |||
| HD / The Home Depot, Inc. | 0.01 | -3.70 | 4.14 | -3.65 | 1.0898 | -0.1299 | |||
| XOM / Exxon Mobil Corporation | 0.04 | 33.26 | 4.07 | 20.79 | 1.0699 | 0.1149 | |||
| SCHW / The Charles Schwab Corporation | 0.04 | -3.69 | 3.86 | 12.23 | 1.0161 | 0.0402 | |||
| 3EC / Eaton Corporation plc | 0.01 | -3.69 | 3.85 | 26.49 | 1.0136 | 0.1496 | |||
| CME / CME Group Inc. | 0.01 | -3.68 | 3.83 | 0.05 | 1.0064 | -0.0780 | |||
| AMT / American Tower Corporation | 0.02 | 3.80 | 0.9991 | 0.9991 | |||||
| EMR / Emerson Electric Co. | 0.03 | 22.39 | 3.79 | 48.88 | 0.9976 | 0.2749 | |||
| PNC / The PNC Financial Services Group, Inc. | 0.02 | -3.69 | 3.74 | 2.16 | 0.9831 | -0.0546 | |||
| CSA / Accenture plc | 0.01 | -18.71 | 3.69 | -22.13 | 0.9711 | -0.3735 | |||
| CI / The Cigna Group | 0.01 | -3.69 | 3.69 | -3.23 | 0.9707 | -0.1108 | |||
| LRCX / Lam Research Corporation | 0.04 | -3.69 | 3.63 | 28.95 | 0.9539 | 0.1564 | |||
| MDT / Medtronic plc | 0.04 | -3.69 | 3.58 | -6.58 | 0.9419 | -0.1451 | |||
| HWM / Howmet Aerospace Inc. | 0.02 | -3.69 | 3.57 | 38.19 | 0.9387 | 0.2063 | |||
| CDNS / Cadence Design Systems, Inc. | 0.01 | -20.31 | 3.54 | -3.43 | 0.9320 | -0.1088 | |||
| ARMK / Aramark | 0.08 | -3.69 | 3.34 | 16.80 | 0.8779 | 0.0676 | |||
| MS / Morgan Stanley | 0.02 | -3.69 | 3.33 | 16.31 | 0.8762 | 0.0637 | |||
| BSX / Boston Scientific Corporation | 0.03 | -3.68 | 3.29 | 2.55 | 0.8666 | -0.0445 | |||
| US55291X1090 / MFS Institutional Money Market Portfolio | 3.24 | -34.46 | 3.24 | -34.47 | 0.8533 | -0.5505 | |||
| COP / ConocoPhillips | 0.03 | -3.69 | 3.11 | -17.71 | 0.8178 | -0.2536 | |||
| CB / Chubb Limited | 0.01 | -36.62 | 3.10 | -39.21 | 0.8168 | -0.6316 | |||
| AON / Aon plc | 0.01 | -3.69 | 3.04 | -13.91 | 0.7996 | -0.2017 | |||
| OMC / Omnicom Group Inc. | 0.04 | 14.04 | 3.02 | -1.05 | 0.7936 | -0.0711 | |||
| CNSWF / Constellation Software Inc. | 0.00 | -14.38 | 2.95 | -0.84 | 0.7755 | -0.0679 | |||
| PM / Philip Morris International Inc. | 0.02 | -3.69 | 2.89 | 10.52 | 0.7601 | 0.0185 | |||
| SPF / Spotify Technology S.A. | 0.00 | 21.25 | 2.85 | 69.18 | 0.7497 | 0.2718 | |||
| USFD / US Foods Holding Corp. | 0.04 | 3.40 | 2.79 | 21.69 | 0.7350 | 0.0835 | |||
| TRU / TransUnion | 0.03 | -3.69 | 2.79 | 2.12 | 0.7340 | -0.0409 | |||
| CRG / CRH plc | 0.03 | 19.07 | 2.79 | 24.24 | 0.7336 | 0.0970 | |||
| PEP / PepsiCo, Inc. | 0.02 | -3.69 | 2.78 | -15.20 | 0.7322 | -0.1987 | |||
| HLT / Hilton Worldwide Holdings Inc. | 0.01 | 3.88 | 2.69 | 21.56 | 0.7075 | 0.0801 | |||
| 2IS / Trane Technologies plc | 0.01 | 42.70 | 2.65 | 85.31 | 0.6972 | 0.2914 | |||
| TEAM / Atlassian Corporation | 0.01 | 25.15 | 2.54 | 19.74 | 0.6689 | 0.0667 | |||
| MCK / McKesson Corporation | 0.00 | -15.51 | 2.53 | -8.01 | 0.6646 | -0.1143 | |||
| GD / General Dynamics Corporation | 0.01 | 4.26 | 2.47 | 11.55 | 0.6504 | 0.0218 | |||
| FI / Fiserv, Inc. | 0.01 | -2.89 | 2.47 | -24.21 | 0.6492 | -0.2740 | |||
| STE / STERIS plc | 0.01 | -3.68 | 2.47 | 2.11 | 0.6491 | -0.0364 | |||
| BDX / Becton, Dickinson and Company | 0.01 | 12.16 | 2.46 | -15.65 | 0.6464 | -0.1799 | |||
| OKTA / Okta, Inc. | 0.02 | -3.69 | 2.42 | -8.50 | 0.6372 | -0.1136 | |||
| NDSN / Nordson Corporation | 0.01 | 13.40 | 2.42 | 20.53 | 0.6365 | 0.0670 | |||
| MRVL / Marvell Technology, Inc. | 0.03 | -3.69 | 2.36 | 21.09 | 0.6209 | 0.0680 | |||
| APD / Air Products and Chemicals, Inc. | 0.01 | 3.61 | 2.32 | -0.90 | 0.6114 | -0.0539 | |||
| TJX / The TJX Companies, Inc. | 0.02 | 2.32 | 0.6092 | 0.6092 | |||||
| VRTX / Vertex Pharmaceuticals Incorporated | 0.01 | -16.73 | 2.30 | -23.55 | 0.6049 | -0.2481 | |||
| DUK / Duke Energy Corporation | 0.02 | -3.69 | 2.30 | -6.85 | 0.6047 | -0.0951 | |||
| CTVA / Corteva, Inc. | 0.03 | -3.69 | 2.28 | 14.08 | 0.5992 | 0.0328 | |||
| PFE / Pfizer Inc. | 0.09 | -3.69 | 2.27 | -7.88 | 0.5965 | -0.1016 | |||
| TYL / Tyler Technologies, Inc. | 0.00 | 15.11 | 2.26 | 17.37 | 0.5938 | 0.0484 | |||
| BKNG / Booking Holdings Inc. | 0.00 | -3.74 | 2.23 | 20.95 | 0.5878 | 0.0639 | |||
| WAB / Westinghouse Air Brake Technologies Corporation | 0.01 | -3.69 | 2.19 | 11.17 | 0.5763 | 0.0174 | |||
| WTY / Willis Towers Watson Public Limited Company | 0.01 | -3.70 | 2.16 | -12.68 | 0.5692 | -0.1335 | |||
| TE Connectivity PLC / EC (IE000IVNQZ81) | 0.01 | -3.69 | 2.10 | 14.94 | 0.5527 | 0.0343 | |||
| MCO / Moody's Corporation | 0.00 | -3.70 | 2.09 | 3.72 | 0.5497 | -0.0217 | |||
| EPAM / EPAM Systems, Inc. | 0.01 | -3.70 | 2.08 | 0.87 | 0.5483 | -0.0379 | |||
| SHW / The Sherwin-Williams Company | 0.01 | 3.79 | 2.08 | 2.06 | 0.5465 | -0.0309 | |||
| VNX / NXP Semiconductors N.V. | 0.01 | -3.70 | 2.04 | 10.67 | 0.5376 | 0.0140 | |||
| CTSH / Cognizant Technology Solutions Corporation | 0.03 | -55.21 | 2.04 | -39.19 | 0.5358 | 0.0256 | |||
| CL / Colgate-Palmolive Company | 0.02 | -3.70 | 2.04 | -6.61 | 0.5358 | -0.0825 | |||
| A / Agilent Technologies, Inc. | 0.02 | -3.69 | 2.03 | -2.83 | 0.5336 | -0.0586 | |||
| WAT / Waters Corporation | 0.01 | -3.70 | 2.01 | -8.80 | 0.5288 | -0.0963 | |||
| Aptiv PLC / EC (JE00BTDN8H13) | 0.03 | 7.00 | 1.94 | 22.71 | 0.5104 | 0.0618 | |||
| RRX / Regal Rexnord Corporation | 0.01 | -3.70 | 1.91 | 22.59 | 0.5025 | 0.0606 | |||
| HUBS / HubSpot, Inc. | 0.00 | 17.35 | 1.90 | 14.35 | 0.4992 | 0.0285 | |||
| EXR / Extra Space Storage Inc. | 0.01 | -3.69 | 1.87 | -4.34 | 0.4927 | -0.0628 | |||
| NTRS / Northern Trust Corporation | 0.01 | -3.68 | 1.85 | 23.81 | 0.4857 | 0.0627 | |||
| MDLZ / Mondelez International, Inc. | 0.03 | -3.69 | 1.84 | -4.28 | 0.4832 | -0.0610 | |||
| FERG / Ferguson Enterprises Inc. | 0.01 | -3.68 | 1.83 | 30.91 | 0.4827 | 0.0851 | |||
| LNT / Alliant Energy Corporation | 0.03 | -3.69 | 1.79 | -9.53 | 0.4721 | -0.0903 | |||
| DG / Dollar General Corporation | 0.02 | -28.83 | 1.76 | -40.12 | 0.4638 | 0.0627 | |||
| UNP / Union Pacific Corporation | 0.01 | 1.75 | 0.4609 | 0.4609 | |||||
| EXPE / Expedia Group, Inc. | 0.01 | -3.70 | 1.74 | -3.38 | 0.4586 | -0.0531 | |||
| BJ / BJ's Wholesale Club Holdings, Inc. | 0.02 | 1.71 | 0.4490 | 0.4490 | |||||
| PCG / PG&E Corporation | 0.12 | -3.69 | 1.71 | -21.85 | 0.4489 | -0.1705 | |||
| AIG / American International Group, Inc. | 0.02 | 1.68 | 0.4414 | 0.4414 | |||||
| PPL / PPL Corporation | 0.05 | -3.69 | 1.67 | -9.61 | 0.4381 | -0.0845 | |||
| KKR / KKR & Co. Inc. | 0.01 | -3.70 | 1.66 | 10.79 | 0.4377 | 0.0118 | |||
| CDW / CDW Corporation | 0.01 | -3.68 | 1.64 | 7.35 | 0.4304 | -0.0019 | |||
| SBUX / Starbucks Corporation | 0.02 | -67.68 | 1.63 | -61.96 | 0.4279 | -0.1336 | |||
| KVUE / Kenvue Inc. | 0.08 | -3.69 | 1.61 | -15.95 | 0.4245 | -0.1200 | |||
| JBHT / J.B. Hunt Transport Services, Inc. | 0.01 | -3.70 | 1.51 | -6.51 | 0.3966 | -0.0609 | |||
| VST / Vistra Corp. | 0.01 | 1.47 | 0.3856 | 0.3856 | |||||
| HUM / Humana Inc. | 0.00 | -3.70 | 1.22 | -11.05 | 0.3201 | -0.0678 | |||
| VLO / Valero Energy Corporation | 0.01 | -3.69 | 1.19 | -1.98 | 0.3132 | -0.0313 | |||
| HES / Hess Corporation | 0.01 | -50.45 | 1.18 | -57.05 | 0.3104 | -0.4683 | |||
| GIS / General Mills, Inc. | 0.02 | -3.69 | 1.16 | -16.56 | 0.3063 | -0.0894 | |||
| SBAC / SBA Communications Corporation | 0.00 | -73.37 | 1.15 | -71.57 | 0.3020 | -0.8434 | |||
| LNG / Cheniere Energy, Inc. | 0.00 | -3.70 | 1.09 | 1.40 | 0.2865 | -0.0183 | |||
| 3E1 / Elastic N.V. | 0.01 | -3.68 | 1.08 | -8.92 | 0.2851 | -0.0521 | |||
| EL / The Estée Lauder Companies Inc. | 0.01 | -3.68 | 1.01 | 17.89 | 0.2653 | 0.0227 | |||
| EVR / Evercore Inc. | 0.00 | 0.96 | 0.2529 | 0.2529 | |||||
| FTI / TechnipFMC plc | 0.03 | -3.69 | 0.88 | 4.62 | 0.2327 | -0.0070 | |||
| IJF / ICON Public Limited Company | 0.01 | -3.70 | 0.82 | -19.98 | 0.2150 | -0.0746 | |||
| IT / Gartner, Inc. | 0.00 | -69.25 | 0.48 | -70.38 | 0.1265 | -0.3342 | |||
| CA21037X1345 / CONSTELLATION SOFTWARE INC | 0.00 | 0.00 | 0.00 | 0.0000 | 0.0000 |