Mga Batayang Estadistika
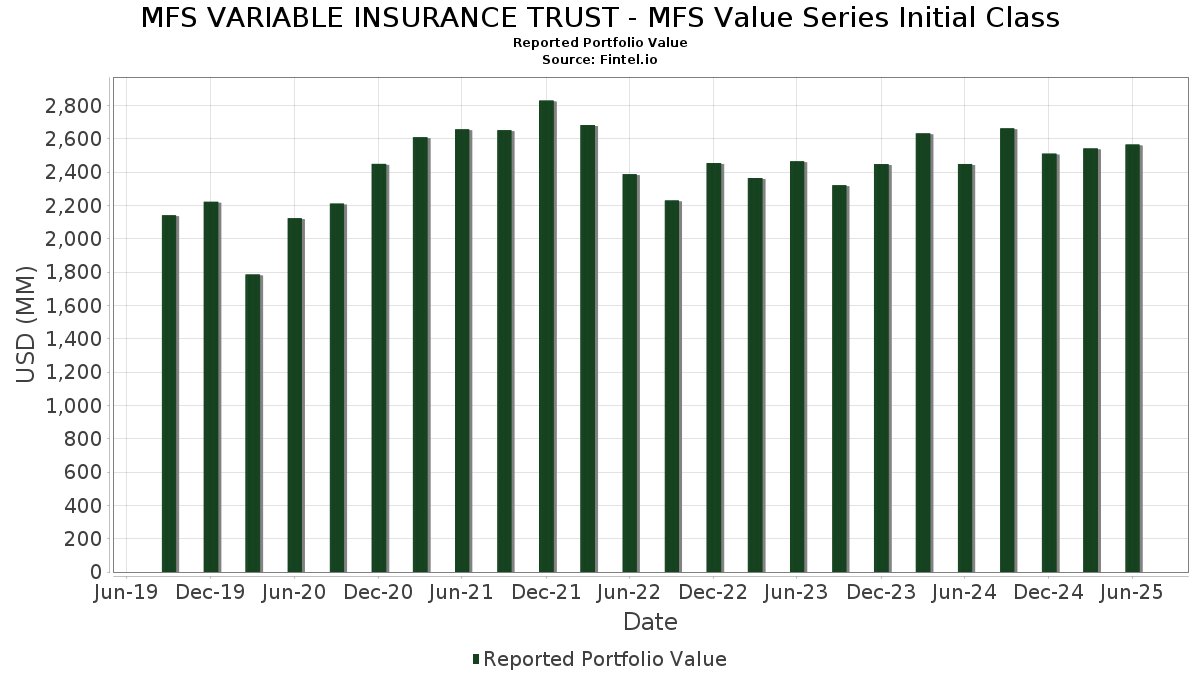
| Nilai Portofolio | $ 2,565,284,901 |
| Posisi Saat Ini | 71 |
Kepemilikan Terbaru, Kinerja, AUM (dari 13F, 13D)
MFS VARIABLE INSURANCE TRUST - MFS Value Series Initial Class telah mengungkapkan total kepemilikan 71 dalam pengajuan SEC terbaru mereka. Nilai portofolio terbaru dihitung sebesar $ 2,565,284,901 USD. Aset yang Dikelola (AUM) sebenarnya adalah nilai ini ditambah kas (yang tidak diungkapkan). Aset-aset utama MFS VARIABLE INSURANCE TRUST - MFS Value Series Initial Class adalah JPMorgan Chase & Co. (US:JPM) , The Progressive Corporation (US:PGR) , The Cigna Group (US:CI) , McKesson Corporation (US:MCK) , and RTX Corporation (US:RTX) . Posisi baru MFS VARIABLE INSURANCE TRUST - MFS Value Series Initial Class meliputi: LPL Financial Holdings Inc. (US:LPLA) , .
Peningkatan Tertinggi Kuartal Ini
Kami menggunakan perubahan dalam alokasi portofolio karena ini adalah metrik yang paling bermakna. Perubahan dapat disebabkan oleh perdagangan atau perubahan harga saham.
| Keamanan | Saham (MM) |
Nilai (Juta Dolar AS) |
Portfolio % | ΔPorsyento ng Portfolio |
|---|---|---|---|---|
| 0.42 | 33.26 | 1.2951 | 0.6308 | |
| 0.42 | 120.53 | 4.6936 | 0.6144 | |
| 0.36 | 47.44 | 1.8472 | 0.4433 | |
| 0.30 | 62.40 | 2.4299 | 0.3984 | |
| 0.02 | 8.96 | 0.3487 | 0.3487 | |
| 0.20 | 62.39 | 2.4296 | 0.3247 | |
| 0.04 | 35.20 | 1.3708 | 0.3022 | |
| 0.04 | 37.20 | 1.4487 | 0.2636 | |
| 0.21 | 51.03 | 1.9872 | 0.2578 | |
| 0.56 | 50.38 | 1.9616 | 0.2523 |
Penurunan Tertinggi Kuartal Ini
Kami menggunakan perubahan dalam alokasi portofolio karena ini adalah metrik yang paling bermakna. Perubahan dapat disebabkan oleh perdagangan atau perubahan harga saham.
| Keamanan | Saham (MM) |
Nilai (Juta Dolar AS) |
Portfolio % | ΔPorsyento ng Portfolio |
|---|---|---|---|---|
| 0.34 | 8.57 | 0.3337 | -0.4872 | |
| 0.40 | 105.95 | 4.1259 | -0.3685 | |
| 0.51 | 46.21 | 1.7994 | -0.3636 | |
| 0.27 | 58.40 | 2.2740 | -0.3330 | |
| 1.95 | 27.19 | 1.0587 | -0.2815 | |
| 0.15 | 10.08 | 0.3925 | -0.2802 | |
| 1.05 | 21.91 | 0.8532 | -0.2747 | |
| 0.13 | 47.13 | 1.8352 | -0.2735 | |
| 0.23 | 33.26 | 1.2950 | -0.2590 | |
| 0.45 | 48.33 | 1.8822 | -0.2507 |
Pengajuan 13F dan Dana
Formulir ini diajukan pada 2025-08-25 untuk periode pelaporan 2025-06-30. Klik ikon tautan untuk melihat riwayat transaksi selengkapnya.
Tingkatkan ke versi premium untuk membuka data premium dan ekspor ke Excel. ![]() .
.
| Keamanan | Ketik | Harga Saham Rata-rata | Saham (MM) |
ΔSaham (%) |
ΔSaham (%) |
Nilai ($MM) |
Portpolyo (%) |
ΔPortofolio (%) |
|
|---|---|---|---|---|---|---|---|---|---|
| JPM / JPMorgan Chase & Co. | 0.42 | -1.69 | 120.53 | 16.19 | 4.6936 | 0.6144 | |||
| PGR / The Progressive Corporation | 0.40 | -1.69 | 105.95 | -7.30 | 4.1259 | -0.3685 | |||
| CI / The Cigna Group | 0.25 | -1.69 | 83.70 | -1.22 | 3.2594 | -0.0725 | |||
| MCK / McKesson Corporation | 0.11 | -11.37 | 78.46 | -3.50 | 3.0554 | -0.1418 | |||
| RTX / RTX Corporation | 0.44 | -1.69 | 63.84 | 8.37 | 2.4858 | 0.1696 | |||
| BA / The Boeing Company | 0.30 | -1.69 | 62.40 | 20.78 | 2.4299 | 0.3984 | |||
| AXP / American Express Company | 0.20 | -1.69 | 62.39 | 16.55 | 2.4296 | 0.3247 | |||
| MMC / Marsh & McLennan Companies, Inc. | 0.27 | -1.69 | 58.40 | -11.92 | 2.2740 | -0.3330 | |||
| MS / Morgan Stanley | 0.38 | -15.50 | 52.88 | 2.02 | 2.0593 | 0.0211 | |||
| DUK / Duke Energy Corporation | 0.44 | -1.69 | 52.03 | -4.89 | 2.0261 | -0.1250 | |||
| JNJ / Johnson & Johnson | 0.34 | -1.69 | 51.94 | -9.45 | 2.0225 | -0.2329 | |||
| ADI / Analog Devices, Inc. | 0.21 | -1.69 | 51.03 | 16.03 | 1.9872 | 0.2578 | |||
| NDAQ / Nasdaq, Inc. | 0.56 | -1.69 | 50.38 | 15.88 | 1.9616 | 0.2523 | |||
| GD / General Dynamics Corporation | 0.17 | -1.69 | 49.77 | 5.19 | 1.9379 | 0.0776 | |||
| XOM / Exxon Mobil Corporation | 0.45 | -1.69 | 48.33 | -10.89 | 1.8822 | -0.2507 | |||
| SO / The Southern Company | 0.52 | -1.69 | 48.09 | -1.82 | 1.8725 | -0.0534 | |||
| KKR / KKR & Co. Inc. | 0.36 | 15.46 | 47.44 | 32.86 | 1.8472 | 0.4433 | |||
| AON / Aon plc | 0.13 | -1.69 | 47.13 | -12.12 | 1.8352 | -0.2735 | |||
| TRV / The Travelers Companies, Inc. | 0.18 | -1.69 | 46.93 | -0.55 | 1.8275 | -0.0280 | |||
| COP / ConocoPhillips | 0.51 | -1.69 | 46.21 | -16.00 | 1.7994 | -0.3636 | |||
| LOW / Lowe's Companies, Inc. | 0.21 | -1.69 | 45.54 | -6.48 | 1.7733 | -0.1414 | |||
| CSA / Accenture plc | 0.15 | 11.07 | 45.14 | 6.39 | 1.7579 | 0.0894 | |||
| D / Dominion Energy, Inc. | 0.79 | 3.09 | 44.85 | 3.92 | 1.7464 | 0.0494 | |||
| UNP / Union Pacific Corporation | 0.19 | -1.69 | 44.31 | -4.25 | 1.7256 | -0.0943 | |||
| CB / Chubb Limited | 0.15 | -1.69 | 44.25 | -5.68 | 1.7232 | -0.1217 | |||
| C / Citigroup Inc. | 0.51 | -1.69 | 43.73 | 17.88 | 1.7027 | 0.2441 | |||
| HON / Honeywell International Inc. | 0.19 | -1.69 | 43.14 | 8.12 | 1.6799 | 0.1109 | |||
| PNC / The PNC Financial Services Group, Inc. | 0.23 | -1.69 | 43.08 | 4.27 | 1.6776 | 0.0529 | |||
| PLD / Prologis, Inc. | 0.39 | 9.96 | 40.70 | 3.40 | 1.5850 | 0.0371 | |||
| TXN / Texas Instruments Incorporated | 0.19 | -1.69 | 38.78 | 13.58 | 1.5102 | 0.1676 | |||
| ABT / Abbott Laboratories | 0.28 | -1.69 | 38.57 | 0.80 | 1.5019 | -0.0027 | |||
| BLK / BlackRock, Inc. | 0.04 | 11.35 | 37.20 | 23.44 | 1.4487 | 0.2636 | |||
| ABBV / AbbVie Inc. | 0.19 | -1.69 | 35.97 | -12.91 | 1.4006 | -0.2233 | |||
| KLAC / KLA Corporation | 0.04 | -1.69 | 35.20 | 29.54 | 1.3708 | 0.3022 | |||
| MAR / Marriott International, Inc. | 0.13 | -1.69 | 34.61 | 12.76 | 1.3477 | 0.1408 | |||
| VNX / NXP Semiconductors N.V. | 0.15 | 8.59 | 33.74 | 24.83 | 1.3140 | 0.2511 | |||
| PFE / Pfizer Inc. | 1.38 | -1.69 | 33.44 | -5.96 | 1.3022 | -0.0961 | |||
| WFC / Wells Fargo & Company | 0.42 | 76.39 | 33.26 | 96.87 | 1.2951 | 0.6308 | |||
| CVX / Chevron Corporation | 0.23 | -1.69 | 33.26 | -15.85 | 1.2950 | -0.2590 | |||
| XEL / Xcel Energy Inc. | 0.44 | 26.88 | 29.94 | 22.06 | 1.1658 | 0.2013 | |||
| NOC / Northrop Grumman Corporation | 0.06 | -1.69 | 29.83 | -4.00 | 1.1615 | -0.0602 | |||
| ELV / Elevance Health, Inc. | 0.08 | -1.69 | 29.72 | -12.09 | 1.1572 | -0.1720 | |||
| NESN / Nestlé S.A. | 0.30 | -12.40 | 29.52 | -13.94 | 1.1493 | -0.1992 | |||
| 3EC / Eaton Corporation plc | 0.08 | -1.69 | 28.82 | 29.10 | 1.1223 | 0.2445 | |||
| PCAR / PACCAR Inc | 0.30 | -1.69 | 28.21 | -4.02 | 1.0984 | -0.0572 | |||
| MDLZ / Mondelez International, Inc. | 0.41 | -1.69 | 27.92 | -2.29 | 1.0873 | -0.0363 | |||
| ITW / Illinois Tool Works Inc. | 0.11 | 11.97 | 27.21 | 11.63 | 1.0597 | 0.1011 | |||
| PCG / PG&E Corporation | 1.95 | -1.69 | 27.19 | -20.23 | 1.0587 | -0.2815 | |||
| PEP / PepsiCo, Inc. | 0.20 | -1.69 | 26.31 | -13.43 | 1.0245 | -0.1705 | |||
| EFX / Equifax Inc. | 0.10 | -1.69 | 26.06 | 4.69 | 1.0147 | 0.0360 | |||
| US55291X1090 / MFS Institutional Money Market Portfolio | 24.84 | -0.62 | 24.84 | -0.62 | 0.9674 | -0.0155 | |||
| KVUE / Kenvue Inc. | 1.05 | -12.49 | 21.91 | -23.62 | 0.8532 | -0.2747 | |||
| EOG / EOG Resources, Inc. | 0.16 | -1.69 | 19.49 | -8.31 | 0.7591 | -0.0769 | |||
| EXC / Exelon Corporation | 0.45 | -1.69 | 19.37 | -7.36 | 0.7544 | -0.0680 | |||
| MRK / Merck & Co., Inc. | 0.24 | -1.69 | 18.96 | -13.30 | 0.7381 | -0.1216 | |||
| KMB / Kimberly-Clark Corporation | 0.13 | -1.69 | 16.64 | -10.89 | 0.6481 | -0.0863 | |||
| TGT / Target Corporation | 0.16 | -16.68 | 15.60 | -21.24 | 0.6076 | -0.1714 | |||
| RKT / Reckitt Benckiser Group plc | 0.23 | -1.69 | 15.49 | -1.03 | 0.6033 | -0.0122 | |||
| CRG / CRH plc | 0.17 | 43.96 | 15.40 | 50.24 | 0.5997 | 0.1966 | |||
| AEP / American Electric Power Company, Inc. | 0.11 | -1.69 | 11.31 | -6.65 | 0.4404 | -0.0360 | |||
| CNI / Canadian National Railway Company | 0.10 | -1.69 | 10.85 | 4.94 | 0.4225 | 0.0160 | |||
| SHW / The Sherwin-Williams Company | 0.03 | -1.69 | 10.68 | -3.33 | 0.4158 | -0.0185 | |||
| DD / DuPont de Nemours, Inc. | 0.15 | -35.85 | 10.08 | -41.08 | 0.3925 | -0.2802 | |||
| GWW / W.W. Grainger, Inc. | 0.01 | -1.69 | 9.52 | 3.54 | 0.3706 | 0.0091 | |||
| CTVA / Corteva, Inc. | 0.12 | -48.15 | 9.03 | -38.60 | 0.3517 | -0.2267 | |||
| LPLA / LPL Financial Holdings Inc. | 0.02 | 8.96 | 0.3487 | 0.3487 | |||||
| DGE / Diageo plc | 0.34 | -57.33 | 8.57 | -58.96 | 0.3337 | -0.4872 | |||
| OTIS / Otis Worldwide Corporation | 0.08 | -1.69 | 8.18 | -5.67 | 0.3186 | -0.0225 | |||
| 2IS / Trane Technologies plc | 0.02 | -1.69 | 8.18 | 27.63 | 0.3185 | 0.0665 | |||
| PSA / Public Storage | 0.03 | -1.69 | 7.89 | -3.62 | 0.3072 | -0.0146 | |||
| CDW / CDW Corporation | 0.04 | 38.57 | 6.99 | 54.41 | 0.2721 | 0.0942 |