Mga Batayang Estadistika
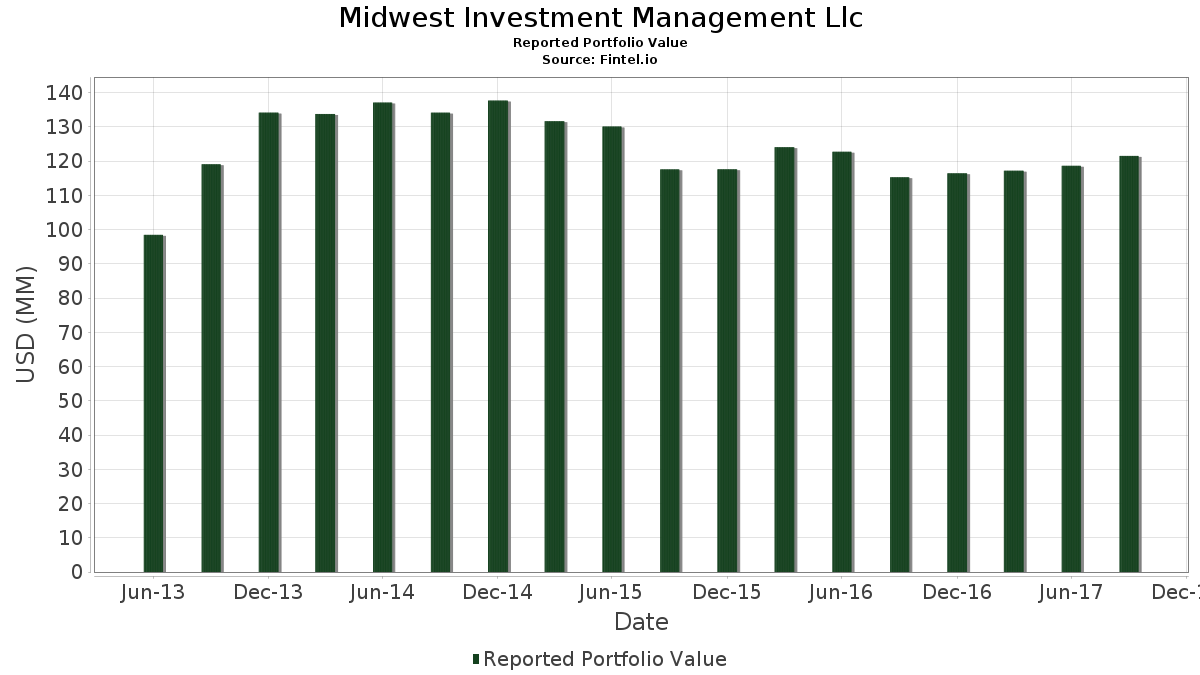
| Nilai Portofolio | $ 121,493,000 |
| Posisi Saat Ini | 55 |
Kepemilikan Terbaru, Kinerja, AUM (dari 13F, 13D)
Midwest Investment Management Llc telah mengungkapkan total kepemilikan 55 dalam pengajuan SEC terbaru mereka. Nilai portofolio terbaru dihitung sebesar $ 121,493,000 USD. Aset yang Dikelola (AUM) sebenarnya adalah nilai ini ditambah kas (yang tidak diungkapkan). Aset-aset utama Midwest Investment Management Llc adalah Berkshire Hathaway Inc. (US:BRK.B) , Wells Fargo & Company (US:WFC) , Visa Inc. (US:V) , Union Pacific Corporation (US:UNP) , and Phillips 66 (US:PSX) . Posisi baru Midwest Investment Management Llc meliputi: Snap-on Incorporated (US:SNA) , Abbott Laboratories (US:ABT) , McDonald's Corporation (US:MCD) , .
Peningkatan Tertinggi Kuartal Ini
Kami menggunakan perubahan dalam alokasi portofolio karena ini adalah metrik yang paling bermakna. Perubahan dapat disebabkan oleh perdagangan atau perubahan harga saham.
| Keamanan | Saham (MM) |
Nilai (Juta Dolar AS) |
Portfolio % | ΔPorsyento ng Portfolio |
|---|---|---|---|---|
| 0.07 | 3.17 | 2.6100 | 2.6100 | |
| 0.04 | 3.06 | 2.5170 | 2.5170 | |
| 0.06 | 2.87 | 2.3598 | 2.3598 | |
| 0.07 | 2.78 | 2.2898 | 2.2898 | |
| 0.02 | 1.67 | 1.3779 | 1.3779 | |
| 0.06 | 1.56 | 1.2840 | 1.2840 | |
| 0.01 | 1.54 | 1.2651 | 1.2651 | |
| 0.09 | 15.63 | 12.8658 | 0.7588 | |
| 0.04 | 3.52 | 2.9006 | 0.4092 | |
| 0.05 | 5.35 | 4.4068 | 0.2739 |
Penurunan Tertinggi Kuartal Ini
Kami menggunakan perubahan dalam alokasi portofolio karena ini adalah metrik yang paling bermakna. Perubahan dapat disebabkan oleh perdagangan atau perubahan harga saham.
| Keamanan | Saham (MM) |
Nilai (Juta Dolar AS) |
Portfolio % | ΔPorsyento ng Portfolio |
|---|---|---|---|---|
| 0.03 | 1.91 | 1.5688 | -1.6620 | |
| 0.05 | 3.94 | 3.2413 | -0.4784 | |
| 0.15 | 8.20 | 6.7502 | -0.4634 | |
| 0.05 | 3.22 | 2.6528 | -0.4540 | |
| 0.03 | 2.66 | 2.1861 | -0.1864 | |
| 0.01 | 1.47 | 1.2132 | -0.1593 | |
| 0.04 | 1.74 | 1.4338 | -0.1386 | |
| 0.05 | 1.78 | 1.4651 | -0.0930 | |
| 0.03 | 2.43 | 2.0026 | -0.0875 | |
| 0.07 | 3.69 | 3.0413 | -0.0866 |
Pengajuan 13F dan Dana
Formulir ini diajukan pada 2017-10-13 untuk periode pelaporan 2017-09-30. Klik ikon tautan untuk melihat riwayat transaksi selengkapnya.
Tingkatkan ke versi premium untuk membuka data premium dan ekspor ke Excel. ![]() .
.
| Keamanan | Ketik | Harga Saham Rata-rata | Saham (MM) |
ΔSaham (%) |
ΔSaham (%) |
Nilai ($MM) |
Portpolyo (%) |
ΔPortofolio (%) |
|
|---|---|---|---|---|---|---|---|---|---|
| BRK.B / Berkshire Hathaway Inc. | 0.09 | 0.57 | 15.63 | 8.85 | 12.8658 | 0.7588 | |||
| WFC / Wells Fargo & Company | 0.15 | -3.69 | 8.20 | -4.15 | 6.7502 | -0.4634 | |||
| V / Visa Inc. | 0.05 | -2.68 | 5.35 | 9.22 | 4.4068 | 0.2739 | |||
| UNP / Union Pacific Corporation | 0.04 | -2.94 | 5.20 | 3.36 | 4.2776 | 0.0385 | |||
| PSX / Phillips 66 | 0.05 | -1.69 | 4.51 | 8.91 | 3.7113 | 0.2209 | |||
| RSG / Republic Services, Inc. | 0.06 | -2.27 | 4.27 | 1.30 | 3.5171 | -0.0391 | |||
| BRK.A / Berkshire Hathaway Inc. | 0.00 | -6.25 | 4.12 | 1.13 | 3.3920 | -0.0437 | |||
| KHC / The Kraft Heinz Company | 0.05 | -1.43 | 3.94 | -10.74 | 3.2413 | -0.4784 | |||
| USB / U.S. Bancorp | 0.07 | -3.51 | 3.69 | -0.40 | 3.0413 | -0.0866 | |||
| TROW / T. Rowe Price Group, Inc. | 0.04 | -2.37 | 3.52 | 19.26 | 2.9006 | 0.4092 | |||
| AAPL / Apple Inc. | 0.02 | -3.27 | 3.44 | 3.52 | 2.8347 | 0.0297 | |||
| DVA / DaVita Inc. | 0.05 | -4.62 | 3.22 | -12.54 | 2.6528 | -0.4540 | |||
| TMO / Thermo Fisher Scientific Inc. | 0.02 | -3.42 | 3.20 | 4.75 | 2.6314 | 0.0583 | |||
| AN / AutoNation, Inc. | 0.07 | -2.76 | 3.17 | 9.46 | 2.6100 | 2.6100 | |||
| C / Citigroup Inc. | 0.04 | 32.09 | 3.06 | 43.70 | 2.5170 | 2.5170 | |||
| DAL / Delta Air Lines, Inc. | 0.06 | 9.18 | 2.87 | -2.05 | 2.3598 | 2.3598 | |||
| DHI / D.R. Horton, Inc. | 0.07 | -1.27 | 2.78 | 14.02 | 2.2898 | 2.2898 | |||
| JPM / JPMorgan Chase & Co. | 0.03 | -2.07 | 2.67 | 2.34 | 2.1968 | -0.0020 | |||
| NSRGY / Nestlé S.A. - Depositary Receipt (Common Stock) | 0.03 | -2.04 | 2.66 | -5.61 | 2.1861 | -0.1864 | |||
| TJX / The TJX Companies, Inc. | 0.04 | -2.63 | 2.61 | -0.53 | 2.1491 | -0.0641 | |||
| FBHS / Fortune Brands Home & Security Inc | 0.04 | -2.83 | 2.59 | 0.12 | 2.1335 | -0.0493 | |||
| SLB / Schlumberger Limited | 0.03 | -7.37 | 2.43 | -1.86 | 2.0026 | -0.0875 | |||
| LOW / Lowe's Companies, Inc. | 0.03 | -2.85 | 2.02 | 0.15 | 1.6610 | -0.0379 | |||
| CMI / Cummins Inc. | 0.01 | -2.26 | 1.91 | 1.27 | 1.5754 | -0.0181 | |||
| AME / AMETEK, Inc. | 0.03 | -54.38 | 1.91 | -50.26 | 1.5688 | -1.6620 | |||
| CMCSA / Comcast Corporation | 0.05 | -2.59 | 1.78 | -3.68 | 1.4651 | -0.0930 | |||
| PCAR / PACCAR Inc | 0.02 | -2.08 | 1.76 | 7.24 | 1.4511 | 0.0650 | |||
| ORCL / Oracle Corporation | 0.04 | -3.13 | 1.74 | -6.60 | 1.4338 | -0.1386 | |||
| CVS / CVS Health Corporation | 0.02 | -1.79 | 1.71 | -0.76 | 1.4050 | -0.0451 | |||
| TEL / TE Connectivity plc | 0.02 | -2.30 | 1.67 | 3.14 | 1.3779 | 1.3779 | |||
| DFS / Discover Financial Services | 0.03 | -3.18 | 1.66 | 0.36 | 1.3688 | -0.0282 | |||
| FOX / Fox Corporation | 0.06 | -9.76 | 1.56 | -16.04 | 1.2840 | 1.2840 | |||
| SNA / Snap-on Incorporated | 0.01 | 1.54 | 1.2651 | 1.2651 | |||||
| MTB / M&T Bank Corporation | 0.01 | -8.97 | 1.47 | -9.46 | 1.2132 | -0.1593 | |||
| PH / Parker-Hannifin Corporation | 0.01 | -2.20 | 1.40 | 7.13 | 1.1499 | 0.0504 | |||
| VIG / Vanguard Specialized Funds - Vanguard Dividend Appreciation ETF | 0.01 | 0.00 | 0.52 | 2.36 | 0.4288 | -0.0003 | |||
| DIS / The Walt Disney Company | 0.00 | 0.00 | 0.49 | -7.24 | 0.4008 | -0.0418 | |||
| BAMH / Brookfield Finance Inc - 4.625% NT REDEEM 16/10/2080 USD 25 | 0.01 | 0.00 | 0.45 | 5.37 | 0.3712 | 0.0104 | |||
| MMM / 3M Company | 0.00 | 0.00 | 0.42 | 0.95 | 0.3498 | -0.0051 | |||
| XOM / Exxon Mobil Corporation | 0.00 | 0.00 | 0.38 | 1.59 | 0.3161 | -0.0026 | |||
| BAC / Bank of America Corporation | 0.01 | 0.00 | 0.37 | 4.48 | 0.3070 | 0.0060 | |||
| PEP / PepsiCo, Inc. | 0.00 | 0.00 | 0.34 | -3.74 | 0.2757 | -0.0177 | |||
| GOOGL / Alphabet Inc. | 0.00 | 0.00 | 0.31 | 4.71 | 0.2560 | 0.0056 | |||
| RTX / RTX Corporation | 0.00 | 0.00 | 0.30 | -5.00 | 0.2502 | -0.0196 | |||
| SYY / Sysco Corporation | 0.01 | 0.00 | 0.29 | 7.30 | 0.2420 | 0.2420 | |||
| JNJ / Johnson & Johnson | 0.00 | 0.00 | 0.27 | -1.80 | 0.2247 | -0.0097 | |||
| PG / The Procter & Gamble Company | 0.00 | 0.00 | 0.25 | 4.10 | 0.2091 | 0.0033 | |||
| GE / General Electric Company | 0.01 | 0.00 | 0.24 | -10.62 | 0.2008 | -0.0293 | |||
| PM / Philip Morris International Inc. | 0.00 | -4.35 | 0.24 | -9.63 | 0.2008 | -0.0268 | |||
| KMB / Kimberly-Clark Corporation | 0.00 | 0.00 | 0.23 | -8.76 | 0.1885 | -0.0231 | |||
| CSCO / Cisco Systems, Inc. | 0.01 | 0.00 | 0.23 | 7.55 | 0.1877 | 0.0089 | |||
| MSFT / Microsoft Corporation | 0.00 | 0.00 | 0.22 | 8.25 | 0.1835 | 0.0099 | |||
| EMR / Emerson Electric Co. | 0.00 | 0.00 | 0.22 | 5.31 | 0.1794 | 0.1794 | |||
| ABT / Abbott Laboratories | 0.00 | 0.21 | 0.1745 | 0.1745 | |||||
| MCD / McDonald's Corporation | 0.00 | 0.20 | 0.1663 | 0.1663 |