Mga Batayang Estadistika
| Nilai Portofolio | $ 234,661,300 |
| Posisi Saat Ini | 117 |
Kepemilikan Terbaru, Kinerja, AUM (dari 13F, 13D)
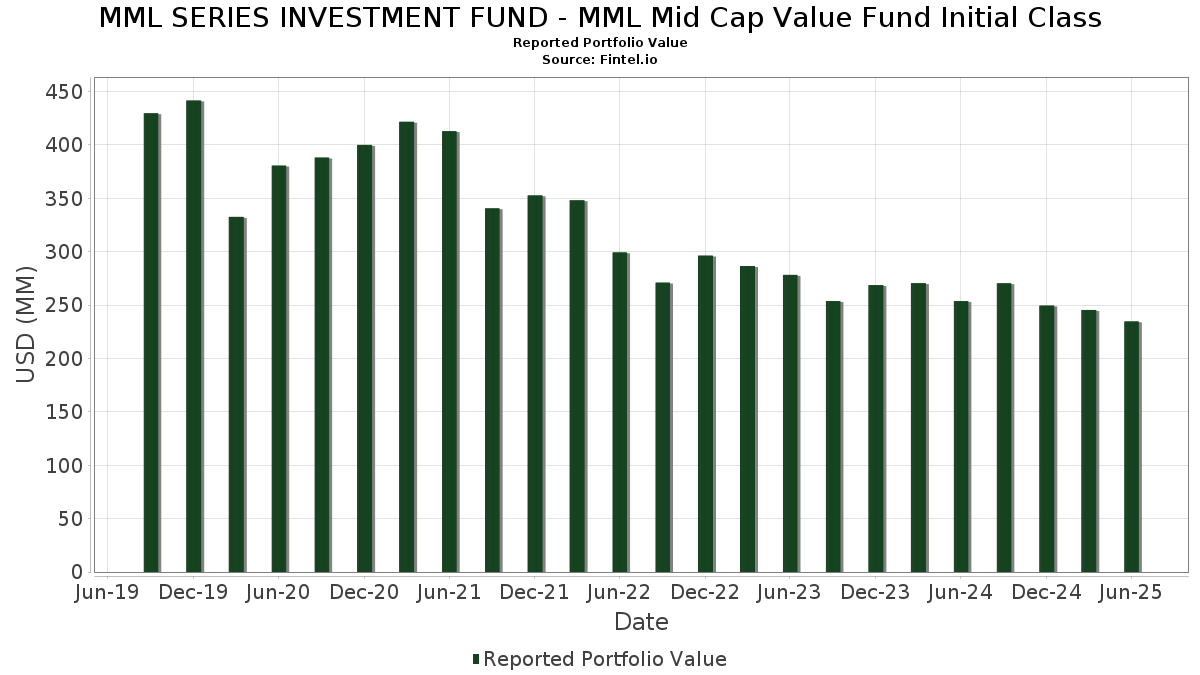
MML SERIES INVESTMENT FUND - MML Mid Cap Value Fund Initial Class telah mengungkapkan total kepemilikan 117 dalam pengajuan SEC terbaru mereka. Nilai portofolio terbaru dihitung sebesar $ 234,661,300 USD. Aset yang Dikelola (AUM) sebenarnya adalah nilai ini ditambah kas (yang tidak diungkapkan). Aset-aset utama MML SERIES INVESTMENT FUND - MML Mid Cap Value Fund Initial Class adalah Zimmer Biomet Holdings, Inc. (US:ZBH) , Enterprise Products Partners L.P. - Limited Partnership (US:EPD) , Henry Schein, Inc. (US:HSIC) , Truist Financial Corporation (US:TFC) , and U.S. Bancorp (US:USB) . Posisi baru MML SERIES INVESTMENT FUND - MML Mid Cap Value Fund Initial Class meliputi: Hexcel Corporation (US:HXL) , The Toro Company (US:TTC) , NXP Semiconductors N.V. (US:NXPI) , Raymond James Financial, Inc. (US:RJF) , and Ashtead Group plc (GB:AHT) .
Peningkatan Tertinggi Kuartal Ini
Kami menggunakan perubahan dalam alokasi portofolio karena ini adalah metrik yang paling bermakna. Perubahan dapat disebabkan oleh perdagangan atau perubahan harga saham.
| Keamanan | Saham (MM) |
Nilai (Juta Dolar AS) |
Portfolio % | ΔPorsyento ng Portfolio |
|---|---|---|---|---|
| 0.01 | 2.56 | 1.0934 | 0.9316 | |
| 2.16 | 0.9211 | 0.9211 | ||
| 0.02 | 3.21 | 1.3695 | 0.7026 | |
| 0.03 | 1.48 | 0.6320 | 0.6320 | |
| 0.03 | 2.30 | 0.9847 | 0.5972 | |
| 0.01 | 2.71 | 1.1577 | 0.5760 | |
| 0.02 | 1.33 | 0.5688 | 0.5688 | |
| 0.01 | 1.30 | 0.5542 | 0.5542 | |
| 0.01 | 1.26 | 0.5367 | 0.5367 | |
| 0.09 | 3.33 | 1.4217 | 0.5201 |
Penurunan Tertinggi Kuartal Ini
Kami menggunakan perubahan dalam alokasi portofolio karena ini adalah metrik yang paling bermakna. Perubahan dapat disebabkan oleh perdagangan atau perubahan harga saham.
| Keamanan | Saham (MM) |
Nilai (Juta Dolar AS) |
Portfolio % | ΔPorsyento ng Portfolio |
|---|---|---|---|---|
| 0.00 | 0.92 | 0.3917 | -0.7519 | |
| 0.02 | 0.59 | 0.2529 | -0.6277 | |
| 0.01 | 1.35 | 0.5786 | -0.5827 | |
| 0.01 | 1.17 | 0.4984 | -0.4479 | |
| 0.04 | 1.75 | 0.7484 | -0.4228 | |
| 0.02 | 1.58 | 0.6734 | -0.4166 | |
| 0.02 | 1.15 | 0.4928 | -0.4135 | |
| 0.00 | 0.47 | 0.2016 | -0.3697 | |
| 0.01 | 1.87 | 0.8008 | -0.3637 | |
| 0.07 | 6.31 | 2.6938 | -0.3546 |
Pengajuan 13F dan Dana
Formulir ini diajukan pada 2025-08-25 untuk periode pelaporan 2025-06-30. Klik ikon tautan untuk melihat riwayat transaksi selengkapnya.
Tingkatkan ke versi premium untuk membuka data premium dan ekspor ke Excel. ![]() .
.
| Keamanan | Ketik | Harga Saham Rata-rata | Saham (MM) |
ΔSaham (%) |
ΔSaham (%) |
Nilai ($MM) |
Portpolyo (%) |
ΔPortofolio (%) |
|
|---|---|---|---|---|---|---|---|---|---|
| ZBH / Zimmer Biomet Holdings, Inc. | 0.07 | 5.46 | 6.31 | -15.02 | 2.6938 | -0.3546 | |||
| EPD / Enterprise Products Partners L.P. - Limited Partnership | 0.16 | 3.07 | 4.96 | -6.38 | 2.1184 | -0.0579 | |||
| HSIC / Henry Schein, Inc. | 0.07 | -7.26 | 4.82 | -1.09 | 2.0575 | 0.0569 | |||
| TFC / Truist Financial Corporation | 0.11 | 0.94 | 4.70 | 5.46 | 2.0065 | 0.1765 | |||
| USB / U.S. Bancorp | 0.10 | -9.25 | 4.61 | -2.74 | 1.9698 | 0.0219 | |||
| WTY / Willis Towers Watson Public Limited Company | 0.01 | 17.65 | 4.29 | 6.72 | 1.8320 | 0.1807 | |||
| NTRS / Northern Trust Corporation | 0.03 | -11.59 | 4.19 | 13.65 | 1.7892 | 0.2748 | |||
| LH / Labcorp Holdings Inc. | 0.02 | -11.52 | 4.11 | -0.19 | 1.7542 | 0.0636 | |||
| KVUE / Kenvue Inc. | 0.19 | 32.20 | 3.93 | 15.39 | 1.6788 | 0.2794 | |||
| MSM / MSC Industrial Direct Co., Inc. | 0.04 | -8.14 | 3.75 | 0.54 | 1.6016 | 0.0696 | |||
| NSC / Norfolk Southern Corporation | 0.01 | -22.31 | 3.74 | -16.03 | 1.5996 | -0.2328 | |||
| OSK / Oshkosh Corporation | 0.03 | -5.10 | 3.71 | 14.53 | 1.5830 | 0.2536 | |||
| O / Realty Income Corporation | 0.06 | 0.00 | 3.65 | -0.68 | 1.5607 | 0.0492 | |||
| CBSH / Commerce Bancshares, Inc. | 0.06 | -3.97 | 3.65 | -4.07 | 1.5595 | -0.0039 | |||
| CSX / CSX Corporation | 0.11 | 18.46 | 3.65 | 31.34 | 1.5578 | 0.4171 | |||
| VICI / VICI Properties Inc. | 0.10 | -11.84 | 3.40 | -11.89 | 1.4536 | -0.1332 | |||
| ES / Eversource Energy | 0.05 | 12.41 | 3.38 | 15.15 | 1.4456 | 0.2381 | |||
| EVRG / Evergy, Inc. | 0.05 | -15.48 | 3.35 | -15.51 | 1.4295 | -0.1976 | |||
| BKR / Baker Hughes Company | 0.09 | 73.86 | 3.33 | 51.64 | 1.4217 | 0.5201 | |||
| LHX / L3Harris Technologies, Inc. | 0.01 | -23.98 | 3.32 | -8.89 | 1.4184 | -0.0790 | |||
| BNZL / Bunzl plc | 0.10 | 51.36 | 3.31 | 25.82 | 1.4159 | 0.3336 | |||
| RGA / Reinsurance Group of America, Incorporated | 0.02 | 36.72 | 3.31 | 37.75 | 1.4125 | 0.4262 | |||
| BDX / Becton, Dickinson and Company | 0.02 | 14.59 | 3.24 | -13.82 | 1.3853 | -0.1609 | |||
| XEL / Xcel Energy Inc. | 0.05 | 14.66 | 3.24 | 10.31 | 1.3848 | 0.1773 | |||
| KMB / Kimberly-Clark Corporation | 0.02 | 17.99 | 3.21 | 6.96 | 1.3714 | 0.1382 | |||
| PNC / The PNC Financial Services Group, Inc. | 0.02 | 86.22 | 3.21 | 97.47 | 1.3695 | 0.7026 | |||
| EQR / Equity Residential | 0.05 | 0.12 | 3.18 | -5.61 | 1.3576 | -0.0256 | |||
| GPK / Graphic Packaging Holding Company | 0.15 | 9.72 | 3.17 | -10.96 | 1.3536 | -0.1083 | |||
| NWE / NorthWestern Energy Group, Inc. | 0.06 | -9.58 | 3.02 | -19.83 | 1.2902 | -0.2580 | |||
| PKG / Packaging Corporation of America | 0.01 | 101.12 | 2.71 | 91.45 | 1.1577 | 0.5760 | |||
| PSA / Public Storage | 0.01 | -2.37 | 2.59 | -4.26 | 1.1048 | -0.0053 | |||
| CMI / Cummins Inc. | 0.01 | 522.21 | 2.56 | 551.15 | 1.0934 | 0.9316 | |||
| AOS / Amdocs Limited | 0.03 | -25.59 | 2.52 | -25.78 | 1.0749 | -0.3183 | |||
| GEHC / GE HealthCare Technologies Inc. | 0.03 | 47.20 | 2.50 | 35.12 | 1.0668 | 0.3073 | |||
| SR / Spire Inc. | 0.03 | -11.81 | 2.45 | -17.75 | 1.0473 | -0.1772 | |||
| EL / The Estée Lauder Companies Inc. | 0.03 | 4.13 | 2.44 | 27.47 | 1.0408 | 0.2556 | |||
| HPQ / HP Inc. | 0.10 | -3.83 | 2.34 | -15.05 | 1.0007 | -0.1323 | |||
| MDT / Medtronic plc | 0.03 | -0.10 | 2.34 | -3.11 | 0.9978 | 0.0075 | |||
| AMT / American Tower Corporation | 0.01 | -7.40 | 2.31 | -5.95 | 0.9854 | -0.0222 | |||
| TER / Teradyne, Inc. | 0.03 | 124.50 | 2.30 | 144.33 | 0.9847 | 0.5972 | |||
| RKT / Reckitt Benckiser Group plc | 0.03 | 2.73 | 2.30 | 3.41 | 0.9841 | 0.0689 | |||
| LUV / Southwest Airlines Co. | 0.07 | 5.28 | 2.30 | 1.68 | 0.9829 | 0.0534 | |||
| RS / Reliance, Inc. | 0.01 | 0.00 | 2.21 | 8.69 | 0.9458 | 0.1090 | |||
| CAG / Conagra Brands, Inc. | 0.11 | -7.67 | 2.18 | -29.15 | 0.9308 | -0.3325 | |||
| OGS / ONE Gas, Inc. | 0.03 | -14.89 | 2.18 | -19.09 | 0.9305 | -0.1757 | |||
| FIXED INC CLEARING CORP.REPO / RA (000000000) | 2.16 | 0.9211 | 0.9211 | ||||||
| RI / Pernod Ricard SA | 0.02 | -9.80 | 2.08 | -9.25 | 0.8882 | -0.0535 | |||
| CTRA / Coterra Energy Inc. | 0.08 | 0.00 | 2.03 | -12.18 | 0.8661 | -0.0824 | |||
| PB / Prosperity Bancshares, Inc. | 0.03 | 69.04 | 2.03 | 75.41 | 0.8657 | 0.4366 | |||
| CTSH / Cognizant Technology Solutions Corporation | 0.03 | 27.41 | 2.01 | 29.95 | 0.8586 | 0.2232 | |||
| TE Connectivity PLC / EC (IE000IVNQZ81) | 0.01 | -31.38 | 1.96 | -18.08 | 0.8362 | -0.1457 | |||
| HOLX / Hologic, Inc. | 0.03 | 5.09 | 1.93 | 10.85 | 0.8252 | 0.1093 | |||
| TROW / T. Rowe Price Group, Inc. | 0.02 | -25.34 | 1.91 | -21.58 | 0.8153 | -0.1847 | |||
| DOC / Healthpeak Properties, Inc. | 0.11 | 7.66 | 1.90 | -6.77 | 0.8117 | -0.0257 | |||
| IQV / IQVIA Holdings Inc. | 0.01 | 11.07 | 1.90 | -0.73 | 0.8115 | 0.0253 | |||
| DGX / Quest Diagnostics Incorporated | 0.01 | -37.70 | 1.87 | -33.87 | 0.8008 | -0.3637 | |||
| TKR / The Timken Company | 0.03 | 6.54 | 1.85 | 7.55 | 0.7912 | 0.0837 | |||
| CNC / Centene Corporation | 0.03 | -5.18 | 1.83 | -15.23 | 0.7798 | -0.1049 | |||
| VTR / Ventas, Inc. | 0.03 | -13.46 | 1.81 | -20.53 | 0.7743 | -0.1627 | |||
| GIS / General Mills, Inc. | 0.03 | -8.24 | 1.78 | -20.47 | 0.7585 | -0.1590 | |||
| MHK / Mohawk Industries, Inc. | 0.02 | 1.20 | 1.77 | -7.08 | 0.7575 | -0.0266 | |||
| HEN3 / Henkel AG & Co. KGaA - Preferred Stock | 0.02 | -6.49 | 1.77 | -7.61 | 0.7574 | -0.0313 | |||
| IPG / The Interpublic Group of Companies, Inc. | 0.07 | 0.00 | 1.76 | -9.84 | 0.7515 | -0.0504 | |||
| EXP / Eagle Materials Inc. | 0.01 | 90.16 | 1.75 | 73.15 | 0.7495 | 0.3333 | |||
| AD / Koninklijke Ahold Delhaize N.V. | 0.04 | -45.04 | 1.75 | -38.56 | 0.7484 | -0.4228 | |||
| OMC / Omnicom Group Inc. | 0.02 | 4.87 | 1.68 | -8.99 | 0.7180 | -0.0409 | |||
| HEIA / Heineken N.V. | 0.02 | -9.19 | 1.66 | -2.64 | 0.7101 | 0.0086 | |||
| PPG / PPG Industries, Inc. | 0.01 | 7.29 | 1.66 | 11.59 | 0.7076 | 0.0978 | |||
| NVST / Envista Holdings Corporation | 0.08 | -11.75 | 1.59 | -0.06 | 0.6806 | 0.0254 | |||
| BK / The Bank of New York Mellon Corporation | 0.02 | -45.31 | 1.58 | -40.57 | 0.6734 | -0.4166 | |||
| ABM / ABM Industries Incorporated | 0.03 | -7.49 | 1.54 | -7.77 | 0.6597 | -0.0283 | |||
| OXY / Occidental Petroleum Corporation | 0.04 | 4.12 | 1.52 | -11.40 | 0.6478 | -0.0553 | |||
| EMR / Emerson Electric Co. | 0.01 | -31.47 | 1.51 | -16.68 | 0.6450 | -0.0994 | |||
| HXL / Hexcel Corporation | 0.03 | 1.48 | 0.6320 | 0.6320 | |||||
| BWA / BorgWarner Inc. | 0.04 | -10.75 | 1.44 | 4.27 | 0.6164 | 0.0480 | |||
| FANG / Diamondback Energy, Inc. | 0.01 | 39.30 | 1.43 | 19.71 | 0.6100 | 0.1199 | |||
| AOS / A. O. Smith Corporation | 0.02 | 10.88 | 1.40 | 11.18 | 0.5993 | 0.0811 | |||
| UHS / Universal Health Services, Inc. | 0.01 | -19.23 | 1.38 | -22.14 | 0.5877 | -0.1382 | |||
| ALL / The Allstate Corporation | 0.01 | -50.71 | 1.35 | -52.09 | 0.5786 | -0.5827 | |||
| THG / The Hanover Insurance Group, Inc. | 0.01 | -14.02 | 1.35 | -16.01 | 0.5780 | -0.0841 | |||
| TTC / The Toro Company | 0.02 | 1.33 | 0.5688 | 0.5688 | |||||
| WABC / Westamerica Bancorporation | 0.03 | 7.29 | 1.30 | 2.60 | 0.5566 | 0.0351 | |||
| NXPI / NXP Semiconductors N.V. | 0.01 | 1.30 | 0.5542 | 0.5542 | |||||
| ML / Compagnie Générale des Établissements Michelin Société en commandite par actions | 0.03 | 39.17 | 1.27 | 35.14 | 0.5441 | 0.1955 | |||
| RJF / Raymond James Financial, Inc. | 0.01 | 1.26 | 0.5367 | 0.5367 | |||||
| SW / Sodexo S.A. | 0.02 | 107.74 | 1.25 | 41.84 | 0.5348 | 0.1874 | |||
| LR / Legrand SA | 0.01 | 53.33 | 1.23 | 93.53 | 0.5244 | 0.2636 | |||
| AKZA / Akzo Nobel N.V. | 0.02 | -40.37 | 1.23 | -32.30 | 0.5238 | -0.2204 | |||
| FFIV / F5, Inc. | 0.00 | -1.58 | 1.17 | 8.74 | 0.5002 | 0.0580 | |||
| DG / Vinci SA | 0.01 | -56.63 | 1.17 | -49.37 | 0.4984 | -0.4479 | |||
| MDLZ / Mondelez International, Inc. | 0.02 | -47.39 | 1.15 | -47.71 | 0.4928 | -0.4135 | |||
| IJF / ICON Public Limited Company | 0.01 | 0.00 | 1.14 | -16.85 | 0.4871 | -0.0765 | |||
| AHT / Ashtead Group plc | 0.02 | 1.10 | 0.4708 | 0.4708 | |||||
| GNTX / Gentex Corporation | 0.05 | 17.46 | 1.08 | 10.82 | 0.4596 | 0.0609 | |||
| COR / Cencora, Inc. | 0.00 | -69.45 | 0.92 | -67.09 | 0.3917 | -0.7519 | |||
| ESS / Essex Property Trust, Inc. | 0.00 | -32.73 | 0.83 | -37.82 | 0.3535 | -0.1933 | |||
| US8575093013 / State Street Navigator Securities Lending Government Money Market Portfolio | 0.82 | 0.82 | 0.3498 | 0.3498 | |||||
| ADC / Agree Realty Corporation | 0.01 | -38.40 | 0.82 | -41.71 | 0.3489 | -0.2266 | |||
| PHM / PulteGroup, Inc. | 0.01 | 0.70 | 0.2990 | 0.2990 | |||||
| REG / Regency Centers Corporation | 0.01 | -5.80 | 0.66 | -9.09 | 0.2822 | -0.0162 | |||
| DOV / Dover Corporation | 0.00 | -44.65 | 0.62 | -42.29 | 0.2656 | -0.1769 | |||
| FHB / First Hawaiian, Inc. | 0.02 | -52.09 | 0.61 | -51.09 | 0.2598 | -0.2509 | |||
| GTES / Gates Industrial Corporation plc | 0.03 | 4.12 | 0.61 | 30.26 | 0.2596 | 0.0679 | |||
| PPL / PPL Corporation | 0.02 | -70.56 | 0.59 | -72.38 | 0.2529 | -0.6277 | |||
| QGEN / Qiagen N.V. | 0.01 | 0.54 | 0.2304 | 0.2304 | |||||
| FTV / Fortive Corporation | 0.01 | 0.51 | 0.2179 | 0.2179 | |||||
| ADI / Analog Devices, Inc. | 0.00 | 0.50 | 0.2137 | 0.2137 | |||||
| DUK / Duke Energy Corporation | 0.00 | -69.99 | 0.47 | -67.18 | 0.2016 | -0.3697 | |||
| RSG / Republic Services, Inc. | 0.00 | -66.56 | 0.35 | -66.01 | 0.1487 | -0.2712 | |||
| RAL / Ralliant Corporation | 0.00 | 0.16 | 0.0676 | 0.0676 | |||||
| PURCHASED USD / SOLD GBP / DFE (000000000) | -0.05 | -0.0195 | -0.0195 | ||||||
| PURCHASED USD / SOLD GBP / DFE (000000000) | -0.05 | -0.0196 | -0.0196 | ||||||
| BA.C / Bank of America Corporation - Depositary Receipt (Common Stock) | -0.05 | -0.0198 | -0.0198 | ||||||
| XS1450864779 / China Government Bond - JPMorgan Chase | -0.06 | -0.0249 | -0.0249 | ||||||
| PURCHASED USD / SOLD EUR / DFE (000000000) | -0.06 | -0.0253 | -0.0253 | ||||||
| US90269A5341 / UBSW (LUV) (conv) 4.25% 2/6/2020 | -0.06 | -0.0254 | -0.0254 | ||||||
| US90269A5341 / UBSW (LUV) (conv) 4.25% 2/6/2020 | -0.06 | -0.0254 | -0.0254 |