Mga Batayang Estadistika
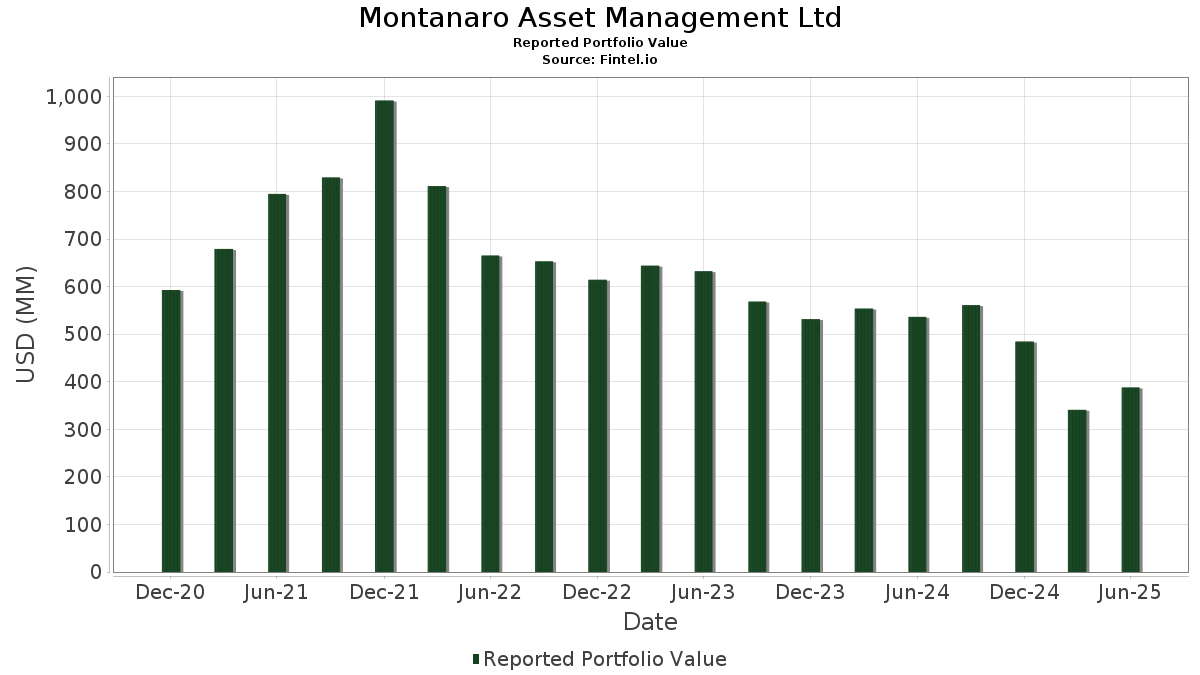
| Nilai Portofolio | $ 387,891,110 |
| Posisi Saat Ini | 39 |
Kepemilikan Terbaru, Kinerja, AUM (dari 13F, 13D)
Montanaro Asset Management Ltd telah mengungkapkan total kepemilikan 39 dalam pengajuan SEC terbaru mereka. Nilai portofolio terbaru dihitung sebesar $ 387,891,110 USD. Aset yang Dikelola (AUM) sebenarnya adalah nilai ini ditambah kas (yang tidak diungkapkan). Aset-aset utama Montanaro Asset Management Ltd adalah Bentley Systems, Incorporated (US:BSY) , Tyler Technologies, Inc. (US:TYL) , Nova Ltd. (US:NVMI) , Stride, Inc. (US:LRN) , and TransMedics Group, Inc. (US:TMDX) .
Peningkatan Tertinggi Kuartal Ini
Kami menggunakan perubahan dalam alokasi portofolio karena ini adalah metrik yang paling bermakna. Perubahan dapat disebabkan oleh perdagangan atau perubahan harga saham.
| Keamanan | Saham (MM) |
Nilai (Juta Dolar AS) |
Portfolio % | ΔPorsyento ng Portfolio |
|---|---|---|---|---|
| 0.44 | 23.58 | 6.0789 | 2.5103 | |
| 0.06 | 13.31 | 3.4302 | 2.2231 | |
| 0.06 | 8.40 | 2.1651 | 1.6990 | |
| 0.07 | 19.77 | 5.0962 | 1.6288 | |
| 0.13 | 16.88 | 4.3509 | 1.3180 | |
| 0.04 | 4.67 | 1.2044 | 0.8074 | |
| 0.03 | 9.72 | 2.5070 | 0.5511 | |
| 0.07 | 14.03 | 3.6176 | 0.4745 | |
| 0.04 | 9.59 | 2.4720 | 0.4245 | |
| 0.03 | 2.94 | 0.7589 | 0.3623 |
Penurunan Tertinggi Kuartal Ini
Kami menggunakan perubahan dalam alokasi portofolio karena ini adalah metrik yang paling bermakna. Perubahan dapat disebabkan oleh perdagangan atau perubahan harga saham.
| Keamanan | Saham (MM) |
Nilai (Juta Dolar AS) |
Portfolio % | ΔPorsyento ng Portfolio |
|---|---|---|---|---|
| 0.04 | 22.57 | 5.8193 | -1.2517 | |
| 0.30 | 16.34 | 4.2123 | -0.7779 | |
| 0.11 | 6.37 | 1.6428 | -0.7598 | |
| 0.12 | 17.42 | 4.4917 | -0.7257 | |
| 0.09 | 12.04 | 3.1036 | -0.6742 | |
| 0.12 | 9.08 | 2.3421 | -0.6112 | |
| 0.31 | 12.80 | 3.3001 | -0.6021 | |
| 0.07 | 11.84 | 3.0536 | -0.5937 | |
| 0.02 | 3.85 | 0.9914 | -0.5871 | |
| 0.29 | 15.18 | 3.9122 | -0.5009 |
Pengajuan 13F dan Dana
Formulir ini diajukan pada 2025-08-05 untuk periode pelaporan 2025-06-30. Klik ikon tautan untuk melihat riwayat transaksi selengkapnya.
Tingkatkan ke versi premium untuk membuka data premium dan ekspor ke Excel. ![]() .
.
| Keamanan | Ketik | Harga Saham Rata-rata | Saham (MM) |
ΔSaham (%) |
ΔSaham (%) |
Nilai ($MM) |
Portpolyo (%) |
ΔPortofolio (%) |
|
|---|---|---|---|---|---|---|---|---|---|
| BSY / Bentley Systems, Incorporated | 0.44 | 41.28 | 23.58 | 93.83 | 6.0789 | 2.5103 | |||
| TYL / Tyler Technologies, Inc. | 0.04 | -8.17 | 22.57 | -6.36 | 5.8193 | -1.2517 | |||
| NVMI / Nova Ltd. | 0.07 | 12.02 | 19.77 | 67.23 | 5.0962 | 1.6288 | |||
| LRN / Stride, Inc. | 0.12 | -14.65 | 17.42 | -2.04 | 4.4917 | -0.7257 | |||
| TMDX / TransMedics Group, Inc. | 0.13 | -18.05 | 16.88 | 63.23 | 4.3509 | 1.3180 | |||
| TREX / Trex Company, Inc. | 0.30 | 2.62 | 16.34 | -3.95 | 4.2123 | -0.7779 | |||
| TECH / Bio-Techne Corporation | 0.29 | 14.95 | 15.18 | 0.87 | 3.9122 | -0.5009 | |||
| ROL / Rollins, Inc. | 0.27 | 1.92 | 14.95 | 6.44 | 3.8545 | -0.2663 | |||
| HLI / Houlihan Lokey, Inc. | 0.08 | 1.89 | 14.58 | 13.52 | 3.7577 | -0.0085 | |||
| MANH / Manhattan Associates, Inc. | 0.07 | 14.76 | 14.03 | 30.97 | 3.6176 | 0.4745 | |||
| PAYC / Paycom Software, Inc. | 0.06 | 205.28 | 13.31 | 223.33 | 3.4302 | 2.2231 | |||
| BRKR / Bruker Corporation | 0.31 | -2.51 | 12.80 | -3.77 | 3.3001 | -0.6021 | |||
| AWK / American Water Works Company, Inc. | 0.09 | -0.87 | 12.04 | -6.52 | 3.1036 | -0.6742 | |||
| BCPC / Balchem Corporation | 0.07 | -0.67 | 11.84 | -4.74 | 3.0536 | -0.5937 | |||
| ANSS / ANSYS, Inc. | 0.03 | -3.82 | 11.56 | 6.71 | 2.9790 | -0.1974 | |||
| CSW / CSW Industrials, Inc. | 0.04 | 14.29 | 11.47 | 12.45 | 2.9578 | -0.0352 | |||
| VEEV / Veeva Systems Inc. | 0.04 | -11.01 | 10.31 | 10.64 | 2.6579 | -0.0756 | |||
| ALRM / Alarm.com Holdings, Inc. | 0.18 | 1.61 | 10.05 | 3.28 | 2.5901 | -0.2632 | |||
| FN / Fabrinet | 0.03 | -2.25 | 9.72 | 45.85 | 2.5070 | 0.5511 | |||
| SITM / SiTime Corporation | 0.04 | -1.44 | 9.59 | 37.38 | 2.4720 | 0.4245 | |||
| EXPO / Exponent, Inc. | 0.12 | -2.09 | 9.08 | -9.76 | 2.3421 | -0.6112 | |||
| HWKN / Hawkins, Inc. | 0.06 | 294.00 | 8.40 | 428.84 | 2.1651 | 1.6990 | |||
| FCN / FTI Consulting, Inc. | 0.05 | 11.11 | 8.07 | 9.37 | 2.0818 | -0.0841 | |||
| GGG / Graco Inc. | 0.09 | 0.00 | 7.74 | 2.95 | 1.9947 | -0.2100 | |||
| TW / Tradeweb Markets Inc. | 0.05 | 11.70 | 7.69 | 10.16 | 1.9815 | -0.0653 | |||
| MSCI / MSCI Inc. | 0.01 | 6.25 | 7.35 | 8.36 | 1.8957 | -0.0949 | |||
| BRBR / BellRing Brands, Inc. | 0.11 | 0.00 | 6.37 | -22.20 | 1.6428 | -0.7598 | |||
| ENTG / Entegris, Inc. | 0.06 | 6.87 | 4.79 | -1.48 | 1.2350 | -0.1912 | |||
| FSS / Federal Signal Corporation | 0.04 | 138.59 | 4.67 | 245.23 | 1.2044 | 0.8074 | |||
| WMS / Advanced Drainage Systems, Inc. | 0.04 | -0.53 | 4.34 | 5.16 | 1.1193 | -0.0918 | |||
| BMI / Badger Meter, Inc. | 0.02 | -14.15 | 4.31 | 10.54 | 1.1114 | -0.0326 | |||
| FORM / FormFactor, Inc. | 0.12 | 9.17 | 4.30 | 32.79 | 1.1089 | 0.1587 | |||
| STVN / Stevanato Group S.p.A. | 0.17 | 0.00 | 4.28 | 19.65 | 1.1022 | 0.0539 | |||
| MASI / Masimo Corporation | 0.02 | -29.23 | 3.85 | -28.54 | 0.9914 | -0.5871 | |||
| 0I14 / Cognex Corporation | 0.11 | -21.39 | 3.50 | -16.43 | 0.9013 | -0.3256 | |||
| TRNS / Transcat, Inc. | 0.04 | 0.00 | 3.44 | 15.45 | 0.8864 | 0.0129 | |||
| HQY / HealthEquity, Inc. | 0.03 | 83.66 | 2.94 | 117.68 | 0.7589 | 0.3623 | |||
| ERII / Energy Recovery, Inc. | 0.21 | -5.14 | 2.63 | -23.70 | 0.6773 | -0.3328 | |||
| OLED / Universal Display Corporation | 0.01 | -12.47 | 2.16 | -3.09 | 0.5573 | -0.0971 | |||
| AEHR / Aehr Test Systems, Inc. | 0.00 | -100.00 | 0.00 | 0.0000 | |||||
| PSTG / Pure Storage, Inc. | 0.00 | -100.00 | 0.00 | 0.0000 | |||||
| PCTY / Paylocity Holding Corporation | 0.00 | -100.00 | 0.00 | 0.0000 | |||||
| POWI / Power Integrations, Inc. | 0.00 | -100.00 | 0.00 | 0.0000 | |||||
| GLOB / Globant S.A. | 0.00 | -100.00 | 0.00 | 0.0000 | |||||
| AXON / Axon Enterprise, Inc. | 0.00 | -100.00 | 0.00 | 0.0000 | |||||
| ZS / Zscaler, Inc. | 0.00 | -100.00 | 0.00 | 0.0000 |