Mga Batayang Estadistika
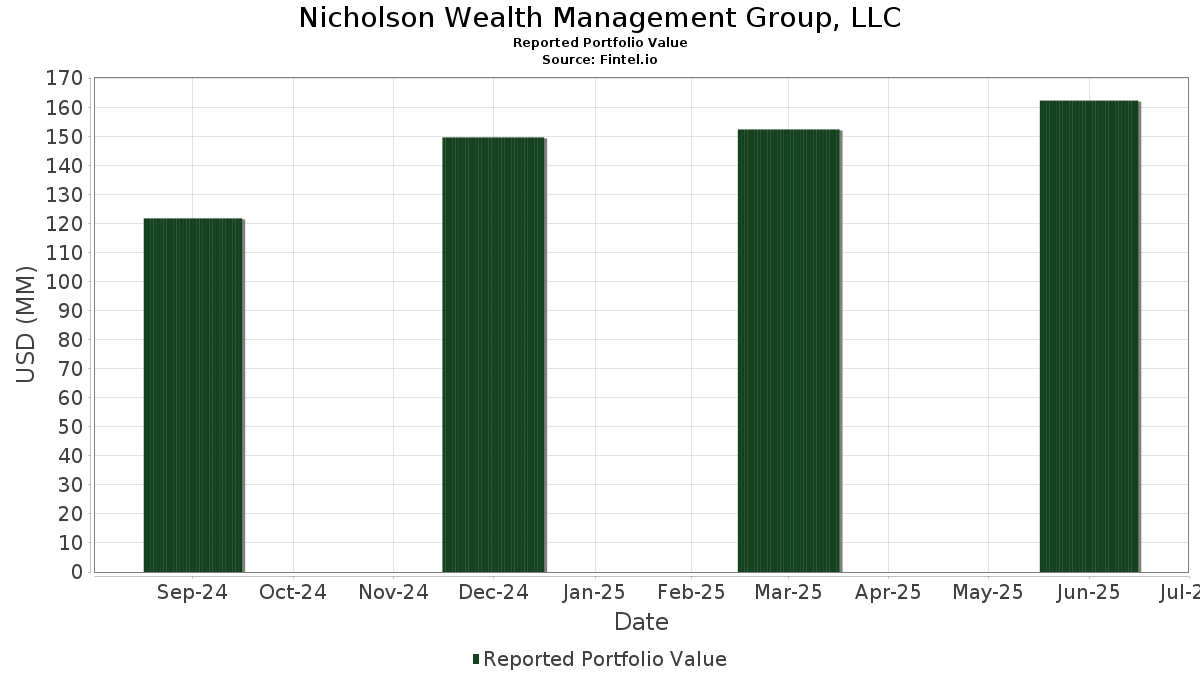
| Nilai Portofolio | $ 162,301,663 |
| Posisi Saat Ini | 107 |
Kepemilikan Terbaru, Kinerja, AUM (dari 13F, 13D)
Nicholson Wealth Management Group, LLC telah mengungkapkan total kepemilikan 107 dalam pengajuan SEC terbaru mereka. Nilai portofolio terbaru dihitung sebesar $ 162,301,663 USD. Aset yang Dikelola (AUM) sebenarnya adalah nilai ini ditambah kas (yang tidak diungkapkan). Aset-aset utama Nicholson Wealth Management Group, LLC adalah Vanguard Index Funds - Vanguard S&P 500 ETF (US:VOO) , Perspective Therapeutics, Inc. (US:CATX) , Microsoft Corporation (US:MSFT) , Vanguard Index Funds - Vanguard Total Stock Market ETF (US:VTI) , and United Bankshares, Inc. (US:UBSI) . Posisi baru Nicholson Wealth Management Group, LLC meliputi: Bank of America Corporation (US:BAC) , iShares Silver Trust (US:SLV) , Capital Group Core Balanced ETF (US:CGBL) , iShares Trust - iShares Core S&P 500 ETF (US:IVV) , and Vanguard Tax-Managed Funds - Vanguard FTSE Developed Markets ETF (US:VEA) .
Peningkatan Tertinggi Kuartal Ini
Kami menggunakan perubahan dalam alokasi portofolio karena ini adalah metrik yang paling bermakna. Perubahan dapat disebabkan oleh perdagangan atau perubahan harga saham.
| Keamanan | Saham (MM) |
Nilai (Juta Dolar AS) |
Portfolio % | ΔPorsyento ng Portfolio |
|---|---|---|---|---|
| 1.61 | 5.55 | 3.4215 | 1.1718 | |
| 0.01 | 3.72 | 2.2949 | 0.6570 | |
| 0.01 | 2.30 | 1.4163 | 0.5183 | |
| 0.01 | 1.03 | 0.6325 | 0.3931 | |
| 0.01 | 0.69 | 0.4242 | 0.2453 | |
| 0.00 | 0.63 | 0.3899 | 0.2366 | |
| 0.00 | 0.59 | 0.3646 | 0.2307 | |
| 0.00 | 1.24 | 0.7656 | 0.1959 | |
| 0.00 | 0.54 | 0.3320 | 0.1852 | |
| 0.01 | 1.70 | 1.0462 | 0.1641 |
Penurunan Tertinggi Kuartal Ini
Kami menggunakan perubahan dalam alokasi portofolio karena ini adalah metrik yang paling bermakna. Perubahan dapat disebabkan oleh perdagangan atau perubahan harga saham.
| Keamanan | Saham (MM) |
Nilai (Juta Dolar AS) |
Portfolio % | ΔPorsyento ng Portfolio |
|---|---|---|---|---|
| 0.02 | 13.33 | 8.2110 | -0.5792 | |
| 0.00 | 0.96 | 0.5903 | -0.3869 | |
| 0.02 | 2.00 | 1.2299 | -0.2652 | |
| 0.01 | 1.11 | 0.6827 | -0.2648 | |
| 0.01 | 2.35 | 1.4450 | -0.1902 | |
| 0.01 | 1.65 | 1.0181 | -0.1848 | |
| 0.01 | 1.40 | 0.8643 | -0.1782 | |
| 0.01 | 1.64 | 1.0087 | -0.1781 | |
| 0.01 | 1.75 | 1.0812 | -0.1651 | |
| 0.01 | 2.19 | 1.3508 | -0.1567 |
Pengajuan 13F dan Dana
Formulir ini diajukan pada 2025-07-29 untuk periode pelaporan 2025-06-30. Klik ikon tautan untuk melihat riwayat transaksi selengkapnya.
Tingkatkan ke versi premium untuk membuka data premium dan ekspor ke Excel. ![]() .
.
| Keamanan | Ketik | Harga Saham Rata-rata | Saham (MM) |
ΔSaham (%) |
ΔSaham (%) |
Nilai ($MM) |
Portpolyo (%) |
ΔPortofolio (%) |
|
|---|---|---|---|---|---|---|---|---|---|
| VOO / Vanguard Index Funds - Vanguard S&P 500 ETF | 0.02 | -9.98 | 13.33 | -0.50 | 8.2110 | -0.5792 | |||
| CATX / Perspective Therapeutics, Inc. | 1.61 | 0.31 | 5.55 | 62.04 | 3.4215 | 1.1718 | |||
| MSFT / Microsoft Corporation | 0.01 | 12.64 | 3.72 | 49.26 | 2.2949 | 0.6570 | |||
| VTI / Vanguard Index Funds - Vanguard Total Stock Market ETF | 0.01 | 0.60 | 3.34 | 11.26 | 2.0588 | 0.0876 | |||
| UBSI / United Bankshares, Inc. | 0.08 | 0.00 | 2.78 | 5.07 | 1.7114 | -0.0235 | |||
| COR / Cencora, Inc. | 0.01 | -2.02 | 2.36 | 5.65 | 1.4525 | -0.0120 | |||
| PG / The Procter & Gamble Company | 0.01 | 0.68 | 2.35 | -5.86 | 1.4450 | -0.1902 | |||
| AVGO / Broadcom Inc. | 0.01 | 2.04 | 2.30 | 67.98 | 1.4163 | 0.5183 | |||
| AAPL / Apple Inc. | 0.01 | 3.34 | 2.19 | -4.53 | 1.3508 | -0.1567 | |||
| V / Visa Inc. | 0.01 | 1.02 | 2.04 | 2.31 | 1.2574 | -0.0513 | |||
| PEP / PepsiCo, Inc. | 0.02 | -0.49 | 2.00 | -12.38 | 1.2299 | -0.2652 | |||
| WMT / Walmart Inc. | 0.02 | 2.48 | 1.96 | 14.15 | 1.2080 | 0.0807 | |||
| COST / Costco Wholesale Corporation | 0.00 | 4.88 | 1.96 | 9.82 | 1.2058 | 0.0358 | |||
| SO / The Southern Company | 0.02 | 0.00 | 1.94 | -0.15 | 1.1951 | -0.0796 | |||
| GD / General Dynamics Corporation | 0.01 | 0.50 | 1.92 | 7.51 | 1.1828 | 0.0112 | |||
| UNP / Union Pacific Corporation | 0.01 | 3.13 | 1.91 | 0.47 | 1.1776 | -0.0713 | |||
| LIN / Linde plc | 0.00 | 1.94 | 1.90 | 2.71 | 1.1693 | -0.0433 | |||
| CSCO / Cisco Systems, Inc. | 0.03 | 2.50 | 1.90 | 15.26 | 1.1685 | 0.0884 | |||
| MCD / McDonald's Corporation | 0.01 | 1.94 | 1.89 | -4.69 | 1.1663 | -0.1367 | |||
| HD / The Home Depot, Inc. | 0.01 | 2.76 | 1.88 | 2.79 | 1.1589 | -0.0418 | |||
| ABT / Abbott Laboratories | 0.01 | -0.74 | 1.84 | 1.77 | 1.1327 | -0.0528 | |||
| ADI / Analog Devices, Inc. | 0.01 | 3.05 | 1.82 | 21.63 | 1.1232 | 0.1395 | |||
| SYK / Stryker Corporation | 0.00 | 0.50 | 1.82 | 6.80 | 1.1230 | 0.0031 | |||
| TXN / Texas Instruments Incorporated | 0.01 | 2.98 | 1.82 | 18.95 | 1.1219 | 0.1175 | |||
| LHX / L3Harris Technologies, Inc. | 0.01 | 0.78 | 1.82 | 20.80 | 1.1207 | 0.1323 | |||
| WEC / WEC Energy Group, Inc. | 0.02 | 0.35 | 1.81 | -4.07 | 1.1174 | -0.1231 | |||
| CB / Chubb Limited | 0.01 | 3.37 | 1.81 | -0.82 | 1.1171 | -0.0828 | |||
| ATO / Atmos Energy Corporation | 0.01 | 0.18 | 1.81 | -0.11 | 1.1150 | -0.0742 | |||
| HON / Honeywell International Inc. | 0.01 | 3.79 | 1.79 | 14.14 | 1.1047 | 0.0738 | |||
| ADP / Automatic Data Processing, Inc. | 0.01 | 1.95 | 1.78 | 2.90 | 1.0937 | -0.0384 | |||
| ECL / Ecolab Inc. | 0.01 | 0.28 | 1.77 | 6.58 | 1.0885 | 0.0006 | |||
| JNJ / Johnson & Johnson | 0.01 | 0.32 | 1.75 | -7.64 | 1.0812 | -0.1651 | |||
| ICE / Intercontinental Exchange, Inc. | 0.01 | 0.15 | 1.73 | 6.54 | 1.0642 | -0.0000 | |||
| LMT / Lockheed Martin Corporation | 0.00 | 2.34 | 1.72 | 6.11 | 1.0601 | -0.0041 | |||
| XYL / Xylem Inc. | 0.01 | 0.44 | 1.70 | 8.75 | 1.0497 | 0.0217 | |||
| SPGI / S&P Global Inc. | 0.00 | 2.41 | 1.70 | 6.25 | 1.0477 | -0.0023 | |||
| EMR / Emerson Electric Co. | 0.01 | 3.88 | 1.70 | 26.26 | 1.0462 | 0.1641 | |||
| GWW / W.W. Grainger, Inc. | 0.00 | 2.38 | 1.70 | 7.81 | 1.0460 | 0.0126 | |||
| O / Realty Income Corporation | 0.03 | 0.80 | 1.66 | 0.12 | 1.0206 | -0.0654 | |||
| MDT / Medtronic plc | 0.02 | 0.50 | 1.65 | -2.54 | 1.0183 | -0.0943 | |||
| AMGN / Amgen Inc. | 0.01 | 0.59 | 1.65 | -9.83 | 1.0181 | -0.1848 | |||
| BRO / Brown & Brown, Inc. | 0.01 | 1.58 | 1.64 | -9.46 | 1.0087 | -0.1781 | |||
| PAYX / Paychex, Inc. | 0.01 | 1.24 | 1.64 | -4.55 | 1.0085 | -0.1169 | |||
| PH / Parker-Hannifin Corporation | 0.00 | 5.22 | 1.63 | 20.89 | 1.0057 | 0.1197 | |||
| CMS / CMS Energy Corporation | 0.02 | 0.68 | 1.63 | -7.13 | 1.0029 | -0.1475 | |||
| BR / Broadridge Financial Solutions, Inc. | 0.01 | 1.80 | 1.62 | 2.01 | 0.9998 | -0.0439 | |||
| SHW / The Sherwin-Williams Company | 0.00 | 8.39 | 1.61 | 6.61 | 0.9945 | 0.0006 | |||
| MDLZ / Mondelez International, Inc. | 0.02 | 1.13 | 1.61 | 0.50 | 0.9906 | -0.0591 | |||
| AWK / American Water Works Company, Inc. | 0.01 | -0.02 | 1.59 | -5.69 | 0.9810 | -0.1273 | |||
| JKHY / Jack Henry & Associates, Inc. | 0.01 | 1.09 | 1.57 | -0.25 | 0.9667 | -0.0656 | |||
| PSX / Phillips 66 | 0.01 | 9.85 | 1.56 | 6.12 | 0.9620 | -0.0035 | |||
| AFL / Aflac Incorporated | 0.01 | 2.80 | 1.55 | -2.52 | 0.9548 | -0.0883 | |||
| TSCO / Tractor Supply Company | 0.03 | 2.36 | 1.54 | -1.97 | 0.9516 | -0.0824 | |||
| FDS / FactSet Research Systems Inc. | 0.00 | 2.17 | 1.54 | 0.52 | 0.9491 | -0.0567 | |||
| NEE / NextEra Energy, Inc. | 0.02 | 2.21 | 1.54 | 0.06 | 0.9491 | -0.0609 | |||
| CHCO / City Holding Company | 0.01 | 0.00 | 1.51 | 4.21 | 0.9312 | -0.0206 | |||
| ITW / Illinois Tool Works Inc. | 0.01 | 3.42 | 1.50 | 3.16 | 0.9261 | -0.0307 | |||
| APD / Air Products and Chemicals, Inc. | 0.01 | 0.73 | 1.49 | -3.63 | 0.9162 | -0.0969 | |||
| SBUX / Starbucks Corporation | 0.02 | 1.15 | 1.48 | -5.55 | 0.9131 | -0.1162 | |||
| PLD / Prologis, Inc. | 0.01 | 9.10 | 1.47 | 2.57 | 0.9084 | -0.0348 | |||
| CL / Colgate-Palmolive Company | 0.02 | 0.17 | 1.47 | -2.79 | 0.9033 | -0.0869 | |||
| MKC / McCormick & Company, Incorporated | 0.02 | 0.96 | 1.45 | -6.99 | 0.8935 | -0.1299 | |||
| NJR / New Jersey Resources Corporation | 0.03 | 1.54 | 1.44 | -7.27 | 0.8889 | -0.1318 | |||
| LOW / Lowe's Companies, Inc. | 0.01 | 3.00 | 1.44 | -2.04 | 0.8872 | -0.0773 | |||
| CMCSA / Comcast Corporation | 0.04 | -0.32 | 1.44 | -3.56 | 0.8842 | -0.0927 | |||
| CTAS / Cintas Corporation | 0.01 | 10.97 | 1.43 | 20.35 | 0.8820 | 0.1013 | |||
| PPG / PPG Industries, Inc. | 0.01 | -1.22 | 1.42 | 2.75 | 0.8753 | -0.0320 | |||
| CHD / Church & Dwight Co., Inc. | 0.01 | 1.16 | 1.40 | -11.71 | 0.8643 | -0.1782 | |||
| ZTS / Zoetis Inc. | 0.01 | 7.72 | 1.39 | 2.05 | 0.8583 | -0.0378 | |||
| ACN / Accenture plc | 0.00 | 6.44 | 1.36 | 1.95 | 0.8398 | -0.0376 | |||
| TROW / T. Rowe Price Group, Inc. | 0.01 | 3.06 | 1.36 | 8.22 | 0.8360 | 0.0134 | |||
| CBSH / Commerce Bancshares, Inc. | 0.02 | 1.03 | 1.30 | 0.93 | 0.8016 | -0.0443 | |||
| LLY / Eli Lilly and Company | 0.00 | 51.67 | 1.24 | 43.09 | 0.7656 | 0.1959 | |||
| GLD / SPDR Gold Trust | 0.00 | 5.01 | 1.14 | 11.07 | 0.7053 | 0.0290 | |||
| BDX / Becton, Dickinson and Company | 0.01 | 2.06 | 1.11 | -23.22 | 0.6827 | -0.2648 | |||
| APH / Amphenol Corporation | 0.01 | 86.94 | 1.03 | 181.87 | 0.6325 | 0.3931 | |||
| UNH / UnitedHealth Group Incorporated | 0.00 | 8.02 | 0.96 | -35.66 | 0.5903 | -0.3869 | |||
| BFB / Brown-Forman Corp. - Class B | 0.03 | 9.66 | 0.93 | -13.05 | 0.5709 | -0.1285 | |||
| XOM / Exxon Mobil Corporation | 0.01 | -2.64 | 0.81 | -11.83 | 0.4965 | -0.1028 | |||
| OCTM / First Trust Exchange-Traded Fund VIII - FT Vest U.S. Equity Max Buffer ETF - October | 0.02 | -3.56 | 0.73 | -0.14 | 0.4517 | -0.0302 | |||
| JPM / JPMorgan Chase & Co. | 0.00 | 1.86 | 0.73 | 20.43 | 0.4505 | 0.0519 | |||
| WRB / W. R. Berkley Corporation | 0.01 | 144.71 | 0.69 | 152.94 | 0.4242 | 0.2453 | |||
| SSB / SouthState Corporation | 0.01 | 1.77 | 0.66 | 0.91 | 0.4083 | -0.0227 | |||
| KO / The Coca-Cola Company | 0.01 | 4.74 | 0.66 | 3.45 | 0.4072 | -0.0120 | |||
| MA / Mastercard Incorporated | 0.00 | 164.32 | 0.63 | 171.24 | 0.3899 | 0.2366 | |||
| NFLX / Netflix, Inc. | 0.00 | 4.89 | 0.63 | 50.84 | 0.3894 | 0.1140 | |||
| RSP / Invesco Exchange-Traded Fund Trust - Invesco S&P 500 Equal Weight ETF | 0.00 | -0.87 | 0.60 | 4.01 | 0.3683 | -0.0089 | |||
| ROP / Roper Technologies, Inc. | 0.00 | 201.73 | 0.59 | 191.13 | 0.3646 | 0.2307 | |||
| NVDA / NVIDIA Corporation | 0.00 | 65.18 | 0.54 | 141.26 | 0.3320 | 0.1852 | |||
| QQQ / Invesco QQQ Trust, Series 1 | 0.00 | 10.92 | 0.52 | 30.58 | 0.3212 | 0.0590 | |||
| IBM / International Business Machines Corporation | 0.00 | -1.29 | 0.52 | 16.97 | 0.3191 | 0.0286 | |||
| TSLA / Tesla, Inc. | 0.00 | 8.39 | 0.50 | 32.98 | 0.3061 | 0.0607 | |||
| CLX / The Clorox Company | 0.00 | -0.03 | 0.42 | -18.50 | 0.2609 | -0.0800 | |||
| CVX / Chevron Corporation | 0.00 | 4.03 | 0.41 | -10.97 | 0.2553 | -0.0501 | |||
| BUFR / First Trust Exchange-Traded Fund VIII - FT Vest Laddered Buffer ETF | 0.01 | 0.00 | 0.39 | 7.10 | 0.2419 | 0.0013 | |||
| AMZN / Amazon.com, Inc. | 0.00 | 28.94 | 0.38 | 49.01 | 0.2325 | 0.0659 | |||
| BRK.B / Berkshire Hathaway Inc. | 0.00 | 4.55 | 0.37 | -4.66 | 0.2269 | -0.0265 | |||
| SEPM / First Trust Exchange-Traded Fund VIII - FT Vest U.S. Equity Max Buffer ETF - September | 0.01 | 0.00 | 0.32 | 3.62 | 0.1944 | -0.0056 | |||
| SON / Sonoco Products Company | 0.01 | 0.00 | 0.28 | -7.57 | 0.1732 | -0.0269 | |||
| DUK / Duke Energy Corporation | 0.00 | 7.81 | 0.27 | 4.25 | 0.1666 | -0.0035 | |||
| NUE / Nucor Corporation | 0.00 | 0.00 | 0.25 | 7.76 | 0.1541 | 0.0016 | |||
| BAC / Bank of America Corporation | 0.00 | 0.23 | 0.1409 | 0.1409 | |||||
| SLV / iShares Silver Trust | 0.01 | 0.23 | 0.1387 | 0.1387 | |||||
| CGBL / Capital Group Core Balanced ETF | 0.01 | 0.21 | 0.1317 | 0.1317 | |||||
| VIG / Vanguard Specialized Funds - Vanguard Dividend Appreciation ETF | 0.00 | 0.21 | 0.1294 | 0.1294 | |||||
| IVV / iShares Trust - iShares Core S&P 500 ETF | 0.00 | 0.21 | 0.1282 | 0.1282 | |||||
| VEA / Vanguard Tax-Managed Funds - Vanguard FTSE Developed Markets ETF | 0.00 | 0.20 | 0.1233 | 0.1233 | |||||
| DVY / iShares Trust - iShares Select Dividend ETF | 0.00 | -100.00 | 0.00 | 0.0000 |