Mga Batayang Estadistika
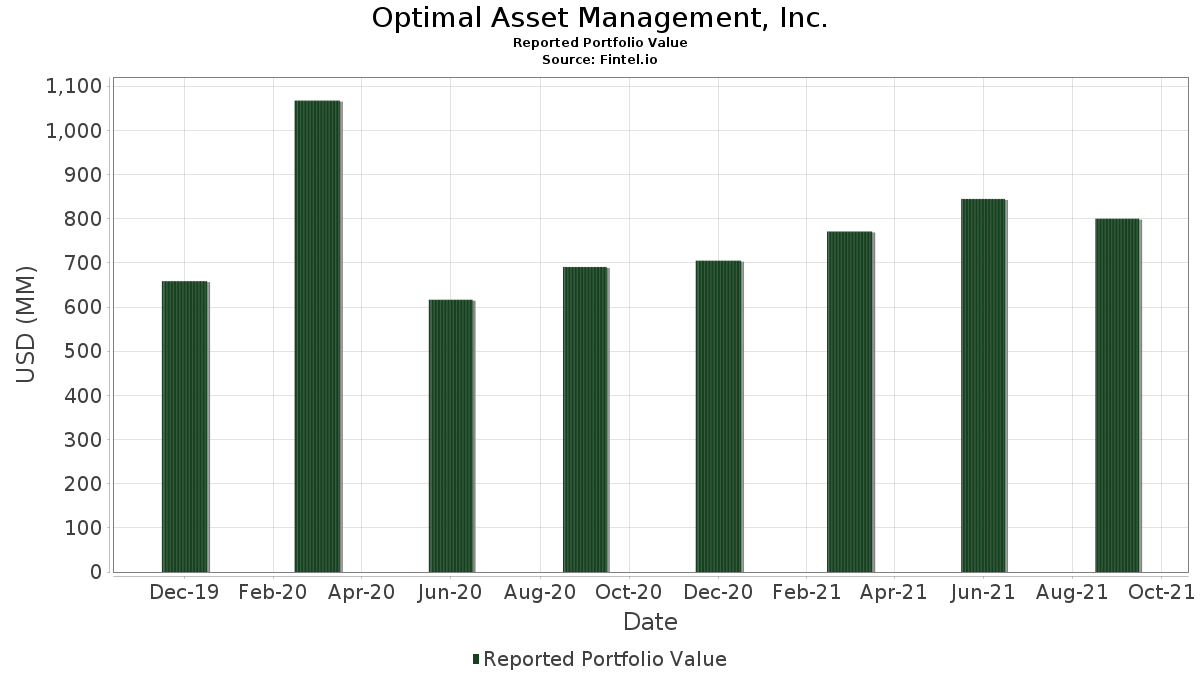
| Nilai Portofolio | $ 800,025,000 |
| Posisi Saat Ini | 347 |
Kepemilikan Terbaru, Kinerja, AUM (dari 13F, 13D)
Optimal Asset Management, Inc. telah mengungkapkan total kepemilikan 347 dalam pengajuan SEC terbaru mereka. Nilai portofolio terbaru dihitung sebesar $ 800,025,000 USD. Aset yang Dikelola (AUM) sebenarnya adalah nilai ini ditambah kas (yang tidak diungkapkan). Aset-aset utama Optimal Asset Management, Inc. adalah Walmart Inc. (US:WMT) , Fortinet, Inc. (US:FTNT) , Omnicom Group Inc. (US:OMC) , Adobe Inc. (US:ADBE) , and Broadridge Financial Solutions, Inc. (US:BR) . Posisi baru Optimal Asset Management, Inc. meliputi: Target Corporation (US:TGT) , AstraZeneca PLC - Depositary Receipt (Common Stock) (US:AZN) , Analog Devices, Inc. (US:ADI) , Organon & Co. (US:OGN) , and .
Peningkatan Tertinggi Kuartal Ini
Kami menggunakan perubahan dalam alokasi portofolio karena ini adalah metrik yang paling bermakna. Perubahan dapat disebabkan oleh perdagangan atau perubahan harga saham.
| Keamanan | Saham (MM) |
Nilai (Juta Dolar AS) |
Portfolio % | ΔPorsyento ng Portfolio |
|---|---|---|---|---|
| 0.03 | 6.85 | 0.8558 | 0.8558 | |
| 0.03 | 9.80 | 1.2247 | 0.2808 | |
| 0.04 | 2.13 | 0.2665 | 0.2665 | |
| 0.01 | 5.77 | 0.7212 | 0.2214 | |
| 0.09 | 8.15 | 1.0193 | 0.1577 | |
| 0.00 | 7.17 | 0.8961 | 0.1519 | |
| 0.01 | 3.97 | 0.4962 | 0.1303 | |
| 0.01 | 5.76 | 0.7196 | 0.1190 | |
| 0.04 | 6.31 | 0.7886 | 0.1111 | |
| 0.01 | 5.09 | 0.6357 | 0.1091 |
Penurunan Tertinggi Kuartal Ini
Kami menggunakan perubahan dalam alokasi portofolio karena ini adalah metrik yang paling bermakna. Perubahan dapat disebabkan oleh perdagangan atau perubahan harga saham.
| Keamanan | Saham (MM) |
Nilai (Juta Dolar AS) |
Portfolio % | ΔPorsyento ng Portfolio |
|---|---|---|---|---|
| 0.00 | 0.00 | -0.9579 | ||
| 0.00 | 0.00 | -0.7811 | ||
| 0.00 | 0.00 | -0.5316 | ||
| 0.00 | 0.00 | -0.4234 | ||
| 0.00 | 0.00 | -0.3633 | ||
| 0.04 | 2.21 | 0.2767 | -0.2313 | |
| 0.03 | 1.37 | 0.1712 | -0.2066 | |
| 0.02 | 1.46 | 0.1824 | -0.1600 | |
| 0.02 | 1.36 | 0.1701 | -0.1426 | |
| 0.06 | 9.23 | 1.1533 | -0.1214 |
Pengajuan 13F dan Dana
Formulir ini diajukan pada 2021-11-15 untuk periode pelaporan 2021-09-30. Klik ikon tautan untuk melihat riwayat transaksi selengkapnya.
Tingkatkan ke versi premium untuk membuka data premium dan ekspor ke Excel. ![]() .
.
| Keamanan | Ketik | Harga Saham Rata-rata | Saham (MM) |
ΔSaham (%) |
ΔSaham (%) |
Nilai ($MM) |
Portpolyo (%) |
ΔPortofolio (%) |
|
|---|---|---|---|---|---|---|---|---|---|
| WMT / Walmart Inc. | 0.08 | 0.18 | 11.15 | -0.99 | 1.3937 | 0.0607 | |||
| FTNT / Fortinet, Inc. | 0.03 | 0.22 | 9.80 | 22.87 | 1.2247 | 0.2808 | |||
| OMC / Omnicom Group Inc. | 0.13 | 0.17 | 9.77 | -9.26 | 1.2206 | -0.0533 | |||
| ADBE / Adobe Inc. | 0.02 | 0.11 | 9.74 | -1.59 | 1.2181 | 0.0459 | |||
| BR / Broadridge Financial Solutions, Inc. | 0.06 | 0.12 | 9.35 | 3.28 | 1.1682 | 0.0970 | |||
| QRVO / Qorvo, Inc. | 0.06 | 0.27 | 9.23 | -14.31 | 1.1533 | -0.1214 | |||
| TMUS / T-Mobile US, Inc. | 0.07 | 0.32 | 8.65 | -11.49 | 1.0810 | -0.0757 | |||
| CLX / The Clorox Company | 0.05 | 0.26 | 8.36 | -7.71 | 1.0443 | -0.0273 | |||
| LLY / Eli Lilly and Company | 0.04 | 0.11 | 8.30 | 0.78 | 1.0377 | 0.0625 | |||
| ORCL / Oracle Corporation | 0.09 | 0.09 | 8.15 | 12.03 | 1.0193 | 0.1577 | |||
| LBRDA / Liberty Broadband Corporation | 0.01 | 0.28 | 7.97 | 1.13 | 0.9960 | 0.0633 | |||
| AKAM / Akamai Technologies, Inc. | 0.07 | 0.32 | 7.64 | -10.01 | 0.9552 | -0.0500 | |||
| TYL / Tyler Technologies, Inc. | 0.02 | 0.26 | 7.47 | 1.65 | 0.9333 | 0.0637 | |||
| FISV / Fiserv, Inc. | 0.07 | 0.13 | 7.29 | 1.63 | 0.9115 | 0.0621 | |||
| AZO / AutoZone, Inc. | 0.00 | 0.21 | 7.17 | 14.03 | 0.8961 | 0.1519 | |||
| MSI / Motorola Solutions, Inc. | 0.03 | 0.13 | 7.00 | 7.27 | 0.8746 | 0.1024 | |||
| KEYS / Keysight Technologies, Inc. | 0.04 | 0.13 | 6.91 | 6.54 | 0.8636 | 0.0959 | |||
| TGT / Target Corporation | 0.03 | 6.85 | 0.8558 | 0.8558 | |||||
| T / AT&T Inc. | 0.25 | 0.16 | 6.78 | -6.00 | 0.8477 | -0.0064 | |||
| UPS / United Parcel Service, Inc. | 0.04 | 0.09 | 6.47 | -12.36 | 0.8092 | -0.0652 | |||
| DGX / Quest Diagnostics Incorporated | 0.04 | 0.12 | 6.31 | 10.24 | 0.7886 | 0.1111 | |||
| NVR / NVR, Inc. | 0.00 | 0.00 | 6.28 | -3.61 | 0.7850 | 0.0137 | |||
| BG / Bunge Global SA | 0.07 | 0.20 | 5.85 | 4.26 | 0.7309 | 0.0670 | |||
| PAYC / Paycom Software, Inc. | 0.01 | 0.19 | 5.77 | 36.67 | 0.7212 | 0.2214 | |||
| NOW / ServiceNow, Inc. | 0.01 | 0.19 | 5.76 | 13.46 | 0.7196 | 0.1190 | |||
| IDXX / IDEXX Laboratories, Inc. | 0.01 | 0.24 | 5.75 | -1.29 | 0.7189 | 0.0292 | |||
| NWSA / News Corporation | 0.24 | 0.29 | 5.69 | -8.43 | 0.7111 | -0.0244 | |||
| CTXS / Citrix Systems, Inc. | 0.05 | 0.12 | 5.64 | -8.33 | 0.7055 | -0.0234 | |||
| ATVI / Activision Blizzard Inc | 0.07 | 0.14 | 5.42 | -18.81 | 0.6779 | -0.1128 | |||
| MTD / Mettler-Toledo International Inc. | 0.00 | 0.23 | 5.39 | -0.35 | 0.6735 | 0.0334 | |||
| EA / Electronic Arts Inc. | 0.04 | 0.18 | 5.31 | -0.93 | 0.6641 | 0.0292 | |||
| NOC / Northrop Grumman Corporation | 0.01 | 0.06 | 5.17 | -0.84 | 0.6466 | 0.0290 | |||
| TSLA / Tesla, Inc. | 0.01 | 0.18 | 5.09 | 14.32 | 0.6357 | 0.1091 | |||
| MRK / Merck & Co., Inc. | 0.07 | 0.11 | 4.92 | -3.32 | 0.6155 | 0.0126 | |||
| QCOM / QUALCOMM Incorporated | 0.04 | 0.22 | 4.90 | -9.56 | 0.6129 | -0.0289 | |||
| GE / General Electric Company | 0.05 | -87.47 | 4.84 | -4.10 | 0.6051 | 0.0075 | |||
| MSFT / Microsoft Corporation | 0.02 | 0.00 | 4.82 | 4.08 | 0.6026 | 0.0543 | |||
| CTSH / Cognizant Technology Solutions Corporation | 0.06 | 0.27 | 4.80 | 7.43 | 0.5997 | 0.0711 | |||
| GIS / General Mills, Inc. | 0.08 | 0.23 | 4.77 | -1.59 | 0.5961 | 0.0224 | |||
| SBUX / Starbucks Corporation | 0.04 | 0.22 | 4.77 | -1.12 | 0.5959 | 0.0252 | |||
| LUMN / Lumen Technologies, Inc. | 0.38 | 0.26 | 4.76 | -8.60 | 0.5955 | -0.0215 | |||
| HSY / The Hershey Company | 0.03 | 0.15 | 4.75 | -2.71 | 0.5934 | 0.0158 | |||
| SJM / The J. M. Smucker Company | 0.04 | 0.26 | 4.72 | -7.14 | 0.5904 | -0.0117 | |||
| ORLY / O'Reilly Automotive, Inc. | 0.01 | 0.04 | 4.66 | 7.96 | 0.5829 | 0.0716 | |||
| MMM / 3M Company | 0.03 | 0.05 | 4.63 | -11.63 | 0.5794 | -0.0415 | |||
| EXPD / Expeditors International of Washington, Inc. | 0.04 | 0.04 | 4.57 | -5.88 | 0.5706 | -0.0035 | |||
| BMY / Bristol-Myers Squibb Company | 0.08 | 0.11 | 4.54 | -11.35 | 0.5674 | -0.0387 | |||
| FIS / Fidelity National Information Services, Inc. | 0.04 | 0.20 | 4.50 | -13.94 | 0.5626 | -0.0565 | |||
| WAT / Waters Corporation | 0.01 | 0.18 | 4.49 | 3.55 | 0.5607 | 0.0479 | |||
| VZ / Verizon Communications Inc. | 0.08 | 0.17 | 4.44 | -3.43 | 0.5552 | 0.0107 | |||
| CPRT / Copart, Inc. | 0.03 | 0.13 | 4.37 | 5.35 | 0.5465 | 0.0552 | |||
| SRE / Sempra | 0.03 | 0.16 | 4.35 | -4.36 | 0.5435 | 0.0053 | |||
| CHRW / C.H. Robinson Worldwide, Inc. | 0.05 | 0.25 | 4.33 | -6.89 | 0.5409 | -0.0092 | |||
| AMZN / Amazon.com, Inc. | 0.00 | 0.31 | 4.29 | -4.22 | 0.5362 | 0.0060 | |||
| BIO / Bio-Rad Laboratories, Inc. | 0.01 | 0.23 | 4.20 | 16.07 | 0.5246 | 0.0966 | |||
| KDP / Keurig Dr Pepper Inc. | 0.12 | 0.22 | 4.16 | -2.87 | 0.5196 | 0.0130 | |||
| PKI / Revvity Inc. | 0.02 | 0.04 | 4.15 | 12.27 | 0.5182 | 0.0811 | |||
| LECO / Lincoln Electric Holdings, Inc. | 0.03 | 0.06 | 4.11 | -2.14 | 0.5140 | 0.0166 | |||
| BKI / Black Knight Inc - Class A | 0.06 | 0.30 | 4.09 | -7.40 | 0.5115 | -0.0116 | |||
| NEM / Newmont Corporation | 0.07 | 0.30 | 4.07 | -14.08 | 0.5089 | -0.0520 | |||
| DHR / Danaher Corporation | 0.01 | 0.26 | 4.04 | 13.72 | 0.5046 | 0.0844 | |||
| XRAY / DENTSPLY SIRONA Inc. | 0.07 | 0.27 | 4.00 | -7.98 | 0.4999 | -0.0146 | |||
| MSCI / MSCI Inc. | 0.01 | 0.21 | 3.98 | 14.36 | 0.4976 | 0.0855 | |||
| DXCM / DexCom, Inc. | 0.01 | 0.30 | 3.97 | 28.44 | 0.4962 | 0.1303 | |||
| ADM / Archer-Daniels-Midland Company | 0.07 | 0.19 | 3.97 | -0.78 | 0.4959 | 0.0226 | |||
| VRSN / VeriSign, Inc. | 0.02 | 0.04 | 3.86 | -9.93 | 0.4820 | -0.0248 | |||
| PFE / Pfizer Inc. | 0.09 | 0.00 | 3.82 | 9.84 | 0.4772 | 0.0658 | |||
| DHI / D.R. Horton, Inc. | 0.05 | 0.34 | 3.81 | -6.77 | 0.4766 | -0.0076 | |||
| NTAP / NetApp, Inc. | 0.04 | 0.08 | 3.81 | 9.79 | 0.4766 | 0.0655 | |||
| GM / General Motors Company | 0.07 | 0.21 | 3.74 | -10.73 | 0.4671 | -0.0284 | |||
| DOCU / DocuSign, Inc. | 0.01 | 0.30 | 3.73 | -7.64 | 0.4667 | -0.0119 | |||
| REGN / Regeneron Pharmaceuticals, Inc. | 0.01 | 0.16 | 3.71 | 8.53 | 0.4642 | 0.0591 | |||
| HRL / Hormel Foods Corporation | 0.09 | 0.21 | 3.67 | -13.96 | 0.4592 | -0.0462 | |||
| AMD / Advanced Micro Devices, Inc. | 0.04 | 0.26 | 3.63 | 9.82 | 0.4542 | 0.0625 | |||
| MCD / McDonald's Corporation | 0.02 | 0.15 | 3.63 | 4.55 | 0.4540 | 0.0427 | |||
| BDX / Becton, Dickinson and Company | 0.02 | 0.16 | 3.59 | 1.47 | 0.4485 | 0.0299 | |||
| WU / The Western Union Company | 0.18 | 0.29 | 3.58 | -11.72 | 0.4471 | -0.0326 | |||
| JNJ / Johnson & Johnson | 0.02 | 0.02 | 3.58 | -1.95 | 0.4471 | 0.0153 | |||
| AAPL / Apple Inc. | 0.03 | 0.19 | 3.58 | 3.50 | 0.4469 | 0.0380 | |||
| DIS / The Walt Disney Company | 0.02 | 0.08 | 3.54 | -3.67 | 0.4430 | 0.0075 | |||
| F / Ford Motor Company | 0.25 | 0.25 | 3.50 | -4.47 | 0.4380 | 0.0038 | |||
| PGR / The Progressive Corporation | 0.04 | 0.21 | 3.47 | -7.77 | 0.4334 | -0.0116 | |||
| LNG / Cheniere Energy, Inc. | 0.04 | 0.09 | 3.46 | 12.72 | 0.4321 | 0.0690 | |||
| SCI / Service Corporation International | 0.73 | 0.02 | 3.46 | 11.78 | 0.4319 | 0.0660 | |||
| NFLX / Netflix, Inc. | 0.01 | 0.07 | 3.44 | 15.64 | 0.4299 | 0.0778 | |||
| CPB / The Campbell's Company | 0.08 | 0.37 | 3.37 | -7.94 | 0.4215 | -0.0121 | |||
| JKHY / Jack Henry & Associates, Inc. | 0.02 | 0.26 | 3.30 | 0.61 | 0.4121 | 0.0242 | |||
| K / Kellanova | 0.05 | 0.23 | 3.26 | -0.40 | 0.4079 | 0.0201 | |||
| ETR / Entergy Corporation | 0.03 | 0.06 | 3.21 | -0.31 | 0.4009 | 0.0200 | |||
| KO / The Coca-Cola Company | 0.06 | 0.00 | 3.19 | -3.01 | 0.3982 | 0.0094 | |||
| CHD / Church & Dwight Co., Inc. | 0.04 | 0.26 | 3.17 | -2.85 | 0.3966 | 0.0100 | |||
| ADSK / Autodesk, Inc. | 0.01 | 0.06 | 3.10 | -2.24 | 0.3871 | 0.0121 | |||
| TXN / Texas Instruments Incorporated | 0.02 | 0.00 | 3.00 | -0.07 | 0.3751 | 0.0196 | |||
| BAX / Baxter International Inc. | 0.04 | 0.13 | 2.94 | 0.07 | 0.3674 | 0.0197 | |||
| CVS / CVS Health Corporation | 0.03 | 0.27 | 2.94 | 1.98 | 0.3670 | 0.0262 | |||
| HWM / Howmet Aerospace Inc. | 0.09 | 0.38 | 2.93 | -9.16 | 0.3667 | -0.0156 | |||
| SIRI / Sirius XM Holdings Inc. | 0.47 | 0.32 | 2.89 | -6.44 | 0.3612 | -0.0044 | |||
| DG / Dollar General Corporation | 0.01 | 0.06 | 2.86 | -1.89 | 0.3570 | 0.0124 | |||
| KMB / Kimberly-Clark Corporation | 0.02 | 0.07 | 2.84 | -0.94 | 0.3549 | 0.0156 | |||
| FLT / Corpay, Inc. | 0.01 | 0.21 | 2.78 | 2.24 | 0.3476 | 0.0256 | |||
| HGH / Hartford Financial Services Group Inc. - FXDFR DB REDEEM 15/04/2042 USD 25 | 0.04 | 0.08 | 2.75 | 13.44 | 0.3439 | 0.0568 | |||
| BURL / Burlington Stores, Inc. | 0.01 | 0.28 | 2.75 | -11.70 | 0.3434 | -0.0249 | |||
| WDAY / Workday, Inc. | 0.01 | 0.03 | 2.73 | 4.67 | 0.3417 | 0.0325 | |||
| LEN / Lennar Corporation | 0.03 | 0.06 | 2.73 | -5.66 | 0.3417 | -0.0013 | |||
| WST / West Pharmaceutical Services, Inc. | 0.01 | 0.11 | 2.65 | 18.38 | 0.3309 | 0.0662 | |||
| USB / U.S. Bancorp | 0.04 | 0.08 | 2.61 | 4.39 | 0.3267 | 0.0303 | |||
| CINF / Cincinnati Financial Corporation | 0.02 | 0.10 | 2.61 | -1.99 | 0.3262 | 0.0110 | |||
| SO / The Southern Company | 0.04 | 0.04 | 2.57 | 2.47 | 0.3217 | 0.0244 | |||
| IPG / The Interpublic Group of Companies, Inc. | 0.07 | 0.00 | 2.54 | 12.91 | 0.3181 | 0.0513 | |||
| NI / NiSource Inc. | 0.10 | 0.11 | 2.53 | -1.02 | 0.3167 | 0.0137 | |||
| CL / Colgate-Palmolive Company | 0.03 | 0.00 | 2.52 | -7.08 | 0.3147 | -0.0061 | |||
| NWL / Newell Brands Inc. | 0.11 | 0.37 | 2.48 | -19.10 | 0.3102 | -0.0529 | |||
| ED / Consolidated Edison, Inc. | 0.03 | 0.17 | 2.48 | 1.39 | 0.3102 | 0.0205 | |||
| PKG / Packaging Corporation of America | 0.02 | 0.00 | 2.48 | 1.48 | 0.3094 | 0.0206 | |||
| DUK / Duke Energy Corporation | 0.03 | 0.12 | 2.47 | -1.00 | 0.3087 | 0.0134 | |||
| TSN / Tyson Foods, Inc. | 0.03 | 0.16 | 2.46 | 7.23 | 0.3079 | 0.0360 | |||
| V / Visa Inc. | 0.01 | 0.00 | 2.45 | -4.74 | 0.3062 | 0.0018 | |||
| HD / The Home Depot, Inc. | 0.01 | 0.11 | 2.45 | 3.03 | 0.3060 | 0.0247 | |||
| PEP / PepsiCo, Inc. | 0.02 | 0.00 | 2.41 | 1.52 | 0.3012 | 0.0202 | |||
| AGR / Avangrid, Inc. | 0.05 | 0.13 | 2.38 | -5.38 | 0.2970 | -0.0003 | |||
| XOM / Exxon Mobil Corporation | 0.04 | 0.25 | 2.37 | -6.52 | 0.2957 | -0.0039 | |||
| SGEN / Seagen Inc | 0.01 | 0.37 | 2.36 | 7.95 | 0.2955 | 0.0362 | |||
| CME / CME Group Inc. | 0.01 | 0.09 | 2.35 | -8.97 | 0.2941 | -0.0119 | |||
| HPE / Hewlett Packard Enterprise Company | 0.16 | 0.12 | 2.34 | -2.13 | 0.2930 | 0.0095 | |||
| LEA / Lear Corporation | 0.01 | 0.11 | 2.34 | -10.62 | 0.2924 | -0.0174 | |||
| CTAS / Cintas Corporation | 0.01 | 0.23 | 2.33 | -0.13 | 0.2914 | 0.0151 | |||
| MO / Altria Group, Inc. | 0.05 | 0.12 | 2.32 | -4.44 | 0.2902 | 0.0026 | |||
| TER / Teradyne, Inc. | 0.02 | 0.24 | 2.31 | -18.32 | 0.2892 | -0.0461 | |||
| BIIB / Biogen Inc. | 0.01 | 0.27 | 2.30 | -18.05 | 0.2877 | -0.0448 | |||
| AIG / American International Group, Inc. | 0.04 | 0.10 | 2.29 | 15.45 | 0.2867 | 0.0515 | |||
| RMD / ResMed Inc. | 0.01 | 0.15 | 2.28 | 7.08 | 0.2855 | 0.0330 | |||
| YUM / Yum! Brands, Inc. | 0.02 | 0.08 | 2.26 | 6.42 | 0.2820 | 0.0310 | |||
| SNAP / Snap Inc. | 0.03 | 0.51 | 2.23 | 9.00 | 0.2786 | 0.0365 | |||
| VEA / Vanguard Tax-Managed Funds - Vanguard FTSE Developed Markets ETF | 0.04 | -47.36 | 2.21 | -48.42 | 0.2767 | -0.2313 | |||
| LW / Lamb Weston Holdings, Inc. | 0.04 | 0.36 | 2.21 | -23.63 | 0.2759 | -0.0662 | |||
| WEC / WEC Energy Group, Inc. | 0.03 | 0.22 | 2.21 | -0.63 | 0.2757 | 0.0129 | |||
| ROL / Rollins, Inc. | 0.06 | 0.12 | 2.19 | 3.45 | 0.2740 | 0.0231 | |||
| NBIX / Neurocrine Biosciences, Inc. | 0.02 | 0.20 | 2.18 | -1.27 | 0.2730 | 0.0111 | |||
| AEP / American Electric Power Company, Inc. | 0.03 | 0.16 | 2.14 | -3.87 | 0.2674 | 0.0040 | |||
| AZN / AstraZeneca PLC - Depositary Receipt (Common Stock) | 0.04 | 2.13 | 0.2665 | 0.2665 | |||||
| XLNX / Xilinx, Inc. | 0.01 | 0.00 | 2.13 | 4.36 | 0.2660 | 0.0246 | |||
| LKQ / LKQ Corporation | 0.04 | 0.09 | 2.12 | 2.37 | 0.2647 | 0.0198 | |||
| ATO / Atmos Energy Corporation | 0.02 | 0.09 | 2.11 | -8.15 | 0.2634 | -0.0082 | |||
| DPZ / Domino's Pizza, Inc. | 0.00 | 0.18 | 2.08 | 2.47 | 0.2594 | 0.0197 | |||
| MDLZ / Mondelez International, Inc. | 0.04 | 0.25 | 2.07 | -6.58 | 0.2591 | -0.0036 | |||
| WM / Waste Management, Inc. | 0.01 | 0.09 | 2.05 | 6.72 | 0.2561 | 0.0288 | |||
| TJX / The TJX Companies, Inc. | 0.03 | 0.00 | 2.04 | -2.16 | 0.2550 | 0.0082 | |||
| ROP / Roper Technologies, Inc. | 0.00 | 0.02 | 2.01 | -5.10 | 0.2511 | 0.0005 | |||
| DBX / Dropbox, Inc. | 0.07 | 0.35 | 2.00 | -3.29 | 0.2502 | 0.0052 | |||
| ARW / Arrow Electronics, Inc. | 0.02 | 0.46 | 1.98 | -0.90 | 0.2472 | 0.0110 | |||
| EVRG / Evergy, Inc. | 0.03 | 0.18 | 1.97 | 3.10 | 0.2456 | 0.0200 | |||
| NUE / Nucor Corporation | 0.02 | 0.10 | 1.94 | 2.80 | 0.2430 | 0.0191 | |||
| ANET / Arista Networks Inc | 0.01 | 0.22 | 1.90 | -4.91 | 0.2374 | 0.0010 | |||
| CBSH / Commerce Bancshares, Inc. | 0.03 | 0.13 | 1.88 | -6.42 | 0.2350 | -0.0028 | |||
| TWTR / Twitter Inc | 0.03 | 0.38 | 1.78 | -11.91 | 0.2229 | -0.0167 | |||
| GILD / Gilead Sciences, Inc. | 0.03 | 0.11 | 1.78 | 1.54 | 0.2224 | 0.0150 | |||
| CBOE / Cboe Global Markets, Inc. | 0.01 | 0.03 | 1.75 | 4.04 | 0.2189 | 0.0196 | |||
| A / Agilent Technologies, Inc. | 0.01 | 0.00 | 1.75 | 6.58 | 0.2187 | 0.0244 | |||
| ALGN / Align Technology, Inc. | 0.00 | 0.15 | 1.74 | 9.10 | 0.2174 | 0.0287 | |||
| AEE / Ameren Corporation | 0.02 | 0.13 | 1.73 | 1.29 | 0.2156 | 0.0140 | |||
| FE / FirstEnergy Corp. | 0.05 | 0.11 | 1.72 | -4.14 | 0.2144 | 0.0026 | |||
| BWA / BorgWarner Inc. | 0.04 | 0.03 | 1.71 | -10.95 | 0.2134 | -0.0136 | |||
| DCUE / Dominion Energy Inc - Units - 2019 Series A | 0.02 | 0.10 | 1.69 | -0.65 | 0.2111 | 0.0099 | |||
| EL / The Estée Lauder Companies Inc. | 0.01 | 0.14 | 1.66 | -5.58 | 0.2072 | -0.0006 | |||
| UGI / UGI Corporation | 0.04 | 0.11 | 1.66 | -7.85 | 0.2070 | -0.0057 | |||
| DLB / Dolby Laboratories, Inc. | 0.02 | 0.15 | 1.65 | -10.32 | 0.2064 | -0.0116 | |||
| J / Jacobs Solutions Inc. | 0.01 | 0.28 | 1.63 | -0.37 | 0.2040 | 0.0101 | |||
| VEEV / Veeva Systems Inc. | 0.01 | 0.27 | 1.63 | -7.12 | 0.2037 | -0.0040 | |||
| MS.PRK / Morgan Stanley - Preferred Stock | 0.02 | 0.12 | 1.62 | 6.23 | 0.2026 | 0.0220 | |||
| APD / Air Products and Chemicals, Inc. | 0.01 | 0.09 | 1.62 | -10.89 | 0.2025 | -0.0127 | |||
| AMJ / JPMorgan Alerian MLP Index ETN - Corporate Bond/Note | 0.01 | 0.12 | 1.62 | 5.41 | 0.2022 | 0.0205 | |||
| FAST / Fastenal Company | 0.03 | 0.12 | 1.61 | -0.62 | 0.2011 | 0.0095 | |||
| KNX / Knight-Swift Transportation Holdings Inc. | 0.03 | 0.18 | 1.59 | 12.74 | 0.1991 | 0.0319 | |||
| NEE.PRN / NextEra Energy Capital Holdings, Inc. - Corporate Bond/Note | 0.02 | 0.11 | 1.58 | 7.25 | 0.1977 | 0.0231 | |||
| CDK / CDK Global Inc | 0.04 | 0.25 | 1.58 | -14.13 | 0.1975 | -0.0203 | |||
| MGM / MGM Resorts International | 0.04 | 0.14 | 1.56 | 1.29 | 0.1956 | 0.0127 | |||
| ICE / Intercontinental Exchange, Inc. | 0.01 | 0.14 | 1.56 | -3.11 | 0.1945 | 0.0044 | |||
| UHAL / U-Haul Holding Company | 0.00 | 0.00 | 1.55 | 9.59 | 0.1942 | 0.0264 | |||
| RL / Ralph Lauren Corporation | 0.01 | 0.15 | 1.50 | -5.60 | 0.1876 | -0.0006 | |||
| ZBRA / Zebra Technologies Corporation | 0.00 | 0.07 | 1.50 | -2.60 | 0.1875 | 0.0052 | |||
| W / Wayfair Inc. | 0.01 | 0.00 | 1.49 | -19.03 | 0.1866 | -0.0317 | |||
| WTRG / Essential Utilities, Inc. | 0.03 | 0.03 | 1.47 | 0.89 | 0.1841 | 0.0113 | |||
| SPLV / Invesco Exchange-Traded Fund Trust II - Invesco S&P 500 Low Volatility ETF | 0.02 | -49.47 | 1.46 | -49.55 | 0.1824 | -0.1600 | |||
| AIZ / Assurant, Inc. | 0.01 | 0.12 | 1.46 | 1.18 | 0.1821 | 0.0117 | |||
| MKTX / MarketAxess Holdings Inc. | 0.00 | 0.67 | 1.45 | -8.67 | 0.1816 | -0.0067 | |||
| BMRN / BioMarin Pharmaceutical Inc. | 0.02 | 0.19 | 1.45 | -7.17 | 0.1814 | -0.0037 | |||
| GS.PRJ / Goldman Sachs Group, 5.50% Dep Shares Fixd/Float Non-Cumul Preferred Stock Ser J | 0.00 | 0.11 | 1.44 | -0.28 | 0.1799 | 0.0091 | |||
| INTC / Intel Corporation | 0.03 | 0.13 | 1.44 | -4.96 | 0.1796 | 0.0006 | |||
| SCHO / Schwab Strategic Trust - Schwab Short-Term U.S. Treasury ETF | 0.03 | 7.60 | 1.42 | 7.48 | 0.1779 | 0.0211 | |||
| JNPR / Juniper Networks, Inc. | 0.05 | 0.23 | 1.42 | 0.85 | 0.1770 | 0.0108 | |||
| LMT / Lockheed Martin Corporation | 0.00 | 0.00 | 1.39 | -8.78 | 0.1741 | -0.0066 | |||
| PCAR / PACCAR Inc | 0.02 | 0.38 | 1.39 | -11.25 | 0.1735 | -0.0116 | |||
| SPHQ / Invesco Exchange-Traded Fund Trust - Invesco S&P 500 Quality ETF | 0.03 | -57.02 | 1.37 | -57.08 | 0.1712 | -0.2066 | |||
| GL / Globe Life Inc. | 0.02 | 0.35 | 1.37 | -6.23 | 0.1711 | -0.0017 | |||
| COO / The Cooper Companies, Inc. | 0.00 | 0.00 | 1.36 | 4.28 | 0.1705 | 0.0157 | |||
| SCHR / Schwab Strategic Trust - Schwab Intermediate-Term U.S. Treasury ETF | 0.02 | -48.36 | 1.36 | -48.49 | 0.1701 | -0.1426 | |||
| WFC / Wells Fargo & Company | 0.03 | 0.18 | 1.36 | 2.65 | 0.1695 | 0.0131 | |||
| PNC / The PNC Financial Services Group, Inc. | 0.01 | 0.15 | 1.34 | 2.76 | 0.1674 | 0.0131 | |||
| CMS / CMS Energy Corporation | 0.02 | 0.21 | 1.34 | 1.29 | 0.1674 | 0.0109 | |||
| PHM / PulteGroup, Inc. | 0.03 | 0.18 | 1.33 | -15.73 | 0.1667 | -0.0206 | |||
| WHR / Whirlpool Corporation | 0.01 | 0.12 | 1.33 | -6.41 | 0.1661 | -0.0020 | |||
| BAC.PRB / Bank of America Corporation - Preferred Stock | 0.03 | 0.16 | 1.31 | 3.14 | 0.1640 | 0.0134 | |||
| MAR / Marriott International, Inc. | 0.01 | 0.07 | 1.30 | 8.51 | 0.1626 | 0.0207 | |||
| TSCO / Tractor Supply Company | 0.01 | 0.00 | 1.28 | 8.87 | 0.1596 | 0.0208 | |||
| ELAN / Elanco Animal Health Incorporated | 0.04 | 0.14 | 1.27 | -7.98 | 0.1585 | -0.0046 | |||
| IEX / IDEX Corporation | 0.12 | 0.00 | 1.26 | 53.29 | 0.1571 | 0.0601 | |||
| ZION / Zions Bancorporation, National Association | 0.02 | 0.22 | 1.26 | 17.27 | 0.1570 | 0.0302 | |||
| ALB / Albemarle Corporation | 0.01 | 0.07 | 1.25 | 29.98 | 0.1566 | 0.0425 | |||
| AES / The AES Corporation | 0.05 | 0.07 | 1.24 | -12.38 | 0.1547 | -0.0125 | |||
| KLAC / KLA Corporation | 0.00 | 0.08 | 1.22 | 3.21 | 0.1526 | 0.0126 | |||
| RS / Reliance, Inc. | 0.01 | 0.25 | 1.22 | -5.36 | 0.1524 | -0.0001 | |||
| STLD / Steel Dynamics, Inc. | 0.02 | 0.07 | 1.21 | -1.79 | 0.1507 | 0.0054 | |||
| BK / The Bank of New York Mellon Corporation | 0.02 | 0.20 | 1.20 | 1.35 | 0.1496 | 0.0098 | |||
| ITW / Illinois Tool Works Inc. | 0.01 | 0.00 | 1.14 | -7.62 | 0.1425 | -0.0036 | |||
| CBRE / CBRE Group, Inc. | 0.01 | 0.09 | 1.13 | 13.65 | 0.1415 | 0.0236 | |||
| STT / State Street Corporation | 0.01 | 0.32 | 1.13 | 3.29 | 0.1412 | 0.0117 | |||
| ALL / The Allstate Corporation | 0.01 | 0.16 | 1.13 | -2.25 | 0.1410 | 0.0044 | |||
| DLTR / Dollar Tree, Inc. | 0.01 | 0.16 | 1.13 | -3.68 | 0.1409 | 0.0024 | |||
| IQV / IQVIA Holdings Inc. | 0.00 | 0.00 | 1.13 | -1.14 | 0.1407 | 0.0059 | |||
| H / Hyatt Hotels Corporation | 0.01 | 0.08 | 1.12 | -0.62 | 0.1401 | 0.0066 | |||
| AGNC / AGNC Investment Corp. | 0.07 | 0.35 | 1.12 | -6.28 | 0.1400 | -0.0015 | |||
| CDW / CDW Corporation | 0.01 | 0.25 | 1.11 | 4.51 | 0.1391 | 0.0130 | |||
| AFL / Aflac Incorporated | 0.02 | 0.16 | 1.11 | -2.72 | 0.1386 | 0.0037 | |||
| CDNS / Cadence Design Systems, Inc. | 0.01 | 0.00 | 1.08 | 10.63 | 0.1352 | 0.0195 | |||
| TRV / The Travelers Companies, Inc. | 0.01 | 0.17 | 1.07 | 1.71 | 0.1341 | 0.0092 | |||
| EOG / EOG Resources, Inc. | 0.01 | 0.11 | 1.07 | -3.70 | 0.1332 | 0.0022 | |||
| GPC / Genuine Parts Company | 0.01 | 0.00 | 1.06 | -4.08 | 0.1321 | 0.0017 | |||
| TMO / Thermo Fisher Scientific Inc. | 0.00 | 0.11 | 1.03 | 13.36 | 0.1294 | 0.0213 | |||
| LH / Labcorp Holdings Inc. | 0.00 | 0.00 | 1.02 | 1.99 | 0.1281 | 0.0092 | |||
| NKE / NIKE, Inc. | 0.01 | 0.00 | 1.01 | -5.98 | 0.1259 | -0.0009 | |||
| TMX / Terminix Global Holdings Inc | 0.05 | 0.07 | 1.01 | -8.04 | 0.1257 | -0.0038 | |||
| CSCO / Cisco Systems, Inc. | 0.02 | 0.00 | 1.00 | 2.77 | 0.1252 | 0.0098 | |||
| EIX / Edison International | 0.02 | 0.20 | 0.99 | -3.86 | 0.1244 | 0.0019 | |||
| XEL / Xcel Energy Inc. | 0.02 | 0.27 | 0.99 | -4.89 | 0.1240 | 0.0005 | |||
| HEI.A / HEICO Corporation | 0.01 | 0.12 | 0.98 | -5.29 | 0.1231 | 0.0000 | |||
| SYY / Sysco Corporation | 0.01 | 0.10 | 0.98 | 1.03 | 0.1229 | 0.0077 | |||
| SPGI / S&P Global Inc. | 0.00 | 0.00 | 0.98 | 3.59 | 0.1227 | 0.0105 | |||
| GPN / Global Payments Inc. | 0.01 | 0.13 | 0.98 | -15.87 | 0.1226 | -0.0154 | |||
| ABMD / Abiomed Inc. | 0.00 | 0.00 | 0.98 | 4.25 | 0.1226 | 0.0112 | |||
| HON / Honeywell International Inc. | 0.00 | 0.00 | 0.98 | -3.27 | 0.1220 | 0.0026 | |||
| MRO / Marathon Oil Corporation | 0.07 | 0.18 | 0.96 | 0.63 | 0.1195 | 0.0070 | |||
| CSGP / CoStar Group, Inc. | 0.01 | 0.24 | 0.95 | 4.14 | 0.1194 | 0.0108 | |||
| VOYA / Voya Financial, Inc. | 0.02 | 0.00 | 0.95 | -0.10 | 0.1190 | 0.0062 | |||
| ULTA / Ulta Beauty, Inc. | 0.00 | 0.00 | 0.95 | 4.29 | 0.1186 | 0.0109 | |||
| NLY / Annaly Capital Management, Inc. | 0.11 | 0.67 | 0.93 | -4.52 | 0.1162 | 0.0009 | |||
| CMI / Cummins Inc. | 0.00 | 0.10 | 0.92 | -7.88 | 0.1154 | -0.0032 | |||
| UNP / Union Pacific Corporation | 0.00 | 0.26 | 0.91 | -10.65 | 0.1142 | -0.0069 | |||
| MOH / Molina Healthcare, Inc. | 0.00 | 0.00 | 0.90 | 7.17 | 0.1121 | 0.0130 | |||
| NLOK / NortonLifeLock Inc | 0.04 | 0.01 | 0.89 | -6.99 | 0.1115 | -0.0020 | |||
| VTI / Vanguard Index Funds - Vanguard Total Stock Market ETF | 0.00 | -50.00 | 0.89 | -50.17 | 0.1114 | -0.1003 | |||
| SEE / Sealed Air Corporation | 0.02 | 0.05 | 0.89 | -7.48 | 0.1112 | -0.0026 | |||
| GGG / Graco Inc. | 0.01 | 0.00 | 0.88 | -7.60 | 0.1094 | -0.0027 | |||
| ODFL / Old Dominion Freight Line, Inc. | 0.00 | 0.20 | 0.87 | 12.97 | 0.1089 | 0.0176 | |||
| ADI / Analog Devices, Inc. | 0.01 | 0.85 | 0.1057 | 0.1057 | |||||
| EQH / Equitable Holdings, Inc. | 0.03 | 0.00 | 0.84 | -2.66 | 0.1054 | 0.0029 | |||
| LYV / Live Nation Entertainment, Inc. | 0.01 | 0.05 | 0.84 | 4.09 | 0.1050 | 0.0095 | |||
| COP / ConocoPhillips | 0.01 | 0.21 | 0.84 | 11.55 | 0.1050 | 0.0159 | |||
| WRK / WestRock Company | 0.02 | 0.11 | 0.84 | -6.28 | 0.1045 | -0.0011 | |||
| AJG / Arthur J. Gallagher & Co. | 0.01 | 0.00 | 0.83 | 6.12 | 0.1040 | 0.0112 | |||
| RHI / Robert Half Inc. | 0.01 | 0.24 | 0.83 | 13.00 | 0.1032 | 0.0167 | |||
| IBM / International Business Machines Corporation | 0.01 | 0.00 | 0.82 | -5.18 | 0.1030 | 0.0001 | |||
| TWLO / Twilio Inc. | 0.00 | 0.56 | 0.81 | -18.57 | 0.1009 | -0.0164 | |||
| SLB / Schlumberger Limited | 0.03 | 0.13 | 0.79 | -7.37 | 0.0990 | -0.0022 | |||
| MMC / Marsh & McLennan Companies, Inc. | 0.01 | 0.00 | 0.77 | 7.67 | 0.0965 | 0.0116 | |||
| VNQ / Vanguard Specialized Funds - Vanguard Real Estate ETF | 0.01 | -48.75 | 0.76 | -48.79 | 0.0951 | -0.0808 | |||
| LHX / L3Harris Technologies, Inc. | 0.00 | 0.12 | 0.76 | 2.02 | 0.0949 | 0.0068 | |||
| SQ / Block, Inc. | 0.00 | 0.13 | 0.76 | -1.56 | 0.0947 | 0.0036 | |||
| VRTX / Vertex Pharmaceuticals Incorporated | 0.00 | 0.27 | 0.76 | -9.80 | 0.0944 | -0.0047 | |||
| RTX / RTX Corporation | 0.01 | 0.75 | 0.0941 | 0.0941 | |||||
| CI / The Cigna Group | 0.00 | 0.24 | 0.75 | -15.40 | 0.0934 | -0.0112 | |||
| PXD / Pioneer Natural Resources Company | 0.00 | 0.40 | 0.74 | 2.90 | 0.0931 | 0.0074 | |||
| BRO / Brown & Brown, Inc. | 0.01 | 0.00 | 0.74 | 4.35 | 0.0930 | 0.0086 | |||
| ES / Eversource Energy | 0.01 | 0.34 | 0.74 | 2.21 | 0.0926 | 0.0068 | |||
| VWO / Vanguard International Equity Index Funds - Vanguard FTSE Emerging Markets ETF | 0.01 | -47.81 | 0.73 | -51.91 | 0.0914 | -0.0886 | |||
| DOW / Dow Inc. | 0.63 | 0.01 | 0.73 | -13.11 | 0.0911 | -0.0082 | |||
| PSX / Phillips 66 | 0.01 | 0.13 | 0.72 | -18.28 | 0.0905 | -0.0144 | |||
| WRB / W. R. Berkley Corporation | 0.01 | 0.18 | 0.72 | -1.50 | 0.0904 | 0.0035 | |||
| AMGN / Amgen Inc. | 0.00 | 0.21 | 0.70 | -12.56 | 0.0879 | -0.0073 | |||
| ROST / Ross Stores, Inc. | 0.01 | 0.06 | 0.70 | -12.16 | 0.0876 | -0.0068 | |||
| OKTA / Okta, Inc. | 0.00 | 0.34 | 0.69 | -2.68 | 0.0864 | 0.0023 | |||
| Y / Alleghany Corp. | 0.00 | 0.00 | 0.69 | -6.40 | 0.0859 | -0.0010 | |||
| LII / Lennox International Inc. | 0.00 | 0.04 | 0.68 | -16.07 | 0.0849 | -0.0109 | |||
| GWW / W.W. Grainger, Inc. | 0.00 | 0.00 | 0.68 | -10.21 | 0.0846 | -0.0046 | |||
| PG / The Procter & Gamble Company | 0.00 | 0.00 | 0.67 | 3.54 | 0.0841 | 0.0072 | |||
| GAFFX / Growth Fund Of America - Growth Fund of America - Class F-3 | 0.01 | 0.14 | 0.67 | 5.83 | 0.0840 | 0.0088 | |||
| RSG / Republic Services, Inc. | 0.01 | 0.00 | 0.66 | 9.09 | 0.0825 | 0.0109 | |||
| PBCT / People`s United Financial Inc | 0.04 | 0.09 | 0.61 | 2.00 | 0.0766 | 0.0055 | |||
| STOR / Store Capital Corp | 0.02 | 0.00 | 0.61 | -7.16 | 0.0761 | -0.0015 | |||
| IT / Gartner, Inc. | 0.00 | 0.00 | 0.61 | 25.57 | 0.0761 | 0.0187 | |||
| AAP / Advance Auto Parts, Inc. | 0.00 | 0.00 | 0.61 | 1.85 | 0.0759 | 0.0053 | |||
| L / Loews Corporation | 0.01 | 0.00 | 0.59 | -1.34 | 0.0735 | 0.0029 | |||
| EFX / Equifax Inc. | 0.00 | 0.09 | 0.58 | 5.99 | 0.0730 | 0.0078 | |||
| SON / Sonoco Products Company | 0.01 | 0.00 | 0.57 | -10.90 | 0.0715 | -0.0045 | |||
| TDG / TransDigm Group Incorporated | 0.00 | 0.11 | 0.57 | -3.55 | 0.0714 | 0.0013 | |||
| GLW / Corning Incorporated | 0.02 | 0.00 | 0.57 | -10.85 | 0.0709 | -0.0044 | |||
| OGE / OGE Energy Corp. | 0.02 | 0.00 | 0.56 | -2.11 | 0.0697 | 0.0023 | |||
| SPVU / Invesco Exchange-Traded Fund Trust II - Invesco S&P 500 Enhanced Value ETF | 0.01 | 0.00 | 0.54 | -2.17 | 0.0676 | 0.0022 | |||
| JEF / Jefferies Financial Group Inc. | 0.01 | 0.10 | 0.54 | 8.67 | 0.0674 | 0.0087 | |||
| NYCB / Flagstar Financial, Inc. | 0.04 | 0.09 | 0.53 | 16.89 | 0.0666 | 0.0126 | |||
| CNA / CNA Financial Corporation | 0.01 | 0.17 | 0.53 | -7.65 | 0.0664 | -0.0017 | |||
| AXP / American Express Company | 0.00 | 0.00 | 0.52 | 1.36 | 0.0654 | 0.0043 | |||
| WBA / Walgreens Boots Alliance, Inc. | 0.01 | 0.09 | 0.52 | -10.52 | 0.0649 | -0.0038 | |||
| BIL / SPDR Series Trust - SPDR Bloomberg 1-3 Month T-Bill ETF | 0.01 | -50.37 | 0.51 | -50.29 | 0.0634 | -0.0574 | |||
| IONS / Ionis Pharmaceuticals, Inc. | 0.02 | 0.00 | 0.51 | -15.92 | 0.0634 | -0.0080 | |||
| SPMO / Invesco Exchange-Traded Fund Trust II - Invesco S&P 500 Momentum ETF | 0.01 | -17.28 | 0.48 | -15.80 | 0.0606 | -0.0076 | |||
| LDOS / Leidos Holdings, Inc. | 0.00 | 0.00 | 0.48 | -4.79 | 0.0596 | 0.0003 | |||
| FDS / FactSet Research Systems Inc. | 0.00 | 0.00 | 0.47 | 17.87 | 0.0594 | 0.0117 | |||
| SPTL / SPDR Series Trust - SPDR Portfolio Long Term Treasury ETF | 0.01 | -50.00 | 0.47 | -50.00 | 0.0582 | -0.0521 | |||
| NOV / NOV Inc. | 0.04 | 0.10 | 0.46 | -14.23 | 0.0580 | -0.0060 | |||
| COST / Costco Wholesale Corporation | 0.00 | 0.00 | 0.45 | 13.57 | 0.0565 | 0.0094 | |||
| MOS / The Mosaic Company | 0.01 | 0.24 | 0.45 | 12.16 | 0.0565 | 0.0088 | |||
| MCK / McKesson Corporation | 0.00 | 1.22 | 0.45 | 5.66 | 0.0560 | 0.0058 | |||
| SPG / Simon Property Group, Inc. | 0.17 | 0.06 | 0.44 | 14.47 | 0.0554 | 0.0096 | |||
| ZTS / Zoetis Inc. | 0.00 | 0.59 | 0.43 | 4.85 | 0.0540 | 0.0052 | |||
| DVA / DaVita Inc. | 0.00 | 0.19 | 0.43 | -3.36 | 0.0540 | 0.0011 | |||
| TDY / Teledyne Technologies Incorporated | 0.00 | 0.00 | 0.43 | 2.62 | 0.0539 | 0.0042 | |||
| WAB / Westinghouse Air Brake Technologies Corporation | 0.00 | 0.00 | 0.43 | 4.67 | 0.0532 | 0.0051 | |||
| SYK / Stryker Corporation | 0.00 | 0.00 | 0.42 | 1.44 | 0.0527 | 0.0035 | |||
| RNG / RingCentral, Inc. | 0.00 | 0.37 | 0.41 | -24.82 | 0.0519 | -0.0135 | |||
| MHK / Mohawk Industries, Inc. | 0.00 | 0.18 | 0.40 | -7.57 | 0.0504 | -0.0012 | |||
| SIVB / SVB Financial Group | 0.00 | 0.33 | 0.40 | 16.81 | 0.0495 | 0.0094 | |||
| TRMB / Trimble Inc. | 0.00 | 0.47 | 0.39 | 1.04 | 0.0487 | 0.0031 | |||
| AMP / Ameriprise Financial, Inc. | 0.00 | 0.00 | 0.37 | 6.32 | 0.0462 | 0.0051 | |||
| VTV / Vanguard Index Funds - Vanguard Value ETF | 0.00 | -48.03 | 0.37 | -48.89 | 0.0460 | -0.0392 | |||
| BAH / Booz Allen Hamilton Holding Corporation | 0.00 | 0.22 | 0.36 | -6.51 | 0.0449 | -0.0006 | |||
| / ViacomCBS Inc | 0.01 | 0.13 | 0.36 | -12.65 | 0.0449 | -0.0038 | |||
| AWK / American Water Works Company, Inc. | 0.00 | 0.00 | 0.36 | 9.79 | 0.0449 | 0.0062 | |||
| MTUM / iShares Trust - iShares MSCI USA Momentum Factor ETF | 0.00 | -47.97 | 0.35 | -47.33 | 0.0444 | -0.0354 | |||
| UAA / Under Armour, Inc. | 0.02 | 0.00 | 0.35 | -4.64 | 0.0436 | 0.0003 | |||
| PNW / Pinnacle West Capital Corporation | 0.00 | 0.02 | 0.34 | -11.72 | 0.0424 | -0.0031 | |||
| DE / Deere & Company | 0.00 | 0.10 | 0.34 | -5.04 | 0.0424 | 0.0001 | |||
| BLL / Ball Corp. | 0.00 | 0.73 | 0.34 | 11.67 | 0.0419 | 0.0064 | |||
| ABBV / AbbVie Inc. | 0.00 | 0.13 | 0.33 | -4.03 | 0.0416 | 0.0005 | |||
| ALSN / Allison Transmission Holdings, Inc. | 0.01 | 0.01 | 0.33 | -11.11 | 0.0410 | -0.0027 | |||
| PII / Polaris Inc. | 0.00 | 0.00 | 0.30 | -12.72 | 0.0377 | -0.0032 | |||
| TTC / The Toro Company | 0.00 | 0.00 | 0.30 | -11.44 | 0.0377 | -0.0026 | |||
| INCY / Incyte Corporation | 0.00 | 0.15 | 0.28 | -18.10 | 0.0345 | -0.0054 | |||
| ANSS / ANSYS, Inc. | 0.00 | 0.00 | 0.27 | -1.80 | 0.0341 | 0.0012 | |||
| NSC / Norfolk Southern Corporation | 0.00 | 0.09 | 0.27 | -9.52 | 0.0332 | -0.0016 | |||
| AFG / American Financial Group, Inc. | 0.41 | 0.00 | 0.25 | 5.91 | 0.0314 | 0.0033 | |||
| BKNG / Booking Holdings Inc. | 0.00 | 0.00 | 0.24 | 8.22 | 0.0296 | 0.0037 | |||
| HII / Huntington Ingalls Industries, Inc. | 0.00 | 0.00 | 0.23 | -8.27 | 0.0291 | -0.0009 | |||
| OGN / Organon & Co. | 0.01 | 0.21 | 0.0269 | 0.0269 | |||||
| SUMO / Sumo Logic Inc | 0.01 | 0.00 | 0.18 | -21.89 | 0.0227 | -0.0048 | |||
| PPC / Pilgrim's Pride Corporation | 0.02 | 0.00 | 0.16 | -10.87 | 0.0205 | -0.0013 | |||
| GPMT / Granite Point Mortgage Trust Inc. | 0.01 | 0.00 | 0.13 | -10.81 | 0.0165 | -0.0010 | |||
| META / Meta Platforms, Inc. | 0.04 | 0.03 | 0.06 | 3.70 | 0.0070 | 0.0006 | |||
| US0153511094 / Alexion Pharmaceuticals, Inc. | 0.00 | -100.00 | 0.00 | -100.00 | -0.3633 | ||||
| CMCSA / Comcast Corporation | 0.00 | -100.00 | 0.00 | -100.00 | -0.9579 | ||||
| BNDX / Vanguard Charlotte Funds - Vanguard Total International Bond ETF | 0.00 | -100.00 | 0.00 | -100.00 | -0.0253 | ||||
| LBRDK / Liberty Broadband Corporation | 0.00 | -100.00 | 0.00 | -100.00 | -0.5316 | ||||
| 57772K101 / Maxim Integrated Products Inc. | 0.00 | -100.00 | 0.00 | -100.00 | -0.0998 | ||||
| VGIT / Vanguard Scottsdale Funds - Vanguard Intermediate-Term Treasury ETF | 0.00 | -100.00 | 0.00 | -100.00 | -0.0405 | ||||
| DISCA / Discovery Inc - Class A | 0.00 | -100.00 | 0.00 | -100.00 | -0.4234 | ||||
| GOOGL / Alphabet Inc. | 0.00 | -100.00 | 0.00 | -100.00 | -0.7811 | ||||
| CTRA / Coterra Energy Inc. | 0.00 | -100.00 | 0.00 | -100.00 | -0.1131 |