Mga Batayang Estadistika
| Profil Orang Dalam | Paralel Advisors |
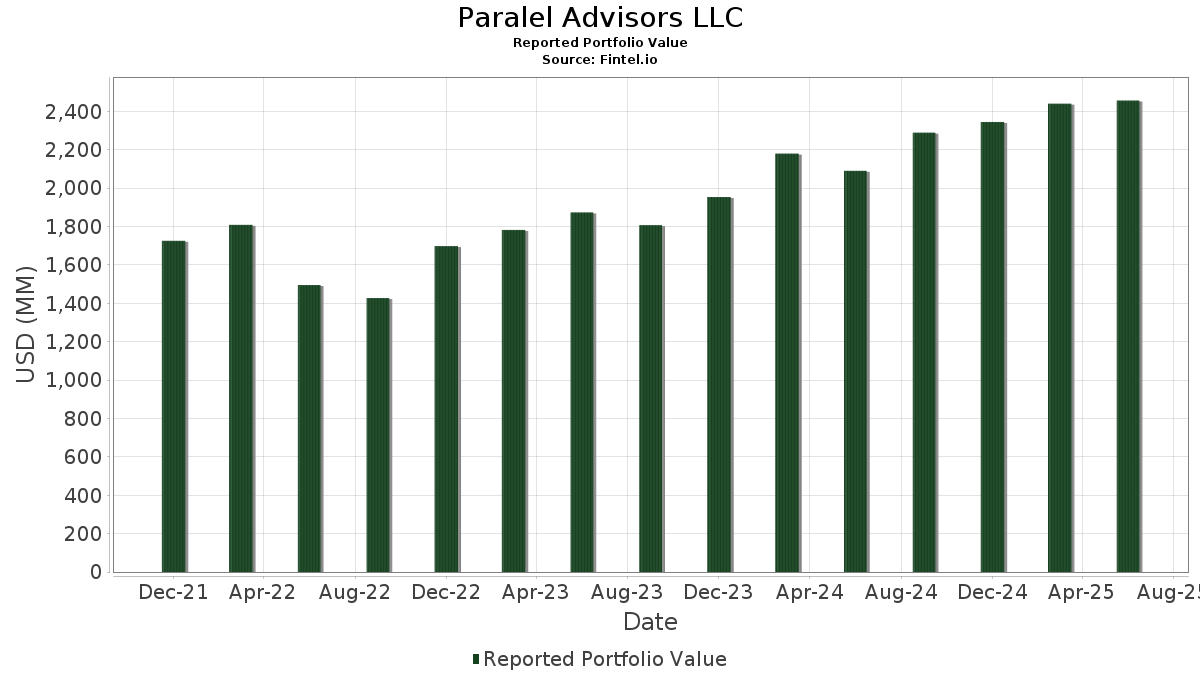
| Nilai Portofolio | $ 2,456,155,589 |
| Posisi Saat Ini | 107 |
Kepemilikan Terbaru, Kinerja, AUM (dari 13F, 13D)
Paralel Advisors LLC telah mengungkapkan total kepemilikan 107 dalam pengajuan SEC terbaru mereka. Nilai portofolio terbaru dihitung sebesar $ 2,456,155,589 USD. Aset yang Dikelola (AUM) sebenarnya adalah nilai ini ditambah kas (yang tidak diungkapkan). Aset-aset utama Paralel Advisors LLC adalah Berkshire Hathaway Inc. (US:BRK.A) , JPMorgan Chase & Co. (US:JPM) , Berkshire Hathaway Inc. (US:BRK.B) , Enterprise Products Partners L.P. - Limited Partnership (US:EPD) , and Microsoft Corporation (US:MSFT) . Posisi baru Paralel Advisors LLC meliputi: Maplebear Inc. (US:CART) , DraftKings Inc. (US:DKNG) , Forward Air Corporation (US:FWRD) , Vistra Corp. (US:VST) , and Pegasystems Inc. (US:PEGA) .
Peningkatan Tertinggi Kuartal Ini
Kami menggunakan perubahan dalam alokasi portofolio karena ini adalah metrik yang paling bermakna. Perubahan dapat disebabkan oleh perdagangan atau perubahan harga saham.
| Keamanan | Saham (MM) |
Nilai (Juta Dolar AS) |
Portfolio % | ΔPorsyento ng Portfolio |
|---|---|---|---|---|
| 1.03 | 298.03 | 11.9531 | 1.6173 | |
| 0.70 | 31.67 | 1.2893 | 1.2893 | |
| 0.60 | 25.73 | 1.0477 | 1.0477 | |
| 0.97 | 23.93 | 0.9741 | 0.9741 | |
| 0.20 | 99.48 | 3.9899 | 0.9127 | |
| 0.30 | 81.01 | 3.2489 | 0.7931 | |
| 0.75 | 68.43 | 2.7445 | 0.3382 | |
| 1.24 | 86.03 | 3.4505 | 0.3141 | |
| 0.10 | 33.49 | 1.3636 | 0.2057 | |
| 0.10 | 38.82 | 1.5570 | 0.2052 |
Penurunan Tertinggi Kuartal Ini
Kami menggunakan perubahan dalam alokasi portofolio karena ini adalah metrik yang paling bermakna. Perubahan dapat disebabkan oleh perdagangan atau perubahan harga saham.
| Keamanan | Saham (MM) |
Nilai (Juta Dolar AS) |
Portfolio % | ΔPorsyento ng Portfolio |
|---|---|---|---|---|
| 0.00 | 749.21 | 30.0486 | -3.5937 | |
| 0.27 | 26.40 | 1.0589 | -0.7223 | |
| 0.25 | 121.93 | 4.8902 | -0.5889 | |
| 3.65 | 113.19 | 4.5396 | -0.5679 | |
| 0.58 | 86.69 | 3.4767 | -0.2964 | |
| 0.68 | 46.07 | 1.8477 | -0.2950 | |
| 0.00 | 0.00 | -0.1300 | ||
| 0.05 | 2.65 | 0.1061 | -0.0802 | |
| 0.02 | 2.21 | 0.0886 | -0.0757 | |
| 0.05 | 2.33 | 0.0936 | -0.0637 |
Pengajuan 13F dan Dana
Formulir ini diajukan pada 2025-07-30 untuk periode pelaporan 2025-06-30. Klik ikon tautan untuk melihat riwayat transaksi selengkapnya.
Tingkatkan ke versi premium untuk membuka data premium dan ekspor ke Excel. ![]() .
.
| Keamanan | Ketik | Harga Saham Rata-rata | Saham (MM) |
ΔSaham (%) |
ΔSaham (%) |
Nilai ($MM) |
Portpolyo (%) |
ΔPortofolio (%) |
|
|---|---|---|---|---|---|---|---|---|---|
| BRK.A / Berkshire Hathaway Inc. | 0.00 | 0.00 | 749.21 | -8.72 | 30.0486 | -3.5937 | |||
| JPM / JPMorgan Chase & Co. | 1.03 | 0.00 | 298.03 | 18.19 | 11.9531 | 1.6173 | |||
| BRK.B / Berkshire Hathaway Inc. | 0.25 | 0.00 | 121.93 | -8.79 | 4.8902 | -0.5889 | |||
| EPD / Enterprise Products Partners L.P. - Limited Partnership | 3.65 | 0.00 | 113.19 | -9.17 | 4.5396 | -0.5679 | |||
| MSFT / Microsoft Corporation | 0.20 | 0.00 | 99.48 | 32.50 | 3.9899 | 0.9127 | |||
| YUM / Yum! Brands, Inc. | 0.58 | 0.00 | 86.69 | -5.83 | 3.4767 | -0.2964 | |||
| CSCO / Cisco Systems, Inc. | 1.24 | 0.00 | 86.03 | 12.43 | 3.4505 | 0.3141 | |||
| EVR / Evercore Inc. | 0.30 | 0.00 | 81.01 | 35.20 | 3.2489 | 0.7931 | |||
| UTF / Cohen & Steers Infrastructure Fund, Inc | 2.75 | 0.00 | 74.11 | 5.48 | 2.9724 | 0.0926 | |||
| SCHW / The Charles Schwab Corporation | 0.75 | 0.00 | 68.43 | 16.56 | 2.7445 | 0.3382 | |||
| TRV / The Travelers Companies, Inc. | 0.22 | 0.00 | 58.86 | 1.16 | 2.3964 | 0.0117 | |||
| GFL / GFL Environmental Inc. | 1.00 | 0.00 | 50.46 | 4.45 | 2.0238 | 0.0437 | |||
| EBAY / eBay Inc. | 0.65 | 0.00 | 48.40 | 9.94 | 1.9412 | 0.1367 | |||
| SWK / Stanley Black & Decker, Inc. | 0.68 | 0.00 | 46.07 | -11.87 | 1.8477 | -0.2950 | |||
| PYPL / PayPal Holdings, Inc. | 0.54 | 0.65 | 40.20 | 14.64 | 1.6124 | 0.1750 | |||
| CAT / Caterpillar Inc. | 0.10 | 0.00 | 38.82 | 17.71 | 1.5570 | 0.2052 | |||
| AXP / American Express Company | 0.10 | 0.00 | 33.49 | 18.56 | 1.3636 | 0.2057 | |||
| CART / Maplebear Inc. | 0.70 | 31.67 | 1.2893 | 1.2893 | |||||
| IBP / Installed Building Products, Inc. | 0.17 | 0.00 | 29.75 | 5.17 | 1.1933 | 0.0337 | |||
| WMT / Walmart Inc. | 0.27 | -45.45 | 26.40 | -39.25 | 1.0589 | -0.7223 | |||
| DKNG / DraftKings Inc. | 0.60 | 25.73 | 1.0477 | 1.0477 | |||||
| FWRD / Forward Air Corporation | 0.97 | 23.93 | 0.9741 | 0.9741 | |||||
| FWRG / First Watch Restaurant Group, Inc. | 0.90 | 0.00 | 14.44 | -3.66 | 0.5790 | -0.0352 | |||
| LAMR / Lamar Advertising Company | 0.04 | 0.00 | 4.51 | 6.67 | 0.1836 | 0.0103 | |||
| VST / Vistra Corp. | 0.02 | 4.41 | 0.1795 | 0.1795 | |||||
| JBL / Jabil Inc. | 0.02 | 4.54 | 4.28 | 67.59 | 0.1718 | 0.0670 | |||
| PEGA / Pegasystems Inc. | 0.08 | 4.15 | 0.1691 | 0.1691 | |||||
| FTDR / Frontdoor, Inc. | 0.07 | 4.10 | 0.1644 | 0.1644 | |||||
| EME / EMCOR Group, Inc. | 0.01 | 0.85 | 3.87 | 45.94 | 0.1551 | 0.0465 | |||
| CIEN / Ciena Corporation | 0.04 | -13.11 | 3.60 | 16.95 | 0.1442 | 0.0182 | |||
| VTR / Ventas, Inc. | 0.06 | 0.00 | 3.47 | -8.15 | 0.1414 | -0.0136 | |||
| CAH / Cardinal Health, Inc. | 0.02 | -13.75 | 3.26 | 5.17 | 0.1307 | 0.0037 | |||
| WTS / Watts Water Technologies, Inc. | 0.01 | 3.22 | 0.1310 | 0.1310 | |||||
| ADSK / Autodesk, Inc. | 0.01 | 3.16 | 0.1286 | 0.1286 | |||||
| NDAQ / Nasdaq, Inc. | 0.04 | -11.47 | 3.15 | 4.38 | 0.1263 | 0.0026 | |||
| LDOS / Leidos Holdings, Inc. | 0.02 | 3.39 | 3.12 | 20.91 | 0.1253 | 0.0194 | |||
| CCI / Crown Castle Inc. | 0.03 | 0.00 | 3.08 | -1.44 | 0.1236 | -0.0046 | |||
| QLYS / Qualys, Inc. | 0.02 | 40.98 | 3.03 | 59.98 | 0.1216 | 0.0439 | |||
| NYT / The New York Times Company | 0.05 | 3.02 | 0.1228 | 0.1228 | |||||
| ACA / Arcosa, Inc. | 0.03 | 3.00 | 0.1223 | 0.1223 | |||||
| NKE / NIKE, Inc. | 0.04 | 2.99 | 0.1217 | 0.1217 | |||||
| GEN / Gen Digital Inc. | 0.10 | 2.96 | 0.1205 | 0.1205 | |||||
| BOX / Box, Inc. | 0.09 | -2.35 | 2.96 | 8.15 | 0.1186 | 0.0065 | |||
| IRDM / Iridium Communications Inc. | 0.10 | 1.89 | 2.95 | 12.51 | 0.1183 | 0.0109 | |||
| NTNX / Nutanix, Inc. | 0.04 | 2.93 | 0.1191 | 0.1191 | |||||
| KEYS / Keysight Technologies, Inc. | 0.02 | 11.13 | 2.92 | 21.59 | 0.1190 | 0.0205 | |||
| MCK / McKesson Corporation | 0.00 | 2.91 | 0.1184 | 0.1184 | |||||
| COR / Cencora, Inc. | 0.01 | -6.98 | 2.88 | 0.31 | 0.1156 | -0.0022 | |||
| DLR / Digital Realty Trust, Inc. | 0.02 | 0.00 | 2.88 | 21.66 | 0.1154 | 0.0185 | |||
| DBX / Dropbox, Inc. | 0.10 | -3.19 | 2.86 | 3.66 | 0.1147 | 0.0016 | |||
| PLXS / Plexus Corp. | 0.02 | 2.82 | 0.1149 | 0.1149 | |||||
| ESNT / Essent Group Ltd. | 0.05 | 9.71 | 2.81 | 15.44 | 0.1127 | 0.0129 | |||
| EQIX / Equinix, Inc. | 0.00 | 0.00 | 2.78 | -2.42 | 0.1134 | -0.0036 | |||
| AIT / Applied Industrial Technologies, Inc. | 0.01 | -6.69 | 2.76 | -3.74 | 0.1105 | -0.0068 | |||
| CBOE / Cboe Global Markets, Inc. | 0.01 | -13.57 | 2.75 | -10.93 | 0.1105 | -0.0163 | |||
| NVR / NVR, Inc. | 0.00 | 17.89 | 2.73 | 20.20 | 0.1110 | 0.0180 | |||
| SIRI / Sirius XM Holdings Inc. | 0.12 | 2.72 | 0.1108 | 0.1108 | |||||
| CVS / CVS Health Corporation | 0.04 | 2.72 | 0.1107 | 0.1107 | |||||
| SAIC / Science Applications International Corporation | 0.02 | 2.68 | 0.1091 | 0.1091 | |||||
| HD / The Home Depot, Inc. | 0.01 | 11.50 | 2.67 | 11.51 | 0.1072 | 0.0090 | |||
| GDDY / GoDaddy Inc. | 0.01 | -29.89 | 2.67 | -29.92 | 0.1087 | -0.0475 | |||
| BAH / Booz Allen Hamilton Holding Corporation | 0.03 | 2.66 | 0.1083 | 0.1083 | |||||
| PII / Polaris Inc. | 0.07 | 160.21 | 2.65 | 158.48 | 0.1064 | 0.0643 | |||
| AKAM / Akamai Technologies, Inc. | 0.03 | 43.81 | 2.65 | 42.54 | 0.1062 | 0.0300 | |||
| FOXA / Fox Corporation | 0.05 | -41.21 | 2.65 | -41.79 | 0.1061 | -0.0802 | |||
| CACC / Credit Acceptance Corporation | 0.01 | 13.61 | 2.64 | 12.12 | 0.1057 | 0.0093 | |||
| FCN / FTI Consulting, Inc. | 0.02 | 2.63 | 0.1055 | 0.1055 | |||||
| TTC / The Toro Company | 0.04 | 2.59 | 0.1040 | 0.1040 | |||||
| OC / Owens Corning | 0.02 | 24.27 | 2.57 | 19.68 | 0.1032 | 0.0151 | |||
| CPAY / Corpay, Inc. | 0.01 | -5.81 | 2.54 | -10.37 | 0.1020 | -0.0143 | |||
| EEFT / Euronet Worldwide, Inc. | 0.03 | 9.49 | 2.53 | 3.85 | 0.1017 | 0.0017 | |||
| TGT / Target Corporation | 0.03 | 80.68 | 2.53 | 70.84 | 0.1028 | 0.0422 | |||
| ENS / EnerSys | 0.03 | 9.75 | 2.50 | 2.79 | 0.1004 | 0.0006 | |||
| HIW / Highwoods Properties, Inc. | 0.08 | 0.00 | 2.49 | 4.89 | 0.0998 | 0.0026 | |||
| HUM / Humana Inc. | 0.01 | 39.45 | 2.47 | 28.88 | 0.1005 | 0.0220 | |||
| TNET / TriNet Group, Inc. | 0.03 | 77.92 | 2.47 | 64.22 | 0.0989 | 0.0374 | |||
| EXP / Eagle Materials Inc. | 0.01 | 30.29 | 2.43 | 18.68 | 0.0976 | 0.0135 | |||
| NXRT / NexPoint Residential Trust, Inc. | 0.07 | 0.00 | 2.40 | -15.72 | 0.0963 | -0.0205 | |||
| AMGN / Amgen Inc. | 0.01 | 2.39 | 0.0975 | 0.0975 | |||||
| ELV / Elevance Health, Inc. | 0.01 | 26.84 | 2.39 | 13.44 | 0.0973 | 0.0109 | |||
| G / Genpact Limited | 0.05 | -30.37 | 2.33 | -39.19 | 0.0936 | -0.0637 | |||
| ACIW / ACI Worldwide, Inc. | 0.05 | 2.24 | 0.0913 | 0.0913 | |||||
| GNL / Global Net Lease, Inc. | 0.30 | 0.00 | 2.23 | -6.06 | 0.0895 | -0.0079 | |||
| COKE / Coca-Cola Consolidated, Inc. | 0.02 | 566.55 | 2.21 | -44.89 | 0.0886 | -0.0757 | |||
| CUZ / Cousins Properties Incorporated | 0.07 | 0.00 | 2.18 | 1.82 | 0.0873 | -0.0003 | |||
| SUI / Sun Communities, Inc. | 0.02 | 0.00 | 2.09 | -1.69 | 0.0838 | -0.0033 | |||
| CAG / Conagra Brands, Inc. | 0.10 | 18.21 | 2.05 | -9.30 | 0.0822 | -0.0104 | |||
| FR / First Industrial Realty Trust, Inc. | 0.04 | 0.00 | 1.99 | -10.83 | 0.0796 | -0.0116 | |||
| FTV / Fortive Corporation | 0.04 | 1.90 | 0.0775 | 0.0775 | |||||
| EXR / Extra Space Storage Inc. | 0.01 | 0.00 | 1.82 | -0.71 | 0.0730 | -0.0021 | |||
| NSP / Insperity, Inc. | 0.03 | 30.72 | 1.80 | -11.89 | 0.0722 | -0.0116 | |||
| VICI / VICI Properties Inc. | 0.05 | 0.00 | 1.69 | -0.06 | 0.0677 | -0.0015 | |||
| BRX / Brixmor Property Group Inc. | 0.06 | 0.00 | 1.67 | -1.94 | 0.0670 | -0.0028 | |||
| ARE / Alexandria Real Estate Equities, Inc. | 0.02 | 55.17 | 1.63 | 21.85 | 0.0655 | 0.0106 | |||
| UNH / UnitedHealth Group Incorporated | 0.01 | 0.45 | 1.59 | -40.19 | 0.0638 | -0.0452 | |||
| HST / Host Hotels & Resorts, Inc. | 0.10 | 0.00 | 1.59 | 8.09 | 0.0647 | 0.0044 | |||
| REXR / Rexford Industrial Realty, Inc. | 0.04 | 0.00 | 1.42 | -9.20 | 0.0571 | -0.0071 | |||
| CURB / Curbline Properties Corp. | 0.06 | 1.37 | 0.0558 | 0.0558 | |||||
| SAFE / Safehold Inc. | 0.08 | 0.00 | 1.29 | -16.90 | 0.0517 | -0.0119 | |||
| EGP / EastGroup Properties, Inc. | 0.01 | 0.00 | 1.24 | -5.15 | 0.0496 | -0.0038 | |||
| MAA / Mid-America Apartment Communities, Inc. | 0.01 | 0.00 | 1.18 | -11.64 | 0.0475 | -0.0075 | |||
| NSA / National Storage Affiliates Trust | 0.04 | 0.00 | 1.12 | -18.85 | 0.0449 | -0.0116 | |||
| DOC / Healthpeak Properties, Inc. | 0.05 | 0.00 | 0.91 | -13.38 | 0.0364 | -0.0065 | |||
| APLE / Apple Hospitality REIT, Inc. | 0.07 | 0.00 | 0.88 | -9.61 | 0.0356 | -0.0041 | |||
| INVH / Invitation Homes Inc. | 0.02 | 0.00 | 0.68 | -5.85 | 0.0271 | -0.0023 | |||
| RAL / Ralliant Corporation | 0.01 | 0.59 | 0.0240 | 0.0240 | |||||
| MTN / Vail Resorts, Inc. | 0.00 | -88.24 | 0.19 | -88.48 | 0.0076 | -0.0593 | |||
| LH / Labcorp Holdings Inc. | 0.00 | -100.00 | 0.00 | 0.0000 | |||||
| EXTR / Extreme Networks, Inc. | 0.00 | -100.00 | 0.00 | 0.0000 | |||||
| JLL / Jones Lang LaSalle Incorporated | 0.00 | -100.00 | 0.00 | 0.0000 | |||||
| TKR / The Timken Company | 0.00 | -100.00 | 0.00 | 0.0000 | |||||
| UPS / United Parcel Service, Inc. | 0.00 | -100.00 | 0.00 | 0.0000 | |||||
| TPR / Tapestry, Inc. | 0.00 | -100.00 | 0.00 | 0.0000 | |||||
| CBRE / CBRE Group, Inc. | 0.00 | -100.00 | 0.00 | 0.0000 | |||||
| AZO / AutoZone, Inc. | 0.00 | -100.00 | 0.00 | 0.0000 | |||||
| GLPI / Gaming and Leisure Properties, Inc. | 0.00 | -100.00 | 0.00 | 0.0000 | |||||
| CACI / CACI International Inc | 0.00 | -100.00 | 0.00 | 0.0000 | |||||
| ORLY / O'Reilly Automotive, Inc. | 0.00 | -100.00 | 0.00 | 0.0000 | |||||
| IPAR / Interparfums, Inc. | 0.00 | -100.00 | 0.00 | 0.0000 | |||||
| SLGN / Silgan Holdings Inc. | 0.00 | -100.00 | 0.00 | 0.0000 | |||||
| DXC / DXC Technology Company | 0.00 | -100.00 | 0.00 | 0.0000 | |||||
| IT / Gartner, Inc. | 0.00 | -100.00 | 0.00 | 0.0000 | |||||
| UTHR / United Therapeutics Corporation | 0.00 | -100.00 | 0.00 | 0.0000 | |||||
| J / Jacobs Solutions Inc. | 0.00 | -100.00 | 0.00 | 0.0000 | |||||
| NSIT / Insight Enterprises, Inc. | 0.00 | -100.00 | 0.00 | 0.0000 | |||||
| FUL / H.B. Fuller Company | 0.00 | -100.00 | 0.00 | 0.0000 | |||||
| CMCSA / Comcast Corporation | 0.00 | -100.00 | 0.00 | 0.0000 | |||||
| ASGN / ASGN Incorporated | 0.00 | -100.00 | 0.00 | 0.0000 | |||||
| FHI / Federated Hermes, Inc. | 0.00 | -100.00 | 0.00 | 0.0000 | |||||
| FWRD / Forward Air Corporation | 0.00 | -100.00 | 0.00 | 0.0000 | |||||
| HII / Huntington Ingalls Industries, Inc. | 0.00 | -100.00 | 0.00 | 0.0000 | |||||
| AMTM / Amentum Holdings, Inc. | 0.00 | -100.00 | 0.00 | 0.0000 | |||||
| AVGO / Broadcom Inc. | 0.00 | -100.00 | 0.00 | -100.00 | -0.1300 | ||||
| MAS / Masco Corporation | 0.00 | -100.00 | 0.00 | 0.0000 | |||||
| CNX / CNX Resources Corporation | 0.00 | -100.00 | 0.00 | 0.0000 |