Mga Batayang Estadistika
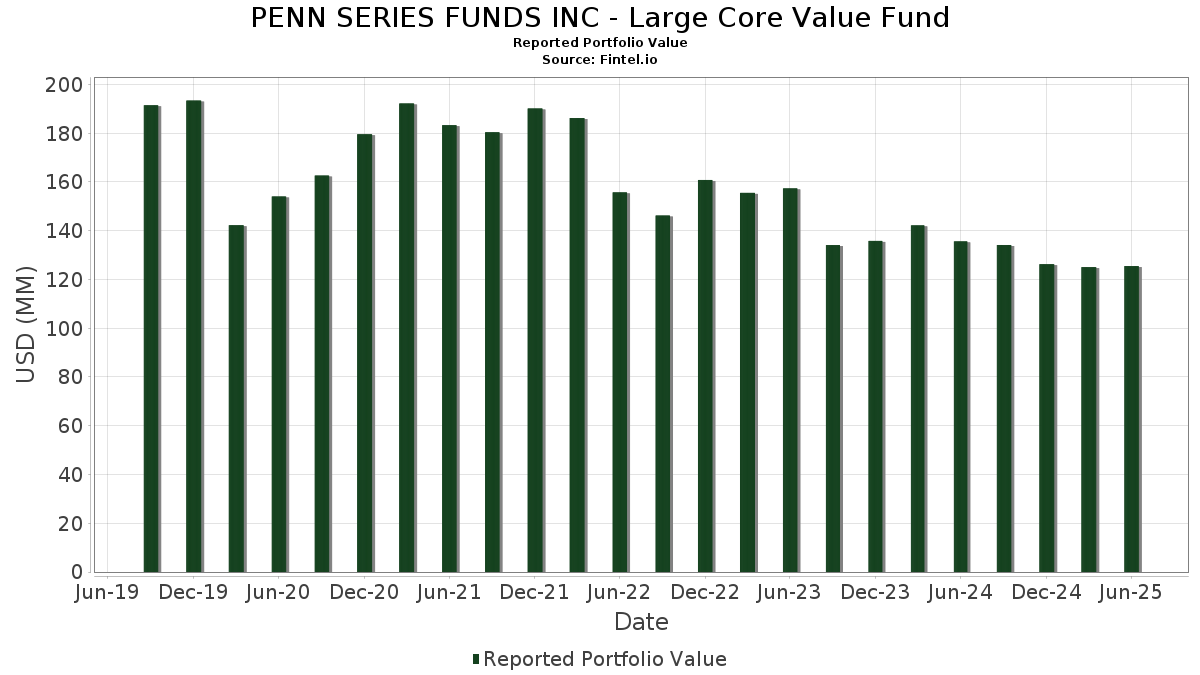
| Nilai Portofolio | $ 125,500,007 |
| Posisi Saat Ini | 69 |
Kepemilikan Terbaru, Kinerja, AUM (dari 13F, 13D)
PENN SERIES FUNDS INC - Large Core Value Fund telah mengungkapkan total kepemilikan 69 dalam pengajuan SEC terbaru mereka. Nilai portofolio terbaru dihitung sebesar $ 125,500,007 USD. Aset yang Dikelola (AUM) sebenarnya adalah nilai ini ditambah kas (yang tidak diungkapkan). Aset-aset utama PENN SERIES FUNDS INC - Large Core Value Fund adalah Bank of America Corporation (US:BAC) , Amazon.com, Inc. (US:AMZN) , Wells Fargo & Company (US:WFC) , The Charles Schwab Corporation (US:SCHW) , and American International Group, Inc. (US:AIG) . Posisi baru PENN SERIES FUNDS INC - Large Core Value Fund meliputi: Amazon.com, Inc. (US:AMZN) , Meta Platforms, Inc. (US:META) , Salesforce, Inc. (US:CRM) , Hess Corporation (US:HES) , and Pool Corporation (US:POOL) .
Peningkatan Tertinggi Kuartal Ini
Kami menggunakan perubahan dalam alokasi portofolio karena ini adalah metrik yang paling bermakna. Perubahan dapat disebabkan oleh perdagangan atau perubahan harga saham.
| Keamanan | Saham (MM) |
Nilai (Juta Dolar AS) |
Portfolio % | ΔPorsyento ng Portfolio |
|---|---|---|---|---|
| 0.02 | 4.02 | 3.2222 | 3.2222 | |
| 0.00 | 1.95 | 1.5598 | 1.5598 | |
| 0.01 | 1.84 | 1.4754 | 1.4754 | |
| 0.01 | 1.79 | 1.4335 | 1.4335 | |
| 0.00 | 1.63 | 1.3107 | 1.3107 | |
| 0.04 | 3.42 | 2.7385 | 0.8372 | |
| 0.09 | 4.38 | 3.5084 | 0.8338 | |
| 0.01 | 1.77 | 1.4175 | 0.7036 | |
| 0.02 | 2.23 | 1.7841 | 0.6993 | |
| 0.01 | 0.83 | 0.6641 | 0.6641 |
Penurunan Tertinggi Kuartal Ini
Kami menggunakan perubahan dalam alokasi portofolio karena ini adalah metrik yang paling bermakna. Perubahan dapat disebabkan oleh perdagangan atau perubahan harga saham.
| Keamanan | Saham (MM) |
Nilai (Juta Dolar AS) |
Portfolio % | ΔPorsyento ng Portfolio |
|---|---|---|---|---|
| 0.01 | 0.82 | 0.6592 | -1.5226 | |
| 0.02 | 2.66 | 2.1327 | -1.0805 | |
| 0.00 | 0.89 | 0.7127 | -0.7503 | |
| 0.02 | 1.01 | 0.8125 | -0.7325 | |
| 0.01 | 2.33 | 1.8640 | -0.7100 | |
| 0.01 | 1.59 | 1.2785 | -0.6171 | |
| 0.01 | 2.10 | 1.6850 | -0.5976 | |
| 0.01 | 1.49 | 1.1982 | -0.5521 | |
| 0.02 | 2.45 | 1.9676 | -0.5350 | |
| 0.01 | 1.71 | 1.3737 | -0.4492 |
Pengajuan 13F dan Dana
Formulir ini diajukan pada 2025-08-26 untuk periode pelaporan 2025-06-30. Klik ikon tautan untuk melihat riwayat transaksi selengkapnya.
Tingkatkan ke versi premium untuk membuka data premium dan ekspor ke Excel. ![]() .
.
| Keamanan | Ketik | Harga Saham Rata-rata | Saham (MM) |
ΔSaham (%) |
ΔSaham (%) |
Nilai ($MM) |
Portpolyo (%) |
ΔPortofolio (%) |
|
|---|---|---|---|---|---|---|---|---|---|
| BAC / Bank of America Corporation | 0.09 | 15.42 | 4.38 | 30.90 | 3.5084 | 0.8338 | |||
| AMZN / Amazon.com, Inc. | 0.02 | 4.02 | 3.2222 | 3.2222 | |||||
| WFC / Wells Fargo & Company | 0.05 | -2.34 | 3.88 | 9.00 | 3.1078 | 0.2626 | |||
| SCHW / The Charles Schwab Corporation | 0.04 | 23.31 | 3.42 | 43.73 | 2.7385 | 0.8372 | |||
| AIG / American International Group, Inc. | 0.04 | -1.26 | 3.14 | -2.78 | 2.5200 | -0.0668 | |||
| MMM / 3M Company | 0.02 | -1.33 | 3.00 | 2.29 | 2.4017 | 0.0588 | |||
| ABT / Abbott Laboratories | 0.02 | -1.27 | 2.97 | 1.23 | 2.3849 | 0.0341 | |||
| RGA / Reinsurance Group of America, Incorporated | 0.01 | -1.32 | 2.86 | -0.59 | 2.2920 | -0.0085 | |||
| NEE / NextEra Energy, Inc. | 0.04 | -1.26 | 2.78 | -3.30 | 2.2298 | -0.0712 | |||
| CSCO / Cisco Systems, Inc. | 0.04 | -21.44 | 2.68 | -11.69 | 2.1516 | -0.2791 | |||
| XOM / Exxon Mobil Corporation | 0.02 | -26.93 | 2.66 | -33.76 | 2.1327 | -1.0805 | |||
| CSX / CSX Corporation | 0.08 | 13.12 | 2.64 | 25.40 | 2.1139 | 0.4322 | |||
| DIS / The Walt Disney Company | 0.02 | -37.56 | 2.45 | -21.55 | 1.9676 | -0.5350 | |||
| EMR / Emerson Electric Co. | 0.02 | -17.19 | 2.43 | 0.71 | 1.9444 | 0.0178 | |||
| MCD / McDonald's Corporation | 0.01 | -22.75 | 2.33 | -27.73 | 1.8640 | -0.7100 | |||
| TFDXX / Blackrock Liquidity Funds - BlackRock Liquidity Funds FedFund Portfolio Institutional Class | 2.32 | -3.66 | 2.32 | -3.65 | 1.8634 | -0.0665 | |||
| LIN / Linde plc | 0.00 | -19.09 | 2.30 | -18.47 | 1.8472 | -0.4137 | |||
| BALL / Ball Corporation | 0.04 | 15.42 | 2.26 | 24.33 | 1.8114 | 0.3577 | |||
| BSX / Boston Scientific Corporation | 0.02 | 54.13 | 2.23 | 64.09 | 1.7841 | 0.6993 | |||
| MU / Micron Technology, Inc. | 0.02 | -42.03 | 2.16 | -17.77 | 1.7298 | -0.3693 | |||
| RYAN / Ryan Specialty Holdings, Inc. | 0.03 | 17.98 | 2.16 | 8.56 | 1.7281 | 0.1401 | |||
| TRV / The Travelers Companies, Inc. | 0.01 | -27.19 | 2.10 | -26.36 | 1.6850 | -0.5976 | |||
| EQT / EQT Corporation | 0.04 | 18.19 | 2.07 | 28.98 | 1.6635 | 0.3769 | |||
| TYIA / Johnson Controls International plc | 0.02 | -37.67 | 2.03 | -17.78 | 1.6307 | -0.3492 | |||
| META / Meta Platforms, Inc. | 0.00 | 1.95 | 1.5598 | 1.5598 | |||||
| USFD / US Foods Holding Corp. | 0.02 | -1.34 | 1.87 | 16.04 | 1.5031 | 0.2110 | |||
| CRM / Salesforce, Inc. | 0.01 | 1.84 | 1.4754 | 1.4754 | |||||
| LOW / Lowe's Companies, Inc. | 0.01 | 1.79 | 1.4335 | 1.4335 | |||||
| NBIX / Neurocrine Biosciences, Inc. | 0.01 | 74.33 | 1.77 | 98.21 | 1.4175 | 0.7036 | |||
| WMB / The Williams Companies, Inc. | 0.03 | -1.25 | 1.77 | 3.76 | 1.4157 | 0.0546 | |||
| SRE / Sempra | 0.02 | 22.80 | 1.75 | 30.32 | 1.3998 | 0.3286 | |||
| GOOGL / Alphabet Inc. | 0.01 | -0.75 | 1.73 | 13.11 | 1.3835 | 0.1630 | |||
| ZTS / Zoetis Inc. | 0.01 | -20.61 | 1.71 | -24.80 | 1.3737 | -0.4492 | |||
| FR / First Industrial Realty Trust, Inc. | 0.04 | -1.26 | 1.68 | -11.92 | 1.3506 | -0.1796 | |||
| CMS / CMS Energy Corporation | 0.02 | -18.06 | 1.67 | -24.41 | 1.3405 | -0.4293 | |||
| HII / Huntington Ingalls Industries, Inc. | 0.01 | -1.28 | 1.64 | 16.82 | 1.3146 | 0.1918 | |||
| GS / The Goldman Sachs Group, Inc. | 0.00 | 1.63 | 1.3107 | 1.3107 | |||||
| MTD / Mettler-Toledo International Inc. | 0.00 | -1.99 | 1.62 | -2.53 | 1.2978 | -0.0304 | |||
| RHI / Robert Half Inc. | 0.04 | 19.43 | 1.60 | -10.13 | 1.2809 | -0.1412 | |||
| CLX / The Clorox Company | 0.01 | -17.47 | 1.59 | -32.71 | 1.2785 | -0.6171 | |||
| BJ / BJ's Wholesale Club Holdings, Inc. | 0.01 | -13.50 | 1.56 | -18.24 | 1.2510 | -0.2760 | |||
| INTC / Intel Corporation | 0.07 | 11.58 | 1.55 | 10.04 | 1.2393 | 0.1157 | |||
| UPS / United Parcel Service, Inc. | 0.02 | 28.30 | 1.53 | 17.73 | 1.2306 | 0.1877 | |||
| LAD / Lithia Motors, Inc. | 0.00 | -1.28 | 1.53 | 13.64 | 1.2293 | 0.1496 | |||
| MTH / Meritage Homes Corporation | 0.02 | 27.24 | 1.51 | 20.25 | 1.2141 | 0.2064 | |||
| PUK / Prudential plc - Depositary Receipt (Common Stock) | 0.06 | 0.00 | 1.50 | 16.36 | 1.2036 | 0.1716 | |||
| ABBV / AbbVie Inc. | 0.01 | -22.90 | 1.49 | -31.72 | 1.1982 | -0.5521 | |||
| AA / Alcoa Corporation | 0.05 | 39.67 | 1.43 | 35.16 | 1.1502 | 0.3009 | |||
| STLD / Steel Dynamics, Inc. | 0.01 | -79.49 | 1.38 | -48.29 | 1.1061 | -0.2810 | |||
| GILD / Gilead Sciences, Inc. | 0.01 | -1.26 | 1.34 | -2.33 | 1.0756 | -0.0230 | |||
| HSY / The Hershey Company | 0.01 | 25.85 | 1.32 | 22.09 | 1.0597 | 0.1938 | |||
| IBKR / Interactive Brokers Group, Inc. | 0.02 | 364.38 | 1.27 | 55.41 | 1.0145 | 0.3631 | |||
| ON / ON Semiconductor Corporation | 0.02 | -26.66 | 1.24 | -5.49 | 0.9936 | -0.0559 | |||
| HAS / Hasbro, Inc. | 0.02 | -34.65 | 1.13 | -21.52 | 0.9094 | -0.2472 | |||
| NICE / NICE Ltd. - Depositary Receipt (Common Stock) | 0.01 | -1.97 | 1.08 | 7.39 | 0.8631 | 0.0613 | |||
| BKR / Baker Hughes Company | 0.03 | -1.84 | 1.02 | -14.32 | 0.8203 | -0.1355 | |||
| BMY / Bristol-Myers Squibb Company | 0.02 | -30.86 | 1.01 | -47.54 | 0.8125 | -0.7325 | |||
| GIS / General Mills, Inc. | 0.02 | 3.37 | 0.96 | -10.49 | 0.7671 | -0.0874 | |||
| WAB / Westinghouse Air Brake Technologies Corporation | 0.00 | -27.89 | 0.91 | -16.74 | 0.7298 | -0.1450 | |||
| CBOE / Cboe Global Markets, Inc. | 0.00 | -52.83 | 0.89 | -51.42 | 0.7127 | -0.7503 | |||
| TTC / The Toro Company | 0.01 | -26.87 | 0.86 | -28.95 | 0.6931 | -0.2802 | |||
| EXC / Exelon Corporation | 0.02 | -2.18 | 0.86 | -7.83 | 0.6894 | -0.0569 | |||
| IR / Ingersoll Rand Inc. | 0.01 | -3.32 | 0.84 | 0.48 | 0.6748 | 0.0047 | |||
| HES / Hess Corporation | 0.01 | 0.83 | 0.6641 | 0.6641 | |||||
| MAA / Mid-America Apartment Communities, Inc. | 0.01 | -65.87 | 0.82 | -69.86 | 0.6592 | -1.5226 | |||
| TW / Tradeweb Markets Inc. | 0.01 | -2.95 | 0.76 | -4.31 | 0.6059 | -0.0258 | |||
| MCK / McKesson Corporation | 0.00 | -33.25 | 0.74 | -27.36 | 0.5922 | -0.2207 | |||
| CUBE / CubeSmart | 0.02 | -48.58 | 0.68 | -34.99 | 0.5472 | -0.0372 | |||
| POOL / Pool Corporation | 0.00 | 0.56 | 0.4494 | 0.4494 |