Mga Batayang Estadistika
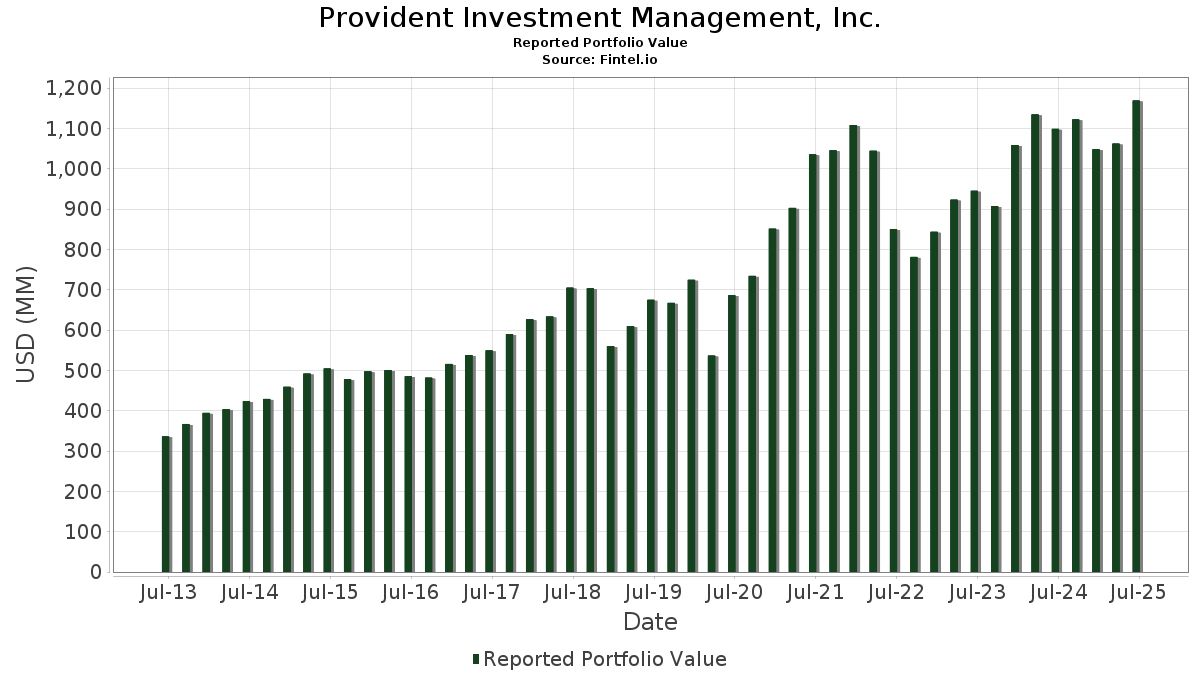
| Nilai Portofolio | $ 1,168,884,219 |
| Posisi Saat Ini | 75 |
Kepemilikan Terbaru, Kinerja, AUM (dari 13F, 13D)
Provident Investment Management, Inc. telah mengungkapkan total kepemilikan 75 dalam pengajuan SEC terbaru mereka. Nilai portofolio terbaru dihitung sebesar $ 1,168,884,219 USD. Aset yang Dikelola (AUM) sebenarnya adalah nilai ini ditambah kas (yang tidak diungkapkan). Aset-aset utama Provident Investment Management, Inc. adalah Visa Inc. (US:V) , Microsoft Corporation (US:MSFT) , Booking Holdings Inc. (US:BKNG) , Vertex Pharmaceuticals Incorporated (US:VRTX) , and Corpay, Inc. (US:CPAY) . Posisi baru Provident Investment Management, Inc. meliputi: BlackRock, Inc. (US:BLK) , Trane Technologies plc (US:TT) , Starbucks Corporation (US:SBUX) , ONEOK, Inc. (US:OKE) , and Phillips Edison & Company, Inc. (US:PECO) .
Peningkatan Tertinggi Kuartal Ini
Kami menggunakan perubahan dalam alokasi portofolio karena ini adalah metrik yang paling bermakna. Perubahan dapat disebabkan oleh perdagangan atau perubahan harga saham.
| Keamanan | Saham (MM) |
Nilai (Juta Dolar AS) |
Portfolio % | ΔPorsyento ng Portfolio |
|---|---|---|---|---|
| 0.06 | 59.93 | 5.1272 | 5.1272 | |
| 0.28 | 38.68 | 3.3090 | 3.1101 | |
| 0.06 | 28.20 | 2.4125 | 2.4125 | |
| 0.07 | 50.62 | 4.3306 | 2.0768 | |
| 0.17 | 83.70 | 7.1605 | 1.2117 | |
| 0.10 | 46.23 | 3.9546 | 0.9586 | |
| 0.01 | 74.81 | 6.4001 | 0.7094 | |
| 0.36 | 33.54 | 2.8693 | 0.5763 | |
| 0.23 | 49.83 | 4.2629 | 0.5397 | |
| 0.16 | 30.73 | 2.6291 | 0.3400 |
Penurunan Tertinggi Kuartal Ini
Kami menggunakan perubahan dalam alokasi portofolio karena ini adalah metrik yang paling bermakna. Perubahan dapat disebabkan oleh perdagangan atau perubahan harga saham.
| Keamanan | Saham (MM) |
Nilai (Juta Dolar AS) |
Portfolio % | ΔPorsyento ng Portfolio |
|---|---|---|---|---|
| 0.00 | 0.93 | 0.0799 | -4.2370 | |
| 0.89 | 37.24 | 3.1862 | -2.9081 | |
| 0.00 | 0.37 | 0.0315 | -2.4532 | |
| 0.25 | 43.96 | 3.7609 | -2.1667 | |
| 1.29 | 63.15 | 5.4027 | -1.5332 | |
| 0.16 | 70.66 | 6.0448 | -1.0913 | |
| 0.21 | 69.10 | 5.9120 | -0.9826 | |
| 0.26 | 93.80 | 8.0246 | -0.7720 | |
| 0.38 | 34.58 | 2.9586 | -0.5277 | |
| 0.31 | 56.75 | 4.8548 | -0.2145 |
Pengajuan 13F dan Dana
Formulir ini diajukan pada 2025-08-26 untuk periode pelaporan 2025-06-30. Klik ikon tautan untuk melihat riwayat transaksi selengkapnya.
Tingkatkan ke versi premium untuk membuka data premium dan ekspor ke Excel. ![]() .
.
| Keamanan | Ketik | Harga Saham Rata-rata | Saham (MM) |
ΔSaham (%) |
ΔSaham (%) |
Nilai ($MM) |
Portpolyo (%) |
ΔPortofolio (%) |
|
|---|---|---|---|---|---|---|---|---|---|
| V / Visa Inc. | 0.26 | -0.90 | 93.80 | 0.40 | 8.0246 | -0.7720 | |||
| MSFT / Microsoft Corporation | 0.17 | -0.02 | 83.70 | 32.48 | 7.1605 | 1.2117 | |||
| BKNG / Booking Holdings Inc. | 0.01 | -1.50 | 74.81 | 23.78 | 6.4001 | 0.7094 | |||
| VRTX / Vertex Pharmaceuticals Incorporated | 0.16 | 1.52 | 70.66 | -6.77 | 6.0448 | -1.0913 | |||
| CPAY / Corpay, Inc. | 0.21 | -0.82 | 69.10 | -5.63 | 5.9120 | -0.9826 | |||
| CPRT / Copart, Inc. | 1.29 | -1.13 | 63.15 | -14.27 | 5.4027 | -1.5332 | |||
| BLK / BlackRock, Inc. | 0.06 | 59.93 | 5.1272 | 5.1272 | |||||
| ICE / Intercontinental Exchange, Inc. | 0.31 | -0.90 | 56.75 | 5.40 | 4.8548 | -0.2145 | |||
| SCHW / The Charles Schwab Corporation | 0.62 | -0.44 | 56.65 | 16.04 | 4.8462 | 0.2499 | |||
| META / Meta Platforms, Inc. | 0.07 | 65.14 | 50.62 | 111.49 | 4.3306 | 2.0768 | |||
| AMZN / Amazon.com, Inc. | 0.23 | 9.28 | 49.83 | 26.01 | 4.2629 | 0.5397 | |||
| FI / Fiserv, Inc. | 0.28 | 35.37 | 48.98 | 5.69 | 4.1906 | -0.1732 | |||
| CACI / CACI International Inc | 0.10 | 11.82 | 46.23 | 45.27 | 3.9546 | 0.9586 | |||
| GOOG / Alphabet Inc. | 0.25 | -38.50 | 43.96 | -30.17 | 3.7609 | -2.1667 | |||
| TTWO / Take-Two Interactive Software, Inc. | 0.18 | 0.15 | 42.59 | 17.35 | 3.6436 | 0.2265 | |||
| ABT / Abbott Laboratories | 0.28 | 1,686.29 | 38.68 | 1,732.21 | 3.3090 | 3.1101 | |||
| FAST / Fastenal Company | 0.89 | 6.24 | 37.24 | -42.46 | 3.1862 | -2.9081 | |||
| ORLY / O'Reilly Automotive, Inc. | 0.38 | 1,384.56 | 34.58 | -6.60 | 2.9586 | -0.5277 | |||
| UBER / Uber Technologies, Inc. | 0.36 | 7.55 | 33.54 | 37.72 | 2.8693 | 0.5763 | |||
| ALGN / Align Technology, Inc. | 0.16 | 6.06 | 30.73 | 26.40 | 2.6291 | 0.3400 | |||
| TT / Trane Technologies plc | 0.06 | 28.20 | 2.4125 | 2.4125 | |||||
| SPGI / S&P Global Inc. | 0.01 | -4.22 | 5.75 | -0.59 | 0.4920 | -0.0527 | |||
| MCD / McDonald's Corporation | 0.01 | -8.92 | 3.18 | -14.82 | 0.2725 | -0.0795 | |||
| ROP / Roper Technologies, Inc. | 0.01 | 0.00 | 3.12 | -3.86 | 0.2667 | -0.0386 | |||
| QUAL / iShares Trust - iShares MSCI USA Quality Factor ETF | 0.01 | 17.20 | 2.61 | 25.37 | 0.2232 | 0.0273 | |||
| PYPL / PayPal Holdings, Inc. | 0.02 | -0.46 | 1.61 | 13.34 | 0.1375 | 0.0040 | |||
| GILD / Gilead Sciences, Inc. | 0.01 | 0.00 | 1.55 | -1.02 | 0.1328 | -0.0149 | |||
| XOM / Exxon Mobil Corporation | 0.01 | -3.94 | 1.55 | -12.91 | 0.1327 | -0.0350 | |||
| ESS / Essex Property Trust, Inc. | 0.00 | -6.41 | 1.41 | -13.48 | 0.1203 | -0.0327 | |||
| NTRS / Northern Trust Corporation | 0.01 | 0.00 | 1.38 | 28.50 | 0.1177 | 0.0169 | |||
| GOOGL / Alphabet Inc. | 0.01 | -11.68 | 1.37 | 0.66 | 0.1171 | -0.0109 | |||
| AMGN / Amgen Inc. | 0.00 | 1.29 | 0.1100 | 0.1100 | |||||
| NVDA / NVIDIA Corporation | 0.01 | 9.02 | 1.25 | 58.91 | 0.1069 | 0.0329 | |||
| KO / The Coca-Cola Company | 0.02 | 0.00 | 1.20 | -1.23 | 0.1029 | -0.0117 | |||
| DG / Dollar General Corporation | 0.01 | -6.94 | 1.18 | 21.07 | 0.1008 | 0.0092 | |||
| ESNT / Essent Group Ltd. | 0.02 | 2.69 | 1.14 | 8.07 | 0.0974 | -0.0018 | |||
| NOC / Northrop Grumman Corporation | 0.00 | 11.21 | 1.11 | 8.61 | 0.0950 | -0.0013 | |||
| ABBV / AbbVie Inc. | 0.01 | 19.05 | 1.10 | 5.56 | 0.0943 | -0.0041 | |||
| LKQ / LKQ Corporation | 0.03 | 18.28 | 1.02 | 2.92 | 0.0876 | -0.0061 | |||
| TFC / Truist Financial Corporation | 0.02 | 0.90 | 1.01 | 5.42 | 0.0865 | -0.0038 | |||
| NXST / Nexstar Media Group, Inc. | 0.01 | 0.47 | 0.99 | -3.04 | 0.0846 | -0.0114 | |||
| APAM / Artisan Partners Asset Management Inc. | 0.02 | 10.93 | 0.98 | 25.77 | 0.0835 | 0.0104 | |||
| CVX / Chevron Corporation | 0.01 | 7.75 | 0.95 | -7.79 | 0.0811 | -0.0157 | |||
| UNH / UnitedHealth Group Incorporated | 0.00 | -96.58 | 0.93 | -97.96 | 0.0799 | -4.2370 | |||
| COST / Costco Wholesale Corporation | 0.00 | 0.00 | 0.91 | 4.60 | 0.0779 | -0.0040 | |||
| HSY / The Hershey Company | 0.01 | 1.77 | 0.91 | -1.31 | 0.0777 | -0.0089 | |||
| CL / Colgate-Palmolive Company | 0.01 | -10.42 | 0.91 | -13.06 | 0.0774 | -0.0206 | |||
| MTN / Vail Resorts, Inc. | 0.01 | 15.75 | 0.90 | 13.64 | 0.0770 | 0.0024 | |||
| HON / Honeywell International Inc. | 0.00 | 13.24 | 0.87 | 24.68 | 0.0748 | 0.0087 | |||
| SYK / Stryker Corporation | 0.00 | 0.00 | 0.85 | 6.28 | 0.0724 | -0.0026 | |||
| SGOV / iShares Trust - iShares 0-3 Month Treasury Bond ETF | 0.01 | -25.85 | 0.84 | -25.86 | 0.0722 | -0.0349 | |||
| VICI / VICI Properties Inc. | 0.03 | 6.73 | 0.83 | 6.71 | 0.0708 | -0.0023 | |||
| TROW / T. Rowe Price Group, Inc. | 0.01 | 17.86 | 0.82 | 23.86 | 0.0697 | 0.0077 | |||
| SBUX / Starbucks Corporation | 0.01 | 0.80 | 0.0684 | 0.0684 | |||||
| CTRA / Coterra Energy Inc. | 0.03 | 11.68 | 0.76 | -1.94 | 0.0651 | -0.0080 | |||
| LAMR / Lamar Advertising Company | 0.01 | -6.62 | 0.73 | -0.41 | 0.0626 | -0.0066 | |||
| EMN / Eastman Chemical Company | 0.01 | 32.60 | 0.67 | 12.37 | 0.0575 | 0.0012 | |||
| BRK.B / Berkshire Hathaway Inc. | 0.00 | 0.00 | 0.63 | -8.70 | 0.0539 | -0.0111 | |||
| AAPL / Apple Inc. | 0.00 | -66.13 | 0.61 | -68.72 | 0.0521 | -0.1311 | |||
| COP / ConocoPhillips | 0.01 | 0.00 | 0.56 | -14.50 | 0.0479 | -0.0138 | |||
| ET / Energy Transfer LP - Limited Partnership | 0.03 | 0.00 | 0.50 | -2.55 | 0.0425 | -0.0055 | |||
| DHI / D.R. Horton, Inc. | 0.00 | -64.92 | 0.46 | -64.46 | 0.0395 | -0.0827 | |||
| FDS / FactSet Research Systems Inc. | 0.00 | -8.68 | 0.44 | -10.16 | 0.0378 | -0.0085 | |||
| JNJ / Johnson & Johnson | 0.00 | -2.59 | 0.37 | -10.34 | 0.0320 | -0.0072 | |||
| OKE / ONEOK, Inc. | 0.00 | 0.37 | 0.0318 | 0.0318 | |||||
| ADBE / Adobe Inc. | 0.00 | -98.62 | 0.37 | -98.61 | 0.0315 | -2.4532 | |||
| PG / The Procter & Gamble Company | 0.00 | 0.00 | 0.37 | -6.65 | 0.0313 | -0.0055 | |||
| GLD / SPDR Gold Trust | 0.00 | 0.08 | 0.36 | 5.87 | 0.0309 | -0.0012 | |||
| PECO / Phillips Edison & Company, Inc. | 0.01 | 0.32 | 0.0270 | 0.0270 | |||||
| PAYX / Paychex, Inc. | 0.00 | 0.00 | 0.29 | -5.84 | 0.0249 | -0.0042 | |||
| HD / The Home Depot, Inc. | 0.00 | 0.00 | 0.28 | 0.00 | 0.0243 | -0.0024 | |||
| VTI / Vanguard Index Funds - Vanguard Total Stock Market ETF | 0.00 | -3.81 | 0.28 | 6.56 | 0.0237 | -0.0008 | |||
| ORCL / Oracle Corporation | 0.00 | 0.23 | 0.0195 | 0.0195 | |||||
| VIOG / Vanguard Admiral Funds - Vanguard S&P Small-Cap 600 Growth ETF | 0.00 | 0.22 | 0.0191 | 0.0191 | |||||
| CCO / Clear Channel Outdoor Holdings, Inc. | 0.03 | 0.00 | 0.04 | 5.71 | 0.0032 | -0.0001 | |||
| BALL / Ball Corporation | 0.00 | -100.00 | 0.00 | 0.0000 | |||||
| NEM / Newmont Corporation | 0.00 | -100.00 | 0.00 | 0.0000 | |||||
| GSK / GSK plc - Depositary Receipt (Common Stock) | 0.00 | -100.00 | 0.00 | 0.0000 | |||||
| SPY / SPDR S&P 500 ETF | 0.00 | -100.00 | 0.00 | 0.0000 |