Mga Batayang Estadistika
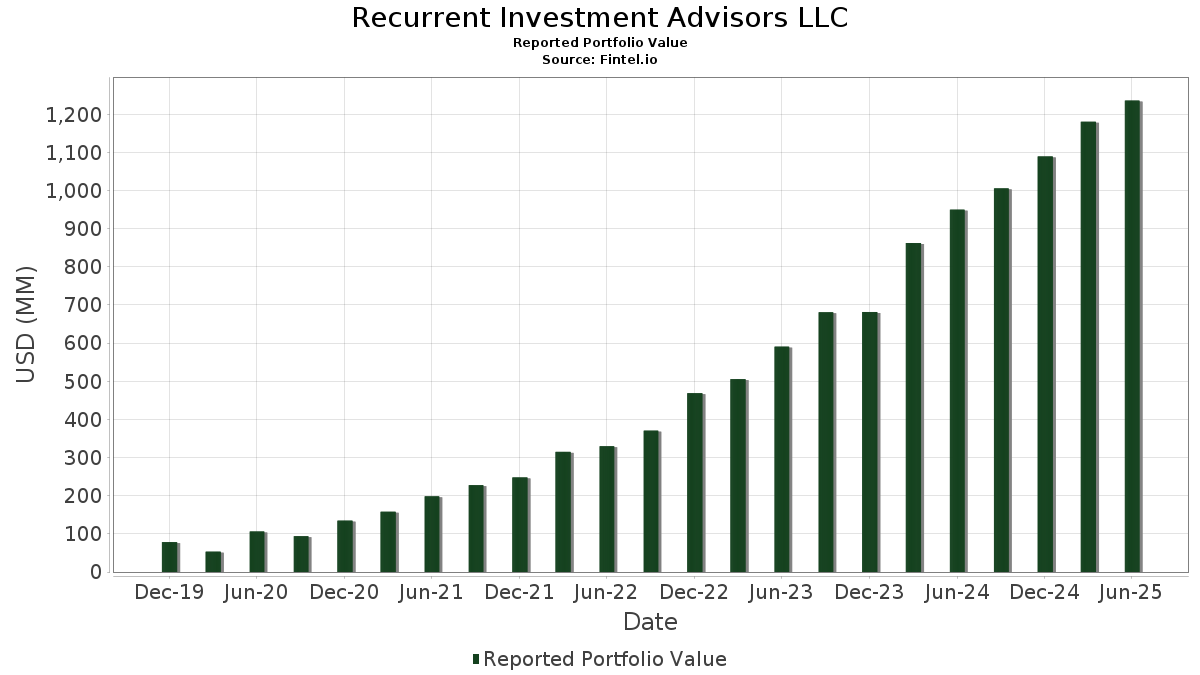
| Nilai Portofolio | $ 1,235,939,225 |
| Posisi Saat Ini | 64 |
Kepemilikan Terbaru, Kinerja, AUM (dari 13F, 13D)
Recurrent Investment Advisors LLC telah mengungkapkan total kepemilikan 64 dalam pengajuan SEC terbaru mereka. Nilai portofolio terbaru dihitung sebesar $ 1,235,939,225 USD. Aset yang Dikelola (AUM) sebenarnya adalah nilai ini ditambah kas (yang tidak diungkapkan). Aset-aset utama Recurrent Investment Advisors LLC adalah Cenovus Energy Inc. (US:CVE) , Energy Transfer LP - Limited Partnership (US:ET) , ONEOK, Inc. (US:OKE) , Targa Resources Corp. (US:TRGP) , and Cheniere Energy, Inc. (US:LNG) . Posisi baru Recurrent Investment Advisors LLC meliputi: Barrick Mining Corporation (US:B) , CRH plc (US:CRH) , .
Peningkatan Tertinggi Kuartal Ini
Kami menggunakan perubahan dalam alokasi portofolio karena ini adalah metrik yang paling bermakna. Perubahan dapat disebabkan oleh perdagangan atau perubahan harga saham.
| Keamanan | Saham (MM) |
Nilai (Juta Dolar AS) |
Portfolio % | ΔPorsyento ng Portfolio |
|---|---|---|---|---|
| 1.60 | 41.71 | 3.3744 | 3.3744 | |
| 2.39 | 51.74 | 4.1866 | 1.8196 | |
| 0.28 | 46.60 | 3.7706 | 1.4947 | |
| 6.30 | 88.12 | 7.1298 | 1.1293 | |
| 0.95 | 77.45 | 6.2663 | 0.5728 | |
| 0.22 | 5.29 | 0.4284 | 0.4284 | |
| 0.35 | 38.57 | 3.1207 | 0.2586 | |
| 0.47 | 55.71 | 4.5076 | 0.1600 | |
| 0.10 | 5.56 | 0.4502 | 0.1370 | |
| 0.09 | 3.87 | 0.3131 | 0.0779 |
Penurunan Tertinggi Kuartal Ini
Kami menggunakan perubahan dalam alokasi portofolio karena ini adalah metrik yang paling bermakna. Perubahan dapat disebabkan oleh perdagangan atau perubahan harga saham.
| Keamanan | Saham (MM) |
Nilai (Juta Dolar AS) |
Portfolio % | ΔPorsyento ng Portfolio |
|---|---|---|---|---|
| 0.66 | 17.17 | 1.3892 | -1.6611 | |
| 0.31 | 75.80 | 6.1332 | -1.1683 | |
| 1.85 | 69.66 | 5.6364 | -1.1102 | |
| 1.48 | 43.65 | 3.5316 | -1.0260 | |
| 2.70 | 52.58 | 4.2544 | -0.6353 | |
| 1.74 | 53.96 | 4.3662 | -0.6180 | |
| 0.93 | 50.03 | 4.0480 | -0.5404 | |
| 1.79 | 67.98 | 5.4999 | -0.4576 | |
| 1.36 | 52.57 | 4.2534 | -0.4575 | |
| 0.76 | 47.85 | 3.8719 | -0.4391 |
Pengajuan 13F dan Dana
Formulir ini diajukan pada 2025-08-14 untuk periode pelaporan 2025-06-30. Klik ikon tautan untuk melihat riwayat transaksi selengkapnya.
Tingkatkan ke versi premium untuk membuka data premium dan ekspor ke Excel. ![]() .
.
| Keamanan | Ketik | Harga Saham Rata-rata | Saham (MM) |
ΔSaham (%) |
ΔSaham (%) |
Nilai ($MM) |
Portpolyo (%) |
ΔPortofolio (%) |
|
|---|---|---|---|---|---|---|---|---|---|
| CVE / Cenovus Energy Inc. | 6.30 | 28.67 | 88.12 | 24.41 | 7.1298 | 1.1293 | |||
| ET / Energy Transfer LP - Limited Partnership | 4.79 | 1.43 | 86.89 | -1.08 | 7.0306 | -0.4110 | |||
| OKE / ONEOK, Inc. | 0.95 | 40.07 | 77.45 | 15.24 | 6.2663 | 0.5728 | |||
| TRGP / Targa Resources Corp. | 0.44 | 21.86 | 75.88 | 5.82 | 6.1395 | 0.0645 | |||
| LNG / Cheniere Energy, Inc. | 0.31 | -16.43 | 75.80 | -12.05 | 6.1332 | -1.1683 | |||
| PBA / Pembina Pipeline Corporation | 1.85 | -6.61 | 69.66 | -12.53 | 5.6364 | -1.1102 | |||
| SU / Suncor Energy Inc. | 1.79 | 0.22 | 67.98 | -3.34 | 5.4999 | -0.4576 | |||
| PSX / Phillips 66 | 0.47 | 12.36 | 55.71 | 8.55 | 4.5076 | 0.1600 | |||
| EPD / Enterprise Products Partners L.P. - Limited Partnership | 1.74 | 0.98 | 53.96 | -8.28 | 4.3662 | -0.6180 | |||
| PAGP / Plains GP Holdings, L.P. - Limited Partnership | 2.70 | 0.12 | 52.58 | -8.90 | 4.2544 | -0.6353 | |||
| WES / Western Midstream Partners, LP - Limited Partnership | 1.36 | 0.06 | 52.57 | -5.47 | 4.2534 | -0.4575 | |||
| PBF / PBF Energy Inc. | 2.39 | 63.15 | 51.74 | 85.20 | 4.1866 | 1.8196 | |||
| SUN / Sunoco LP - Limited Partnership | 0.93 | 0.08 | 50.03 | -7.63 | 4.0480 | -0.5404 | |||
| WMB / The Williams Companies, Inc. | 0.76 | -10.53 | 47.85 | -5.96 | 3.8719 | -0.4391 | |||
| MPC / Marathon Petroleum Corporation | 0.28 | 52.14 | 46.60 | 73.47 | 3.7706 | 1.4947 | |||
| KMI / Kinder Morgan, Inc. | 1.48 | -21.27 | 43.65 | -18.87 | 3.5316 | -1.0260 | |||
| SOBO / South Bow Corporation | 1.60 | 41.71 | 3.3744 | 3.3744 | |||||
| DTM / DT Midstream, Inc. | 0.35 | 0.21 | 38.57 | 14.16 | 3.1207 | 0.2586 | |||
| VLO / Valero Energy Corporation | 0.18 | 0.16 | 24.15 | 1.94 | 1.9539 | -0.0529 | |||
| ENB / Enbridge Inc. | 0.46 | 0.12 | 21.03 | 2.40 | 1.7017 | -0.0383 | |||
| ARLP / Alliance Resource Partners, L.P. - Limited Partnership | 0.66 | -50.23 | 17.17 | -52.31 | 1.3892 | -1.6611 | |||
| VNOM / Viper Energy, Inc. | 0.35 | 0.18 | 13.18 | -15.40 | 1.0667 | -0.2535 | |||
| TRP / TC Energy Corporation | 0.22 | 0.43 | 10.97 | 3.79 | 0.8876 | -0.0078 | |||
| XOM / Exxon Mobil Corporation | 0.06 | 10.81 | 6.23 | 0.45 | 0.5038 | -0.0214 | |||
| NEM / Newmont Corporation | 0.10 | 24.71 | 5.56 | 50.50 | 0.4502 | 0.1370 | |||
| B / Barrick Mining Corporation | 0.22 | 5.29 | 0.4284 | 0.4284 | |||||
| NTR / Nutrien Ltd. | 0.05 | 0.00 | 3.97 | 11.15 | 0.3211 | 0.0185 | |||
| FCX / Freeport-McMoRan Inc. | 0.09 | 21.72 | 3.87 | 39.37 | 0.3131 | 0.0779 | |||
| CVX / Chevron Corporation | 0.02 | 0.34 | 3.04 | -14.10 | 0.2459 | -0.0539 | |||
| COP / ConocoPhillips | 0.03 | 0.17 | 2.99 | -14.42 | 0.2416 | -0.0539 | |||
| HES / Hess Corporation | 0.02 | 25.03 | 2.95 | 8.45 | 0.2388 | 0.0082 | |||
| SEE / Sealed Air Corporation | 0.09 | 0.19 | 2.79 | 7.59 | 0.2260 | 0.0060 | |||
| NUE / Nucor Corporation | 0.02 | 0.00 | 2.74 | 7.67 | 0.2214 | 0.0061 | |||
| TECK / Teck Resources Limited | 0.05 | 0.17 | 2.27 | 7.44 | 0.1834 | 0.0047 | |||
| MTDR / Matador Resources Company | 0.04 | 42.69 | 2.03 | 33.29 | 0.1643 | 0.0352 | |||
| CNQ / Canadian Natural Resources Limited | 0.06 | 0.38 | 1.86 | 2.37 | 0.1505 | -0.0035 | |||
| FANG / Diamondback Energy, Inc. | 0.01 | 21.57 | 1.62 | 4.46 | 0.1307 | -0.0003 | |||
| AA / Alcoa Corporation | 0.05 | 0.23 | 1.58 | -3.02 | 0.1275 | -0.0102 | |||
| HAL / Halliburton Company | 0.07 | 0.25 | 1.48 | -19.48 | 0.1195 | -0.0358 | |||
| MT / ArcelorMittal S.A. - Depositary Receipt (Common Stock) | 0.05 | 0.76 | 1.44 | 2.28 | 0.1163 | -0.0027 | |||
| WLK / Westlake Corporation | 0.02 | 0.03 | 1.37 | -24.09 | 0.1112 | -0.0421 | |||
| SHEL / Shell plc - Depositary Receipt (Common Stock) | 0.05 | 0.97 | 1.35 | -7.29 | 0.1092 | -0.0141 | |||
| BHP / BHP Group Limited - Depositary Receipt (Common Stock) | 0.03 | 0.00 | 1.32 | -0.98 | 0.1066 | -0.0061 | |||
| DAR / Darling Ingredients Inc. | 0.03 | 0.88 | 1.22 | 22.51 | 0.0987 | 0.0144 | |||
| PKX / POSCO Holdings Inc. - Depositary Receipt (Common Stock) | 0.02 | 0.00 | 1.21 | 2.03 | 0.0979 | -0.0026 | |||
| EXE / Expand Energy Corporation | 0.01 | 0.44 | 1.13 | 5.59 | 0.0917 | 0.0007 | |||
| VST / Vistra Corp. | 0.01 | 14.74 | 0.98 | 89.40 | 0.0796 | 0.0356 | |||
| VALE / Vale S.A. - Depositary Receipt (Common Stock) | 0.10 | 154.91 | 0.97 | 148.47 | 0.0789 | 0.0456 | |||
| CCK / Crown Holdings, Inc. | 0.01 | 45.92 | 0.97 | 68.35 | 0.0784 | 0.0296 | |||
| ALB / Albemarle Corporation | 0.02 | 0.38 | 0.96 | -12.68 | 0.0775 | -0.0154 | |||
| TTE / TotalEnergies SE - Depositary Receipt (Common Stock) | 0.02 | 0.00 | 0.92 | -5.04 | 0.0747 | -0.0077 | |||
| MOS / The Mosaic Company | 0.02 | 0.00 | 0.91 | 35.01 | 0.0737 | 0.0166 | |||
| RIO / Rio Tinto Group - Depositary Receipt (Common Stock) | 0.02 | 0.00 | 0.91 | -2.90 | 0.0732 | -0.0057 | |||
| MUSA / Murphy USA Inc. | 0.00 | 8.74 | 0.81 | -5.82 | 0.0655 | -0.0073 | |||
| DOW / Dow Inc. | 0.03 | 0.00 | 0.75 | -24.14 | 0.0606 | -0.0231 | |||
| CEG / Constellation Energy Corporation | 0.00 | 7.06 | 0.74 | 71.20 | 0.0602 | 0.0234 | |||
| CF / CF Industries Holdings, Inc. | 0.01 | -0.08 | 0.71 | 17.66 | 0.0577 | 0.0063 | |||
| WY / Weyerhaeuser Company | 0.02 | 0.00 | 0.62 | -12.23 | 0.0500 | -0.0097 | |||
| CRH / CRH plc | 0.01 | 0.57 | 0.0460 | 0.0460 | |||||
| FMC / FMC Corporation | 0.01 | 0.04 | 0.56 | -0.88 | 0.0457 | -0.0026 | |||
| EOG / EOG Resources, Inc. | 0.00 | 0.09 | 0.55 | -6.73 | 0.0449 | -0.0055 | |||
| MLM / Martin Marietta Materials, Inc. | 0.00 | 0.10 | 0.55 | 14.97 | 0.0448 | 0.0040 | |||
| CCJ / Cameco Corporation | 0.01 | 0.16 | 0.50 | 80.87 | 0.0406 | 0.0171 | |||
| ADM / Archer-Daniels-Midland Company | 0.01 | -0.04 | 0.37 | 10.00 | 0.0303 | 0.0014 | |||
| SW / Smurfit Westrock Plc | 0.00 | -100.00 | 0.00 | 0.0000 | |||||
| BP / BP p.l.c. - Depositary Receipt (Common Stock) | 0.00 | -100.00 | 0.00 | 0.0000 | |||||
| X / United States Steel Corporation | 0.00 | -100.00 | 0.00 | 0.0000 | |||||
| GOLD / Barrick Mining Corporation | 0.00 | -100.00 | 0.00 | 0.0000 |