Mga Batayang Estadistika
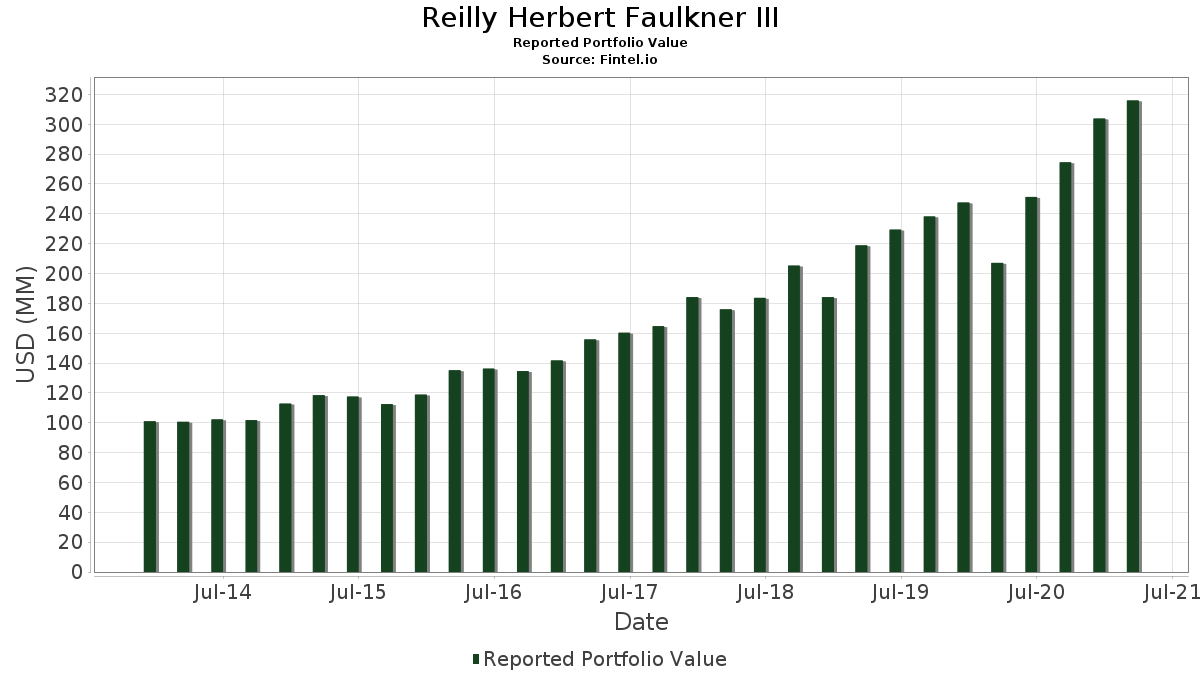
| Nilai Portofolio | $ 315,899,000 |
| Posisi Saat Ini | 56 |
Kepemilikan Terbaru, Kinerja, AUM (dari 13F, 13D)
Reilly Herbert Faulkner III telah mengungkapkan total kepemilikan 56 dalam pengajuan SEC terbaru mereka. Nilai portofolio terbaru dihitung sebesar $ 315,899,000 USD. Aset yang Dikelola (AUM) sebenarnya adalah nilai ini ditambah kas (yang tidak diungkapkan). Aset-aset utama Reilly Herbert Faulkner III adalah Apple Inc. (US:AAPL) , Cintas Corporation (US:CTAS) , Tractor Supply Company (US:TSCO) , Tootsie Roll Industries, Inc. (US:TR) , and NextEra Energy, Inc. (US:NEE) . Posisi baru Reilly Herbert Faulkner III meliputi: Standex International Corporation (US:SXI) , Microsoft Corporation (US:MSFT) , .
Peningkatan Tertinggi Kuartal Ini
Kami menggunakan perubahan dalam alokasi portofolio karena ini adalah metrik yang paling bermakna. Perubahan dapat disebabkan oleh perdagangan atau perubahan harga saham.
| Keamanan | Saham (MM) |
Nilai (Juta Dolar AS) |
Portfolio % | ΔPorsyento ng Portfolio |
|---|---|---|---|---|
| 0.34 | 11.17 | 3.5347 | 1.3019 | |
| 0.43 | 8.53 | 2.7005 | 0.8252 | |
| 0.06 | 11.31 | 3.5809 | 0.6700 | |
| 0.15 | 9.49 | 3.0029 | 0.5350 | |
| 0.05 | 5.36 | 1.6967 | 0.4100 | |
| 0.03 | 8.38 | 2.6540 | 0.3017 | |
| 0.07 | 4.95 | 1.5673 | 0.2328 | |
| 0.06 | 7.14 | 2.2599 | 0.2308 | |
| 0.02 | 5.88 | 1.8629 | 0.1947 | |
| 0.06 | 8.64 | 2.7338 | 0.1906 |
Penurunan Tertinggi Kuartal Ini
Kami menggunakan perubahan dalam alokasi portofolio karena ini adalah metrik yang paling bermakna. Perubahan dapat disebabkan oleh perdagangan atau perubahan harga saham.
| Keamanan | Saham (MM) |
Nilai (Juta Dolar AS) |
Portfolio % | ΔPorsyento ng Portfolio |
|---|---|---|---|---|
| 0.00 | 0.20 | 0.0636 | -1.6046 | |
| 0.10 | 12.41 | 3.9297 | -1.5692 | |
| 0.04 | 8.49 | 2.6888 | -0.7656 | |
| 0.27 | 9.29 | 2.9418 | -0.4201 | |
| 0.03 | 9.00 | 2.8484 | -0.2403 | |
| 0.10 | 8.70 | 2.7550 | -0.2221 | |
| 0.03 | 11.39 | 3.6068 | -0.2093 | |
| 0.00 | 9.62 | 3.0450 | -0.2067 | |
| 0.02 | 7.58 | 2.3979 | -0.1871 | |
| 0.04 | 8.36 | 2.6474 | -0.1391 |
Pengajuan 13F dan Dana
Formulir ini diajukan pada 2021-05-12 untuk periode pelaporan 2021-03-31. Klik ikon tautan untuk melihat riwayat transaksi selengkapnya.
Tingkatkan ke versi premium untuk membuka data premium dan ekspor ke Excel. ![]() .
.
| Keamanan | Ketik | Harga Saham Rata-rata | Saham (MM) |
ΔSaham (%) |
ΔSaham (%) |
Nilai ($MM) |
Portpolyo (%) |
ΔPortofolio (%) |
|
|---|---|---|---|---|---|---|---|---|---|
| AAPL / Apple Inc. | 0.10 | -19.28 | 12.41 | -25.69 | 3.9297 | -1.5692 | |||
| CTAS / Cintas Corporation | 0.03 | 1.78 | 11.39 | -1.72 | 3.6068 | -0.2093 | |||
| TSCO / Tractor Supply Company | 0.06 | 1.55 | 11.31 | 27.92 | 3.5809 | 0.6700 | |||
| TR / Tootsie Roll Industries, Inc. | 0.34 | 47.57 | 11.17 | 64.62 | 3.5347 | 1.3019 | |||
| NEE / NextEra Energy, Inc. | 0.13 | 1.64 | 9.86 | -0.38 | 3.1206 | -0.1369 | |||
| AMZN / Amazon.com, Inc. | 0.00 | 2.51 | 9.62 | -2.62 | 3.0450 | -0.2067 | |||
| INTU / Intuit Inc. | 0.02 | 1.33 | 9.57 | 2.19 | 3.0304 | -0.0533 | |||
| SCHW / The Charles Schwab Corporation | 0.15 | 2.96 | 9.49 | 26.53 | 3.0029 | 0.5350 | |||
| UNP / Union Pacific Corporation | 0.04 | 1.81 | 9.44 | 7.77 | 2.9870 | 0.1047 | |||
| V / Visa Inc. | 0.04 | 2.67 | 9.35 | -0.63 | 2.9608 | -0.1375 | |||
| APD / Air Products and Chemicals, Inc. | 0.03 | 2.00 | 9.33 | 5.03 | 2.9535 | 0.0294 | |||
| ROL / Rollins, Inc. | 0.27 | 3.28 | 9.29 | -9.01 | 2.9418 | -0.4201 | |||
| PG / The Procter & Gamble Company | 0.07 | 2.36 | 9.10 | -0.37 | 2.8816 | -0.1261 | |||
| ADP / Automatic Data Processing, Inc. | 0.05 | 2.55 | 9.04 | 9.68 | 2.8626 | 0.1486 | |||
| COST / Costco Wholesale Corporation | 0.03 | 2.51 | 9.00 | -4.10 | 2.8484 | -0.2403 | |||
| APH / Amphenol Corporation | 0.13 | 104.34 | 8.80 | 3.08 | 2.7867 | -0.0245 | |||
| MKC / McCormick & Company, Incorporated | 0.10 | 3.18 | 8.70 | -3.77 | 2.7550 | -0.2221 | |||
| DOV / Dover Corporation | 0.06 | 2.91 | 8.64 | 11.78 | 2.7338 | 0.1906 | |||
| GOLD / Barrick Mining Corporation | 0.43 | 72.29 | 8.53 | 49.75 | 2.7005 | 0.8252 | |||
| DHR / Danaher Corporation | 0.04 | -20.12 | 8.49 | -19.06 | 2.6888 | -0.7656 | |||
| LII / Lennox International Inc. | 0.03 | 3.16 | 8.38 | 17.32 | 2.6540 | 0.3017 | |||
| TJX / The TJX Companies, Inc. | 0.13 | 2.03 | 8.38 | -1.17 | 2.6540 | -0.1384 | |||
| CLX / The Clorox Company | 0.04 | 3.43 | 8.36 | -1.20 | 2.6474 | -0.1391 | |||
| AMGN / Amgen Inc. | 0.03 | 3.25 | 8.25 | 11.72 | 2.6110 | 0.1806 | |||
| RPM / RPM International Inc. | 0.09 | 3.54 | 8.21 | 4.76 | 2.5973 | 0.0192 | |||
| WEC / WEC Energy Group, Inc. | 0.08 | 4.82 | 7.88 | 6.61 | 2.4932 | 0.0612 | |||
| MTN / Vail Resorts, Inc. | 0.03 | 3.71 | 7.85 | 8.43 | 2.4843 | 0.1017 | |||
| POOL / Pool Corporation | 0.02 | 4.07 | 7.58 | -3.54 | 2.3979 | -0.1871 | |||
| JNJ / Johnson & Johnson | 0.04 | 4.89 | 7.28 | 9.53 | 2.3033 | 0.1165 | |||
| WM / Waste Management, Inc. | 0.06 | 5.86 | 7.14 | 15.82 | 2.2599 | 0.2308 | |||
| BDX / Becton, Dickinson and Company | 0.03 | 6.60 | 6.55 | 3.59 | 2.0734 | -0.0079 | |||
| HSIC / Henry Schein, Inc. | 0.09 | 8.97 | 6.34 | 12.85 | 2.0073 | 0.1576 | |||
| PKG / Packaging Corporation of America | 0.05 | 10.38 | 6.20 | 7.64 | 1.9633 | 0.0666 | |||
| BRK.B / Berkshire Hathaway Inc. | 0.02 | 5.40 | 5.88 | 16.12 | 1.8629 | 0.1947 | |||
| CVX / Chevron Corporation | 0.05 | 10.49 | 5.36 | 37.12 | 1.6967 | 0.4100 | |||
| FTV / Fortive Corporation | 0.07 | 22.44 | 4.95 | 22.13 | 1.5673 | 0.2328 | |||
| BRK.A / Berkshire Hathaway Inc. | 0.00 | 0.00 | 1.93 | 10.93 | 0.6106 | 0.0382 | |||
| GOOG / Alphabet Inc. | 0.00 | 0.00 | 0.72 | 18.17 | 0.2286 | 0.0274 | |||
| GOOGL / Alphabet Inc. | 0.00 | 0.00 | 0.69 | 17.78 | 0.2181 | 0.0255 | |||
| DIS / The Walt Disney Company | 0.00 | 2.39 | 0.64 | 4.23 | 0.2026 | 0.0005 | |||
| HD / The Home Depot, Inc. | 0.00 | 2.18 | 0.39 | 17.68 | 0.1222 | 0.0142 | |||
| UPS / United Parcel Service, Inc. | 0.00 | -35.14 | 0.37 | -34.53 | 0.1159 | -0.0682 | |||
| RTX / RTX Corporation | 0.00 | 0.00 | 0.35 | 8.26 | 0.1121 | 0.0044 | |||
| UNH / UnitedHealth Group Incorporated | 0.00 | 5.59 | 0.35 | 12.10 | 0.1114 | 0.0081 | |||
| XLK / The Select Sector SPDR Trust - The Technology Select Sector SPDR Fund | 0.00 | 5.80 | 0.35 | 8.00 | 0.1111 | 0.0041 | |||
| DE / Deere & Company | 0.00 | -0.66 | 0.34 | 38.27 | 0.1064 | 0.0264 | |||
| MMM / 3M Company | 0.00 | 0.00 | 0.33 | 10.23 | 0.1057 | 0.0060 | |||
| IHI / iShares Trust - iShares U.S. Medical Devices ETF | 0.00 | 0.00 | 0.33 | 0.92 | 0.1045 | -0.0032 | |||
| JPM / JPMorgan Chase & Co. | 0.00 | 0.00 | 0.33 | 19.78 | 0.1035 | 0.0136 | |||
| VNDA / Vanda Pharmaceuticals Inc. | 0.02 | 0.00 | 0.30 | 14.07 | 0.0950 | 0.0084 | |||
| HON / Honeywell International Inc. | 0.00 | 0.00 | 0.29 | 1.75 | 0.0918 | -0.0020 | |||
| SXI / Standex International Corporation | 0.00 | 0.22 | 0.0690 | 0.0690 | |||||
| DUK / Duke Energy Corporation | 0.00 | 2.28 | 0.22 | 8.00 | 0.0684 | 0.0025 | |||
| XOM / Exxon Mobil Corporation | 0.00 | 0.21 | 0.0677 | 0.0677 | |||||
| MSFT / Microsoft Corporation | 0.00 | 0.21 | 0.0671 | 0.0671 | |||||
| SR / Spire Inc. | 0.00 | -96.57 | 0.20 | -96.03 | 0.0636 | -1.6046 |