Mga Batayang Estadistika
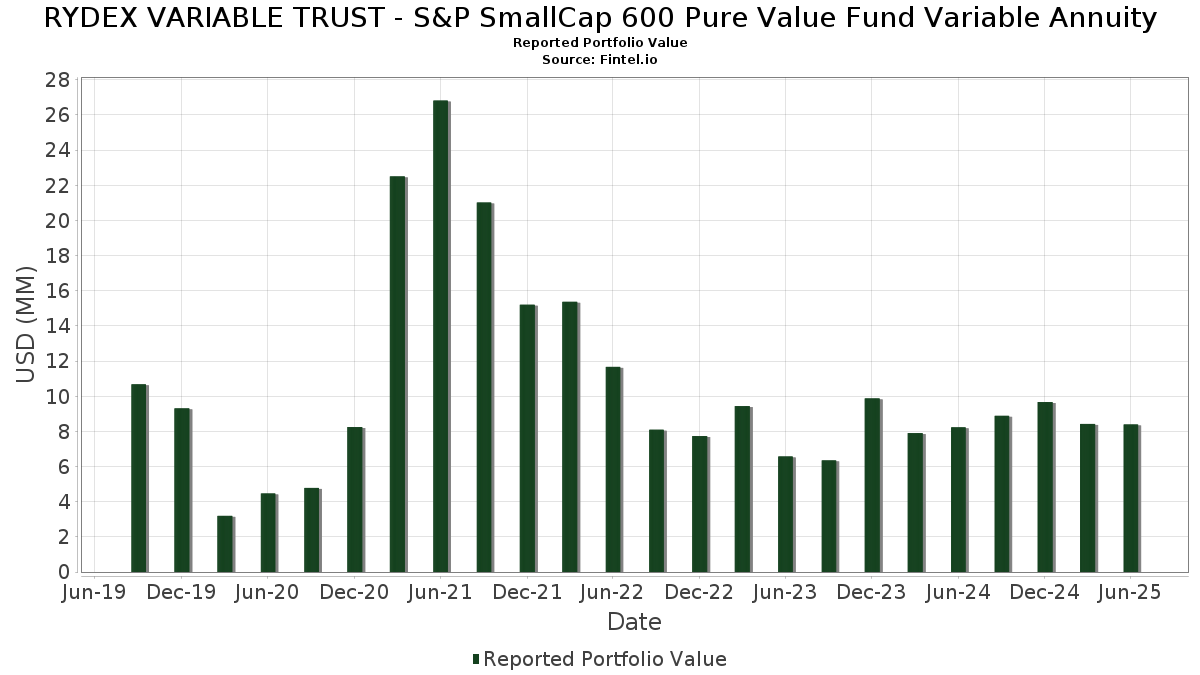
| Nilai Portofolio | $ 8,392,919 |
| Posisi Saat Ini | 149 |
Kepemilikan Terbaru, Kinerja, AUM (dari 13F, 13D)
RYDEX VARIABLE TRUST - S&P SmallCap 600 Pure Value Fund Variable Annuity telah mengungkapkan total kepemilikan 149 dalam pengajuan SEC terbaru mereka. Nilai portofolio terbaru dihitung sebesar $ 8,392,919 USD. Aset yang Dikelola (AUM) sebenarnya adalah nilai ini ditambah kas (yang tidak diungkapkan). Aset-aset utama RYDEX VARIABLE TRUST - S&P SmallCap 600 Pure Value Fund Variable Annuity adalah Par Pacific Holdings, Inc. (US:PARR) , SpartanNash Company (US:SPTN) , Viasat, Inc. (US:VSAT) , Titan International, Inc. (US:TWI) , and Dana Incorporated (US:DAN) . Posisi baru RYDEX VARIABLE TRUST - S&P SmallCap 600 Pure Value Fund Variable Annuity meliputi: Angi Inc. (US:ANGI) , .
Peningkatan Tertinggi Kuartal Ini
Kami menggunakan perubahan dalam alokasi portofolio karena ini adalah metrik yang paling bermakna. Perubahan dapat disebabkan oleh perdagangan atau perubahan harga saham.
| Keamanan | Saham (MM) |
Nilai (Juta Dolar AS) |
Portfolio % | ΔPorsyento ng Portfolio |
|---|---|---|---|---|
| 0.30 | 0.30 | 3.7239 | 3.7239 | |
| 0.01 | 0.22 | 2.7573 | 1.2200 | |
| 0.00 | 0.07 | 0.8305 | 0.8305 | |
| 0.01 | 0.14 | 1.7216 | 0.7297 | |
| 0.01 | 0.13 | 1.6183 | 0.6522 | |
| 0.01 | 0.18 | 2.2036 | 0.5723 | |
| 0.01 | 0.14 | 1.6940 | 0.5329 | |
| 0.01 | 0.18 | 2.2686 | 0.4687 | |
| 0.03 | 0.3891 | 0.3891 | ||
| 0.01 | 0.15 | 1.8551 | 0.3593 |
Penurunan Tertinggi Kuartal Ini
Kami menggunakan perubahan dalam alokasi portofolio karena ini adalah metrik yang paling bermakna. Perubahan dapat disebabkan oleh perdagangan atau perubahan harga saham.
| Keamanan | Saham (MM) |
Nilai (Juta Dolar AS) |
Portfolio % | ΔPorsyento ng Portfolio |
|---|---|---|---|---|
| 0.02 | 0.08 | 0.9433 | -0.6459 | |
| 0.00 | 0.06 | 0.7159 | -0.3222 | |
| 0.00 | 0.09 | 1.1834 | -0.2593 | |
| 0.00 | 0.08 | 1.0419 | -0.2372 | |
| 0.00 | 0.05 | 0.6345 | -0.2335 | |
| 0.00 | 0.02 | 0.2399 | -0.2292 | |
| 0.00 | 0.07 | 0.8328 | -0.2220 | |
| 0.01 | 0.04 | 0.5056 | -0.2214 | |
| 0.00 | 0.08 | 1.0355 | -0.2190 | |
| 0.01 | 0.09 | 1.0910 | -0.2100 |
Pengajuan 13F dan Dana
Formulir ini diajukan pada 2025-08-27 untuk periode pelaporan 2025-06-30. Klik ikon tautan untuk melihat riwayat transaksi selengkapnya.
Tingkatkan ke versi premium untuk membuka data premium dan ekspor ke Excel. ![]() .
.
| Keamanan | Ketik | Harga Saham Rata-rata | Saham (MM) |
ΔSaham (%) |
ΔSaham (%) |
Nilai ($MM) |
Portpolyo (%) |
ΔPortofolio (%) |
|
|---|---|---|---|---|---|---|---|---|---|
| First American Government Obligations Fund - Class X / STIV (N/A) | 0.30 | 0.30 | 3.7239 | 3.7239 | |||||
| PARR / Par Pacific Holdings, Inc. | 0.01 | -5.81 | 0.22 | 75.40 | 2.7573 | 1.2200 | |||
| SPTN / SpartanNash Company | 0.01 | -5.81 | 0.18 | 23.13 | 2.2686 | 0.4687 | |||
| VSAT / Viasat, Inc. | 0.01 | -5.80 | 0.18 | 32.33 | 2.2036 | 0.5723 | |||
| TWI / Titan International, Inc. | 0.02 | -5.81 | 0.16 | 14.81 | 1.9414 | 0.2961 | |||
| DAN / Dana Incorporated | 0.01 | -5.82 | 0.15 | 21.31 | 1.8551 | 0.3593 | |||
| EYE / National Vision Holdings, Inc. | 0.01 | -5.81 | 0.14 | 70.37 | 1.7216 | 0.7297 | |||
| ADNT / Adient plc | 0.01 | -5.80 | 0.14 | 42.11 | 1.6940 | 0.5329 | |||
| WKC / World Kinect Corporation | 0.00 | -5.82 | 0.13 | -5.71 | 1.6475 | -0.0622 | |||
| FL / Foot Locker, Inc. | 0.01 | -5.81 | 0.13 | 63.29 | 1.6183 | 0.6522 | |||
| MODG / Topgolf Callaway Brands Corp. | 0.02 | -5.81 | 0.13 | 15.60 | 1.5761 | 0.2377 | |||
| AAP / Advance Auto Parts, Inc. | 0.00 | -5.82 | 0.12 | 12.15 | 1.5006 | 0.1876 | |||
| PRA / ProAssurance Corporation | 0.01 | -5.80 | 0.12 | -7.81 | 1.4801 | -0.0900 | |||
| GNW / Genworth Financial, Inc. | 0.02 | -5.81 | 0.12 | 3.51 | 1.4759 | 0.0807 | |||
| LNC / Lincoln National Corporation | 0.00 | -5.83 | 0.12 | -9.30 | 1.4697 | -0.1129 | |||
| FDP / Fresh Del Monte Produce Inc. | 0.00 | -5.81 | 0.11 | -0.89 | 1.3892 | 0.0189 | |||
| HZO / MarineMax, Inc. | 0.00 | -5.80 | 0.11 | 10.10 | 1.3644 | 0.1542 | |||
| MRP / Millrose Properties, Inc. | 0.00 | -5.81 | 0.11 | 1.94 | 1.3091 | 0.0465 | |||
| NVRI / Enviri Corporation | 0.01 | -5.82 | 0.10 | 22.62 | 1.2918 | 0.2651 | |||
| OI / O-I Glass, Inc. | 0.01 | -5.81 | 0.10 | 21.25 | 1.2123 | 0.2338 | |||
| UNFI / United Natural Foods, Inc. | 0.00 | -5.83 | 0.09 | -20.34 | 1.1834 | -0.2593 | |||
| EZPW / EZCORP, Inc. | 0.01 | -5.82 | 0.09 | -11.54 | 1.1518 | -0.1153 | |||
| SAH / Sonic Automotive, Inc. | 0.00 | -5.80 | 0.09 | 32.35 | 1.1331 | 0.2956 | |||
| CVI / CVR Energy, Inc. | 0.00 | -5.79 | 0.09 | 30.43 | 1.1271 | 0.2825 | |||
| BWA / BorgWarner Inc. | 0.00 | -5.81 | 0.09 | 9.88 | 1.1174 | 0.1256 | |||
| AHCO / AdaptHealth Corp. | 0.01 | -5.82 | 0.09 | -17.92 | 1.0910 | -0.2100 | |||
| ABG / Asbury Automotive Group, Inc. | 0.00 | -5.73 | 0.09 | 2.38 | 1.0766 | 0.0436 | |||
| UVV / Universal Corporation | 0.00 | -5.77 | 0.09 | -2.30 | 1.0667 | 0.0022 | |||
| KSS / Kohl's Corporation | 0.01 | -5.81 | 0.08 | -2.33 | 1.0525 | -0.0006 | |||
| AMN / AMN Healthcare Services, Inc. | 0.00 | -5.82 | 0.08 | -20.95 | 1.0419 | -0.2372 | |||
| SCHL / Scholastic Corporation | 0.00 | -5.80 | 0.08 | 5.06 | 1.0400 | 0.0692 | |||
| ANDE / The Andersons, Inc. | 0.00 | -5.79 | 0.08 | -18.63 | 1.0355 | -0.2190 | |||
| KOP / Koppers Holdings Inc. | 0.00 | -5.82 | 0.08 | 8.57 | 0.9540 | 0.0921 | |||
| BGS / B&G Foods, Inc. | 0.02 | -5.81 | 0.08 | -42.31 | 0.9433 | -0.6459 | |||
| INVX / Innovex International, Inc. | 0.00 | -5.80 | 0.07 | -18.39 | 0.8890 | -0.1712 | |||
| CBRL / Cracker Barrel Old Country Store, Inc. | 0.00 | -5.80 | 0.07 | 48.94 | 0.8788 | 0.2995 | |||
| CE / Celanese Corporation | 0.00 | -5.86 | 0.07 | -7.89 | 0.8747 | -0.0568 | |||
| GIII / G-III Apparel Group, Ltd. | 0.00 | -5.81 | 0.07 | -23.26 | 0.8328 | -0.2220 | |||
| ANGI / Angi Inc. | 0.00 | 0.07 | 0.8305 | 0.8305 | |||||
| SMP / Standard Motor Products, Inc. | 0.00 | -5.80 | 0.07 | 15.79 | 0.8273 | 0.1310 | |||
| DXC / DXC Technology Company | 0.00 | -5.81 | 0.07 | -16.67 | 0.8214 | -0.1288 | |||
| AL / Air Lease Corporation | 0.00 | -5.79 | 0.07 | 14.04 | 0.8189 | 0.1175 | |||
| GES / Guess?, Inc. | 0.01 | -5.80 | 0.07 | 3.17 | 0.8128 | 0.0409 | |||
| SCSC / ScanSource, Inc. | 0.00 | -5.81 | 0.07 | 16.07 | 0.8111 | 0.1267 | |||
| SEM / Select Medical Holdings Corporation | 0.00 | -5.81 | 0.06 | -14.67 | 0.8043 | -0.1135 | |||
| UFCS / United Fire Group, Inc. | 0.00 | -5.81 | 0.06 | -8.82 | 0.7826 | -0.0507 | |||
| SPNT / SiriusPoint Ltd. | 0.00 | -5.79 | 0.06 | 10.71 | 0.7812 | 0.0942 | |||
| TALO / Talos Energy Inc. | 0.01 | -5.81 | 0.06 | -18.67 | 0.7723 | -0.1460 | |||
| MTUS / Metallus Inc. | 0.00 | -5.83 | 0.06 | 8.93 | 0.7700 | 0.0774 | |||
| OMI / Owens & Minor, Inc. | 0.01 | -5.82 | 0.06 | -4.69 | 0.7607 | -0.0224 | |||
| AXL / American Axle & Manufacturing Holdings, Inc. | 0.01 | -5.81 | 0.06 | -4.84 | 0.7371 | -0.0256 | |||
| PRAA / PRA Group, Inc. | 0.00 | -5.81 | 0.06 | -32.94 | 0.7159 | -0.3222 | |||
| IAC / IAC Inc. | 0.00 | -5.81 | 0.06 | -23.29 | 0.7025 | -0.1940 | |||
| NAVI / Navient Corporation | 0.00 | -5.80 | 0.06 | 5.66 | 0.7019 | 0.0498 | |||
| JBLU / JetBlue Airways Corporation | 0.01 | -5.80 | 0.06 | -17.65 | 0.7009 | -0.1275 | |||
| KALU / Kaiser Aluminum Corporation | 0.00 | -5.84 | 0.05 | 25.58 | 0.6744 | 0.1435 | |||
| PENN / PENN Entertainment, Inc. | 0.00 | -5.80 | 0.05 | 1.96 | 0.6588 | 0.0352 | |||
| CRSR / Corsair Gaming, Inc. | 0.01 | -5.82 | 0.05 | 2.00 | 0.6359 | 0.0161 | |||
| VTLE / Vital Energy, Inc. | 0.00 | -5.81 | 0.05 | -29.58 | 0.6345 | -0.2335 | |||
| HCSG / Healthcare Services Group, Inc. | 0.00 | -5.83 | 0.05 | 42.86 | 0.6264 | 0.1905 | |||
| BTU / Peabody Energy Corporation | 0.00 | -5.81 | 0.05 | -7.55 | 0.6179 | -0.0293 | |||
| NYMT / New York Mortgage Trust, Inc. | 0.01 | -5.82 | 0.05 | -2.00 | 0.6125 | -0.0030 | |||
| ASIX / AdvanSix Inc. | 0.00 | -5.77 | 0.05 | -2.04 | 0.6088 | 0.0068 | |||
| PMT / PennyMac Mortgage Investment Trust | 0.00 | -5.82 | 0.05 | -17.24 | 0.6016 | -0.1094 | |||
| MLKN / MillerKnoll, Inc. | 0.00 | -5.84 | 0.05 | -4.08 | 0.5934 | -0.0134 | |||
| CRGY / Crescent Energy Company | 0.01 | -5.82 | 0.05 | -29.23 | 0.5848 | -0.2081 | |||
| 2IY / Cushman & Wakefield plc | 0.00 | -5.81 | 0.05 | 2.22 | 0.5813 | 0.0246 | |||
| SITC / SITE Centers Corp. | 0.00 | -5.80 | 0.05 | -16.67 | 0.5633 | -0.1000 | |||
| SBH / Sally Beauty Holdings, Inc. | 0.00 | -5.80 | 0.04 | -4.35 | 0.5583 | -0.0064 | |||
| TDS / Telephone and Data Systems, Inc. | 0.00 | -5.79 | 0.04 | -13.73 | 0.5554 | -0.0718 | |||
| ABM / ABM Industries Incorporated | 0.00 | -5.81 | 0.04 | -6.38 | 0.5539 | -0.0225 | |||
| AVNS / Avanos Medical, Inc. | 0.00 | -5.79 | 0.04 | -19.23 | 0.5285 | -0.1132 | |||
| SHEN / Shenandoah Telecommunications Company | 0.00 | -5.82 | 0.04 | 0.00 | 0.5234 | 0.0237 | |||
| JXN / Jackson Financial Inc. | 0.00 | -5.86 | 0.04 | 0.00 | 0.5159 | 0.0107 | |||
| BFH / Bread Financial Holdings, Inc. | 0.00 | -5.91 | 0.04 | 5.26 | 0.5099 | 0.0457 | |||
| RUN / Sunrun Inc. | 0.00 | -5.81 | 0.04 | 33.33 | 0.5059 | 0.1300 | |||
| PTEN / Patterson-UTI Energy, Inc. | 0.01 | -5.81 | 0.04 | -32.20 | 0.5056 | -0.2214 | |||
| GNL / Global Net Lease, Inc. | 0.01 | -5.81 | 0.04 | -11.11 | 0.5051 | -0.0528 | |||
| ASTE / Astec Industries, Inc. | 0.00 | -5.85 | 0.04 | 14.29 | 0.5021 | 0.0715 | |||
| ENOV / Enovis Corporation | 0.00 | -5.77 | 0.04 | -23.53 | 0.4981 | -0.1312 | |||
| SAFE / Safehold Inc. | 0.00 | -5.83 | 0.04 | -22.45 | 0.4856 | -0.1205 | |||
| CCS / Century Communities, Inc. | 0.00 | -5.87 | 0.04 | -22.45 | 0.4845 | -0.1146 | |||
| JBGS / JBG SMITH Properties | 0.00 | -5.81 | 0.04 | 0.00 | 0.4825 | 0.0164 | |||
| REZI / Resideo Technologies, Inc. | 0.00 | -5.85 | 0.04 | 18.75 | 0.4739 | 0.0793 | |||
| VTOL / Bristow Group Inc. | 0.00 | -5.85 | 0.04 | -2.63 | 0.4698 | 0.0028 | |||
| HOPE / Hope Bancorp, Inc. | 0.00 | -5.80 | 0.04 | -2.70 | 0.4542 | -0.0055 | |||
| DLX / Deluxe Corporation | 0.00 | -5.81 | 0.04 | -5.26 | 0.4536 | -0.0140 | |||
| ALGT / Allegiant Travel Company | 0.00 | -5.85 | 0.04 | 0.00 | 0.4522 | 0.0111 | |||
| TGNA / TEGNA Inc. | 0.00 | -5.80 | 0.04 | -12.20 | 0.4516 | -0.0576 | |||
| BLMN / Bloomin' Brands, Inc. | 0.00 | -5.81 | 0.04 | 16.13 | 0.4505 | 0.0613 | |||
| SXC / SunCoke Energy, Inc. | 0.00 | -5.81 | 0.04 | -12.50 | 0.4446 | -0.0493 | |||
| THS / TreeHouse Foods, Inc. | 0.00 | -5.81 | 0.03 | -33.33 | 0.4317 | -0.1930 | |||
| PSMT / PriceSmart, Inc. | 0.00 | -5.75 | 0.03 | 13.33 | 0.4295 | 0.0571 | |||
| CAL / Caleres, Inc. | 0.00 | -5.79 | 0.03 | -33.33 | 0.4266 | -0.1972 | |||
| ARI / Apollo Commercial Real Estate Finance, Inc. | 0.00 | -5.82 | 0.03 | -2.86 | 0.4255 | -0.0109 | |||
| ARR / ARMOUR Residential REIT, Inc. | 0.00 | -5.81 | 0.03 | -5.56 | 0.4250 | -0.0234 | |||
| EFC / Ellington Financial Inc. | 0.00 | -5.81 | 0.03 | -8.33 | 0.4199 | -0.0247 | |||
| LPG / Dorian LPG Ltd. | 0.00 | -5.81 | 0.03 | 3.13 | 0.4192 | 0.0208 | |||
| RWT / Redwood Trust, Inc. | 0.01 | -5.81 | 0.03 | -8.33 | 0.4178 | -0.0273 | |||
| HTH / Hilltop Holdings Inc. | 0.00 | -5.75 | 0.03 | -5.71 | 0.4155 | -0.0166 | |||
| GO / Grocery Outlet Holding Corp. | 0.00 | -5.81 | 0.03 | -15.38 | 0.4119 | -0.0690 | |||
| VSH / Vishay Intertechnology, Inc. | 0.00 | -5.85 | 0.03 | -8.57 | 0.4112 | -0.0160 | |||
| ASO / Academy Sports and Outdoors, Inc. | 0.00 | -5.86 | 0.03 | -8.57 | 0.4039 | -0.0228 | |||
| RNST / Renasant Corporation | 0.00 | -5.88 | 0.03 | 0.00 | 0.3942 | 0.0078 | |||
| DE000C4SA6R6 / EURO STOXX 50 Index | 0.03 | 0.3891 | 0.3891 | ||||||
| PCRX / Pacira BioSciences, Inc. | 0.00 | -5.85 | 0.03 | -9.09 | 0.3835 | -0.0303 | |||
| EPC / Edgewell Personal Care Company | 0.00 | -5.77 | 0.03 | -30.23 | 0.3815 | -0.1458 | |||
| PUMP / ProPetro Holding Corp. | 0.01 | -5.81 | 0.03 | -23.08 | 0.3779 | -0.1047 | |||
| UPBD / Upbound Group, Inc. | 0.00 | -5.81 | 0.03 | -3.33 | 0.3702 | 0.0036 | |||
| SNCY / Sun Country Airlines Holdings, Inc. | 0.00 | -5.82 | 0.03 | -12.12 | 0.3699 | -0.0324 | |||
| FMC / FMC Corporation | 0.00 | -5.86 | 0.03 | -6.45 | 0.3680 | -0.0180 | |||
| REX / REX American Resources Corporation | 0.00 | -5.80 | 0.03 | 26.09 | 0.3650 | 0.0730 | |||
| CFFN / Capitol Federal Financial, Inc. | 0.00 | -5.81 | 0.03 | 0.00 | 0.3611 | 0.0172 | |||
| MDU / MDU Resources Group, Inc. | 0.00 | -5.81 | 0.03 | -6.67 | 0.3569 | -0.0187 | |||
| CENTA / Central Garden & Pet Company | 0.00 | -5.83 | 0.03 | -9.68 | 0.3527 | -0.0301 | |||
| EGBN / Eagle Bancorp, Inc. | 0.00 | -5.78 | 0.03 | -12.90 | 0.3407 | -0.0402 | |||
| FOXF / Fox Factory Holding Corp. | 0.00 | -5.82 | 0.03 | 3.85 | 0.3399 | 0.0226 | |||
| USNA / USANA Health Sciences, Inc. | 0.00 | -5.84 | 0.03 | 8.00 | 0.3372 | 0.0281 | |||
| HMN / Horace Mann Educators Corporation | 0.00 | -5.92 | 0.03 | -7.14 | 0.3322 | -0.0109 | |||
| WGO / Winnebago Industries, Inc. | 0.00 | -5.78 | 0.03 | -21.87 | 0.3182 | -0.0739 | |||
| BRKL / Brookline Bancorp, Inc. | 0.00 | -5.79 | 0.02 | -11.11 | 0.3084 | -0.0220 | |||
| MATW / Matthews International Corporation | 0.00 | -5.83 | 0.02 | 0.00 | 0.2987 | 0.0104 | |||
| FBRT / Franklin BSP Realty Trust, Inc. | 0.00 | -5.81 | 0.02 | -23.33 | 0.2984 | -0.0705 | |||
| SIG / Signet Jewelers Limited | 0.00 | -5.71 | 0.02 | 27.78 | 0.2946 | 0.0718 | |||
| MNRO / Monro, Inc. | 0.00 | -5.79 | 0.02 | -4.17 | 0.2905 | -0.0019 | |||
| STC / Stewart Information Services Corporation | 0.00 | -5.84 | 0.02 | -11.54 | 0.2881 | -0.0395 | |||
| SFNC / Simmons First National Corporation | 0.00 | -5.81 | 0.02 | -11.54 | 0.2874 | -0.0354 | |||
| NWL / Newell Brands Inc. | 0.00 | -5.82 | 0.02 | -17.86 | 0.2874 | -0.0549 | |||
| KREF / KKR Real Estate Finance Trust Inc. | 0.00 | -5.80 | 0.02 | -24.14 | 0.2805 | -0.0778 | |||
| SCL / Stepan Company | 0.00 | -5.99 | 0.02 | -4.35 | 0.2776 | -0.0133 | |||
| HTLD / Heartland Express, Inc. | 0.00 | -5.82 | 0.02 | -12.50 | 0.2668 | -0.0286 | |||
| NSIT / Insight Enterprises, Inc. | 0.00 | -5.52 | 0.02 | -12.50 | 0.2651 | -0.0327 | |||
| ECPG / Encore Capital Group, Inc. | 0.00 | -5.85 | 0.02 | 10.53 | 0.2640 | 0.0214 | |||
| MGPI / MGP Ingredients, Inc. | 0.00 | -5.88 | 0.02 | -4.76 | 0.2571 | -0.0045 | |||
| RC / Ready Capital Corporation | 0.00 | -5.81 | 0.02 | -20.00 | 0.2526 | -0.0526 | |||
| ARCB / ArcBest Corporation | 0.00 | -5.76 | 0.02 | 5.26 | 0.2516 | 0.0125 | |||
| AMWD / American Woodmark Corporation | 0.00 | -5.82 | 0.02 | -17.39 | 0.2475 | -0.0355 | |||
| SCVL / Shoe Carnival, Inc. | 0.00 | -5.80 | 0.02 | -20.83 | 0.2426 | -0.0531 | |||
| CC / The Chemours Company | 0.00 | -5.77 | 0.02 | -20.83 | 0.2424 | -0.0546 | |||
| HELE / Helen of Troy Limited | 0.00 | -5.83 | 0.02 | -50.00 | 0.2399 | -0.2292 | |||
| MTH / Meritage Homes Corporation | 0.00 | -5.96 | 0.02 | -9.52 | 0.2371 | -0.0236 | |||
| XRX / Xerox Holdings Corporation | 0.00 | -5.81 | 0.02 | 0.00 | 0.2182 | 0.0107 | |||
| MBC / MasterBrand, Inc. | 0.00 | -5.76 | 0.02 | -20.00 | 0.2050 | -0.0490 | |||
| NEOG / Neogen Corporation | 0.00 | -5.80 | 0.01 | -50.00 | 0.1703 | -0.1501 | |||
| Barclays Capital, Inc. / RA (N/A) | 0.01 | 0.1679 | 0.1679 | ||||||
| LGIH / LGI Homes, Inc. | 0.00 | -5.80 | 0.01 | -27.78 | 0.1670 | -0.0565 | |||
| BofA Securities, Inc. / RA (N/A) | 0.01 | 0.1621 | 0.1621 | ||||||
| FTRE / Fortrea Holdings Inc. | 0.00 | -5.79 | 0.01 | -40.00 | 0.1223 | -0.0716 | |||
| CENT / Central Garden & Pet Company | 0.00 | -5.68 | 0.01 | -16.67 | 0.0728 | -0.0058 |