Mga Batayang Estadistika
| Nilai Portofolio | $ 43,520 |
| Posisi Saat Ini | 43 |
Kepemilikan Terbaru, Kinerja, AUM (dari 13F, 13D)
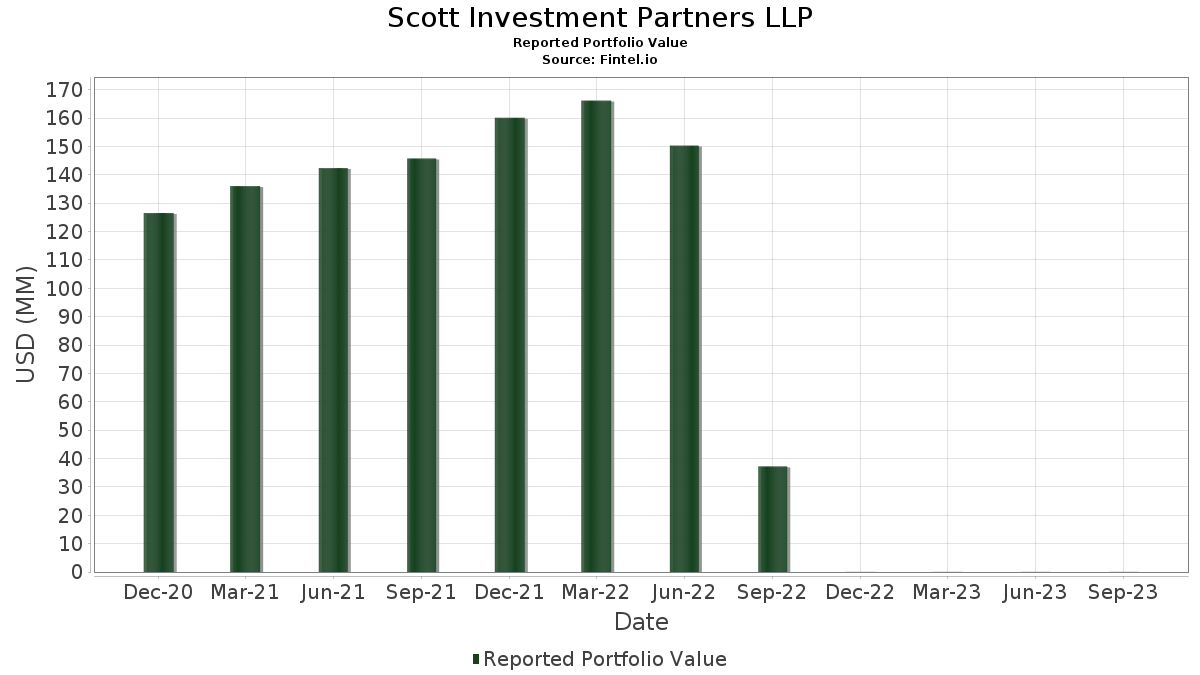
Scott Investment Partners LLP telah mengungkapkan total kepemilikan 43 dalam pengajuan SEC terbaru mereka. Nilai portofolio terbaru dihitung sebesar $ 43,520 USD. Aset yang Dikelola (AUM) sebenarnya adalah nilai ini ditambah kas (yang tidak diungkapkan). Aset-aset utama Scott Investment Partners LLP adalah Exxon Mobil Corporation (US:XOM) , Microsoft Corporation (US:MSFT) , UnitedHealth Group Incorporated (US:UNH) , EOG Resources, Inc. (US:EOG) , and The TJX Companies, Inc. (US:TJX) .
Peningkatan Tertinggi Kuartal Ini
Kami menggunakan perubahan dalam alokasi portofolio karena ini adalah metrik yang paling bermakna. Perubahan dapat disebabkan oleh perdagangan atau perubahan harga saham.
| Keamanan | Saham (MM) |
Nilai (Juta Dolar AS) |
Portfolio % | ΔPorsyento ng Portfolio |
|---|---|---|---|---|
| 0.01 | 0.00 | 1.9922 | 1.1985 | |
| 0.02 | 0.00 | 4.9173 | 0.5286 | |
| 0.02 | 0.00 | 2.5712 | 0.4511 | |
| 0.01 | 0.00 | 2.0818 | 0.4405 | |
| 0.01 | 0.00 | 3.6994 | 0.4327 | |
| 0.00 | 0.00 | 2.8355 | 0.4073 | |
| 0.00 | 0.00 | 1.9761 | 0.3798 | |
| 0.01 | 0.00 | 2.2013 | 0.3532 | |
| 0.00 | 0.00 | 4.0556 | 0.2740 | |
| 0.02 | 0.00 | 3.3709 | 0.2255 |
Penurunan Tertinggi Kuartal Ini
Kami menggunakan perubahan dalam alokasi portofolio karena ini adalah metrik yang paling bermakna. Perubahan dapat disebabkan oleh perdagangan atau perubahan harga saham.
| Keamanan | Saham (MM) |
Nilai (Juta Dolar AS) |
Portfolio % | ΔPorsyento ng Portfolio |
|---|---|---|---|---|
| 0.01 | 0.00 | 2.4472 | -0.7792 | |
| 0.01 | 0.00 | 1.9187 | -0.6354 | |
| 0.01 | 0.00 | 1.9922 | -0.5664 | |
| 0.01 | 0.00 | 1.3764 | -0.4245 | |
| 0.00 | 0.00 | 2.7528 | -0.4218 | |
| 0.01 | 0.00 | 2.1530 | -0.2796 | |
| 0.01 | 0.00 | 4.8621 | -0.2685 | |
| 0.00 | 0.00 | 1.5349 | -0.2345 | |
| 0.00 | 0.00 | 2.3851 | -0.2207 | |
| 0.01 | 0.00 | 2.1599 | -0.2165 |
Pengajuan 13F dan Dana
Formulir ini diajukan pada 2023-11-01 untuk periode pelaporan 2023-09-30. Klik ikon tautan untuk melihat riwayat transaksi selengkapnya.
Tingkatkan ke versi premium untuk membuka data premium dan ekspor ke Excel. ![]() .
.
| Keamanan | Ketik | Harga Saham Rata-rata | Saham (MM) |
ΔSaham (%) |
ΔSaham (%) |
Nilai ($MM) |
Portpolyo (%) |
ΔPortofolio (%) |
|
|---|---|---|---|---|---|---|---|---|---|
| XOM / Exxon Mobil Corporation | 0.02 | 0.00 | 0.00 | 100.00 | 4.9173 | 0.5286 | |||
| MSFT / Microsoft Corporation | 0.01 | 0.00 | 0.00 | 0.00 | 4.8621 | -0.2685 | |||
| UNH / UnitedHealth Group Incorporated | 0.00 | 0.00 | 0.00 | 0.00 | 4.0556 | 0.2740 | |||
| EOG / EOG Resources, Inc. | 0.01 | 0.00 | 0.00 | 0.00 | 3.6994 | 0.4327 | |||
| TJX / The TJX Companies, Inc. | 0.02 | 0.00 | 0.00 | 0.00 | 3.3709 | 0.2255 | |||
| FAST / Fastenal Company | 0.02 | 0.00 | 0.00 | 0.00 | 2.9389 | -0.1638 | |||
| BKNG / Booking Holdings Inc. | 0.00 | 0.00 | 0.00 | 0.00 | 2.8355 | 0.4073 | |||
| APH / Amphenol Corporation | 0.01 | 0.00 | 0.00 | 0.00 | 2.7780 | 0.0284 | |||
| ULTA / Ulta Beauty, Inc. | 0.00 | 0.00 | 0.00 | 0.00 | 2.7528 | -0.4218 | |||
| LIN / Linde plc | 0.00 | 0.00 | 0.00 | 0.00 | 2.6517 | -0.0036 | |||
| SLB / Schlumberger Limited | 0.02 | 0.00 | 0.00 | 2.5712 | 0.4511 | ||||
| JBHT / J.B. Hunt Transport Services, Inc. | 0.01 | 0.00 | 0.00 | 0.00 | 2.4701 | 0.1499 | |||
| ECL / Ecolab Inc. | 0.01 | 0.00 | 0.00 | 0.00 | 2.4517 | -0.1923 | |||
| DLTR / Dollar Tree, Inc. | 0.01 | 0.00 | 0.00 | 0.00 | 2.4472 | -0.7792 | |||
| CTSH / Cognizant Technology Solutions Corporation | 0.02 | 0.00 | 0.00 | 0.00 | 2.4127 | 0.1374 | |||
| SYK / Stryker Corporation | 0.00 | 0.00 | 0.00 | 0.00 | 2.3851 | -0.2207 | |||
| FLT / Corpay, Inc. | 0.00 | 0.00 | 0.00 | 0.00 | 2.3460 | 0.0888 | |||
| ADI / Analog Devices, Inc. | 0.01 | 0.00 | 0.00 | 0.00 | 2.3346 | -0.2060 | |||
| STZ / Constellation Brands, Inc. | 0.00 | 0.00 | 0.00 | 2.3093 | 0.0947 | ||||
| GILD / Gilead Sciences, Inc. | 0.01 | 0.00 | 0.00 | 2.2036 | -0.0132 | ||||
| LHX / L3Harris Technologies, Inc. | 0.01 | 30.95 | 0.00 | 2.2013 | 0.3532 | ||||
| MDT / Medtronic plc | 0.01 | 0.00 | 0.00 | -100.00 | 2.1599 | -0.2165 | |||
| NKE / NIKE, Inc. | 0.01 | 0.00 | 0.00 | -100.00 | 2.1530 | -0.2796 | |||
| FDX / FedEx Corporation | 0.00 | 0.00 | 0.00 | 2.1301 | 0.1785 | ||||
| HSIC / Henry Schein, Inc. | 0.01 | 35.56 | 0.00 | 2.0818 | 0.4405 | ||||
| EL / The Estée Lauder Companies Inc. | 0.01 | 233.33 | 0.00 | 1.9922 | 1.1985 | ||||
| ALB / Albemarle Corporation | 0.01 | 0.00 | 0.00 | -100.00 | 1.9922 | -0.5664 | |||
| AMGN / Amgen Inc. | 0.00 | 0.00 | 0.00 | 1.9761 | 0.3798 | ||||
| EA / Electronic Arts Inc. | 0.01 | 0.00 | 0.00 | 1.9646 | -0.1061 | ||||
| RTX / RTX Corporation | 0.01 | 0.00 | 0.00 | -100.00 | 1.9187 | -0.6354 | |||
| A / Agilent Technologies, Inc. | 0.01 | 0.00 | 0.00 | 1.9003 | -0.1007 | ||||
| BMY / Bristol-Myers Squibb Company | 0.01 | 0.00 | 0.00 | 1.8681 | -0.1441 | ||||
| CPRT / Copart, Inc. | 0.02 | 100.00 | 0.00 | 1.8612 | -0.0656 | ||||
| ABT / Abbott Laboratories | 0.01 | 0.00 | 0.00 | 1.8474 | -0.1873 | ||||
| BIIB / Biogen Inc. | 0.00 | 0.00 | 0.00 | 1.8313 | -0.1539 | ||||
| HAS / Hasbro, Inc. | 0.01 | 0.00 | 0.00 | 1.8244 | 0.0775 | ||||
| PAYX / Paychex, Inc. | 0.01 | 0.00 | 0.00 | 1.8015 | 0.0905 | ||||
| INTC / Intel Corporation | 0.02 | 0.00 | 0.00 | 1.6337 | 0.1296 | ||||
| PYPL / PayPal Holdings, Inc. | 0.01 | 0.00 | 0.00 | 1.5441 | -0.1803 | ||||
| LFUS / Littelfuse, Inc. | 0.00 | 0.00 | 0.00 | 1.5349 | -0.2345 | ||||
| IPGP / IPG Photonics Corporation | 0.01 | 0.00 | 0.00 | 1.3764 | -0.4245 | ||||
| HRL / Hormel Foods Corporation | 0.01 | 0.00 | 0.00 | 0.9605 | -0.0333 | ||||
| MMS / Maximus, Inc. | 0.00 | 0.00 | 0.00 | 0.6526 | -0.0691 |