Mga Batayang Estadistika
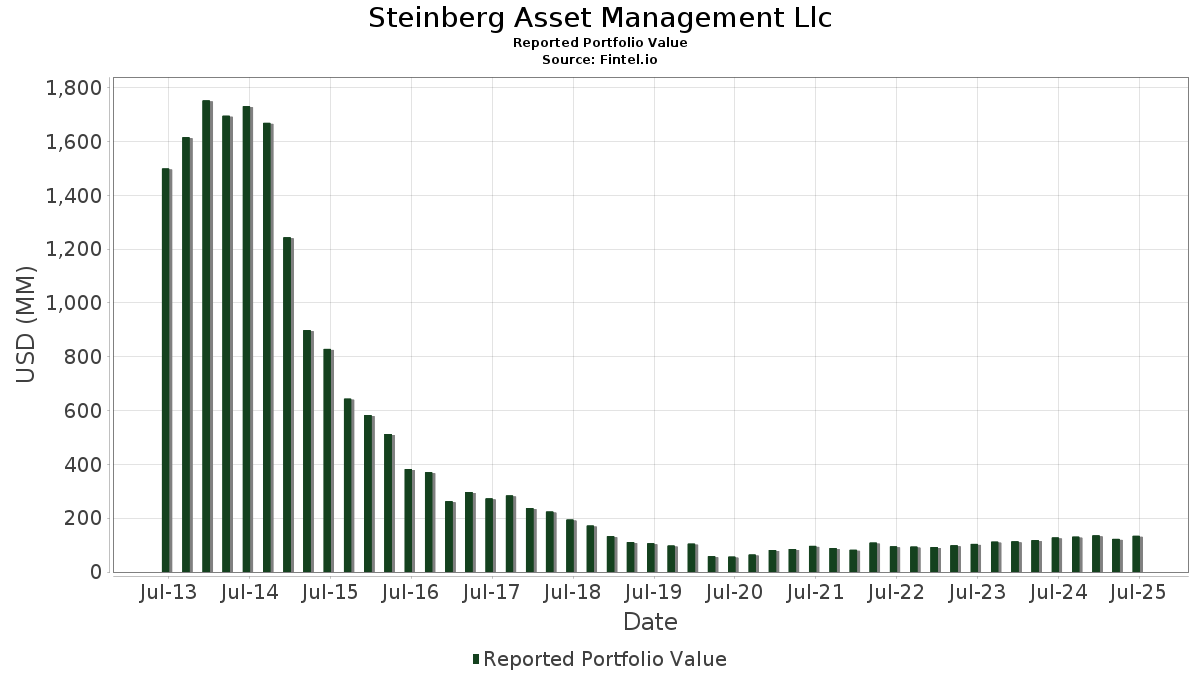
| Nilai Portofolio | $ 134,193,223 |
| Posisi Saat Ini | 37 |
Kepemilikan Terbaru, Kinerja, AUM (dari 13F, 13D)
Steinberg Asset Management Llc telah mengungkapkan total kepemilikan 37 dalam pengajuan SEC terbaru mereka. Nilai portofolio terbaru dihitung sebesar $ 134,193,223 USD. Aset yang Dikelola (AUM) sebenarnya adalah nilai ini ditambah kas (yang tidak diungkapkan). Aset-aset utama Steinberg Asset Management Llc adalah Golar LNG Limited (US:GLNG) , Navigator Holdings Ltd. (US:NVGS) , Arch Capital Group Ltd. (US:ACGL) , Alphabet Inc. (US:GOOG) , and Madison Square Garden Sports Corp. (US:MSGS) . Posisi baru Steinberg Asset Management Llc meliputi: Primo Brands Corporation (US:PRMB) , Uber Technologies, Inc. (US:UBER) , .
Peningkatan Tertinggi Kuartal Ini
Kami menggunakan perubahan dalam alokasi portofolio karena ini adalah metrik yang paling bermakna. Perubahan dapat disebabkan oleh perdagangan atau perubahan harga saham.
| Keamanan | Saham (MM) |
Nilai (Juta Dolar AS) |
Portfolio % | ΔPorsyento ng Portfolio |
|---|---|---|---|---|
| 0.10 | 2.90 | 2.1600 | 2.1600 | |
| 0.02 | 1.45 | 1.0829 | 1.0829 | |
| 0.03 | 6.13 | 4.5709 | 0.6613 | |
| 0.03 | 4.63 | 3.4518 | 0.5336 | |
| 0.11 | 1.69 | 1.2559 | 0.4968 | |
| 0.03 | 2.96 | 2.2056 | 0.4254 | |
| 0.02 | 2.23 | 1.6619 | 0.4116 | |
| 0.10 | 3.32 | 2.4769 | 0.3209 | |
| 0.00 | 0.28 | 0.2067 | 0.2067 | |
| 0.03 | 3.33 | 2.4822 | 0.1792 |
Penurunan Tertinggi Kuartal Ini
Kami menggunakan perubahan dalam alokasi portofolio karena ini adalah metrik yang paling bermakna. Perubahan dapat disebabkan oleh perdagangan atau perubahan harga saham.
| Keamanan | Saham (MM) |
Nilai (Juta Dolar AS) |
Portfolio % | ΔPorsyento ng Portfolio |
|---|---|---|---|---|
| 1.39 | 57.27 | 42.6736 | -1.4053 | |
| 0.08 | 6.93 | 5.1626 | -0.9284 | |
| 0.64 | 9.06 | 6.7479 | -0.4564 | |
| 0.01 | 2.44 | 1.8190 | -0.4221 | |
| 0.01 | 2.01 | 1.5001 | -0.3337 | |
| 0.03 | 1.34 | 0.9966 | -0.2888 | |
| 0.01 | 1.08 | 0.8018 | -0.2884 | |
| 0.01 | 1.22 | 0.9096 | -0.2795 | |
| 0.00 | 0.36 | 0.2648 | -0.2425 | |
| 0.00 | 1.43 | 1.0689 | -0.1806 |
Pengajuan 13F dan Dana
Formulir ini diajukan pada 2025-08-14 untuk periode pelaporan 2025-06-30. Klik ikon tautan untuk melihat riwayat transaksi selengkapnya.
Tingkatkan ke versi premium untuk membuka data premium dan ekspor ke Excel. ![]() .
.
| Keamanan | Ketik | Harga Saham Rata-rata | Saham (MM) |
ΔSaham (%) |
ΔSaham (%) |
Nilai ($MM) |
Portpolyo (%) |
ΔPortofolio (%) |
|
|---|---|---|---|---|---|---|---|---|---|
| GLNG / Golar LNG Limited | 1.39 | -2.49 | 57.27 | 5.72 | 42.6736 | -1.4053 | |||
| NVGS / Navigator Holdings Ltd. | 0.64 | -3.42 | 9.06 | 2.29 | 6.7479 | -0.4564 | |||
| ACGL / Arch Capital Group Ltd. | 0.08 | -2.23 | 6.93 | -7.44 | 5.1626 | -0.9284 | |||
| GOOG / Alphabet Inc. | 0.03 | 12.45 | 6.13 | 27.66 | 4.5709 | 0.6613 | |||
| MSGS / Madison Square Garden Sports Corp. | 0.03 | -0.54 | 5.48 | 6.74 | 4.0845 | -0.0947 | |||
| IQV / IQVIA Holdings Inc. | 0.03 | 44.51 | 4.63 | 29.21 | 3.4518 | 0.5336 | |||
| ACM / AECOM | 0.03 | -3.29 | 3.33 | 17.71 | 2.4822 | 0.1792 | |||
| BEPC / Brookfield Renewable Corporation | 0.10 | 7.05 | 3.32 | 25.44 | 2.4769 | 0.3209 | |||
| DG / Dollar General Corporation | 0.03 | 4.01 | 2.96 | 35.30 | 2.2056 | 0.4254 | |||
| PRMB / Primo Brands Corporation | 0.10 | 2.90 | 2.1600 | 2.1600 | |||||
| BRK.B / Berkshire Hathaway Inc. | 0.01 | -2.82 | 2.44 | -11.37 | 1.8190 | -0.4221 | |||
| IBM / International Business Machines Corporation | 0.01 | -5.68 | 2.29 | 11.83 | 1.7046 | 0.0398 | |||
| CRM / Salesforce, Inc. | 0.01 | 6.44 | 2.28 | 8.32 | 1.6990 | -0.0139 | |||
| VC / Visteon Corporation | 0.02 | 20.76 | 2.23 | 45.18 | 1.6619 | 0.4116 | |||
| TMUS / T-Mobile US, Inc. | 0.01 | 0.00 | 2.01 | -10.65 | 1.5001 | -0.3337 | |||
| BKNG / Booking Holdings Inc. | 0.00 | -18.75 | 1.96 | 2.09 | 1.4582 | -0.1014 | |||
| FRSH / Freshworks Inc. | 0.11 | 70.98 | 1.69 | 80.79 | 1.2559 | 0.4968 | |||
| HCA / HCA Healthcare, Inc. | 0.00 | 2.58 | 1.58 | 13.79 | 1.1805 | 0.0469 | |||
| UBER / Uber Technologies, Inc. | 0.02 | 1.45 | 1.0829 | 1.0829 | |||||
| GHC / Graham Holdings Company | 0.00 | -5.13 | 1.43 | -6.58 | 1.0689 | -0.1806 | |||
| FLEX / Flex Ltd. | 0.03 | -43.89 | 1.34 | -15.33 | 0.9966 | -0.2888 | |||
| VSAT / Viasat, Inc. | 0.09 | -4.14 | 1.25 | 34.37 | 0.9326 | 0.1744 | |||
| ABBV / AbbVie Inc. | 0.01 | -5.71 | 1.22 | -16.50 | 0.9096 | -0.2795 | |||
| MA / Mastercard Incorporated | 0.00 | 0.00 | 1.10 | 2.51 | 0.8233 | -0.0537 | |||
| HSIC / Henry Schein, Inc. | 0.01 | -24.70 | 1.08 | -19.72 | 0.8018 | -0.2884 | |||
| HON / Honeywell International Inc. | 0.00 | -5.59 | 0.98 | 3.82 | 0.7297 | -0.0378 | |||
| FDX / FedEx Corporation | 0.00 | -4.83 | 0.94 | -11.23 | 0.7018 | -0.1612 | |||
| SPY / SPDR S&P 500 ETF | 0.00 | 14.02 | 0.88 | 25.93 | 0.6552 | 0.0871 | |||
| DD / DuPont de Nemours, Inc. | 0.01 | -7.70 | 0.77 | -15.29 | 0.5745 | -0.1655 | |||
| OSK / Oshkosh Corporation | 0.01 | -5.07 | 0.66 | 14.48 | 0.4954 | 0.0232 | |||
| HST / Host Hotels & Resorts, Inc. | 0.03 | -5.92 | 0.45 | 1.60 | 0.3317 | -0.0249 | |||
| CB / Chubb Limited | 0.00 | 0.00 | 0.44 | -3.96 | 0.3249 | -0.0448 | |||
| ROK / Rockwell Automation, Inc. | 0.00 | 0.00 | 0.41 | 28.89 | 0.3027 | 0.0456 | |||
| PK / Park Hotels & Resorts Inc. | 0.04 | -5.08 | 0.39 | -8.98 | 0.2869 | -0.0574 | |||
| C / Citigroup Inc. | 0.00 | -52.46 | 0.36 | -43.02 | 0.2648 | -0.2425 | |||
| UL / Unilever PLC - Depositary Receipt (Common Stock) | 0.00 | -5.12 | 0.29 | -2.71 | 0.2146 | -0.0259 | |||
| DELL / Dell Technologies Inc. | 0.00 | 0.28 | 0.2067 | 0.2067 | |||||
| XPEL / XPEL, Inc. | 0.00 | -100.00 | 0.00 | 0.0000 | |||||
| NFE / New Fortress Energy Inc. | 0.00 | -100.00 | 0.00 | 0.0000 | |||||
| LEA / Lear Corporation | 0.00 | -100.00 | 0.00 | 0.0000 |