Mga Batayang Estadistika
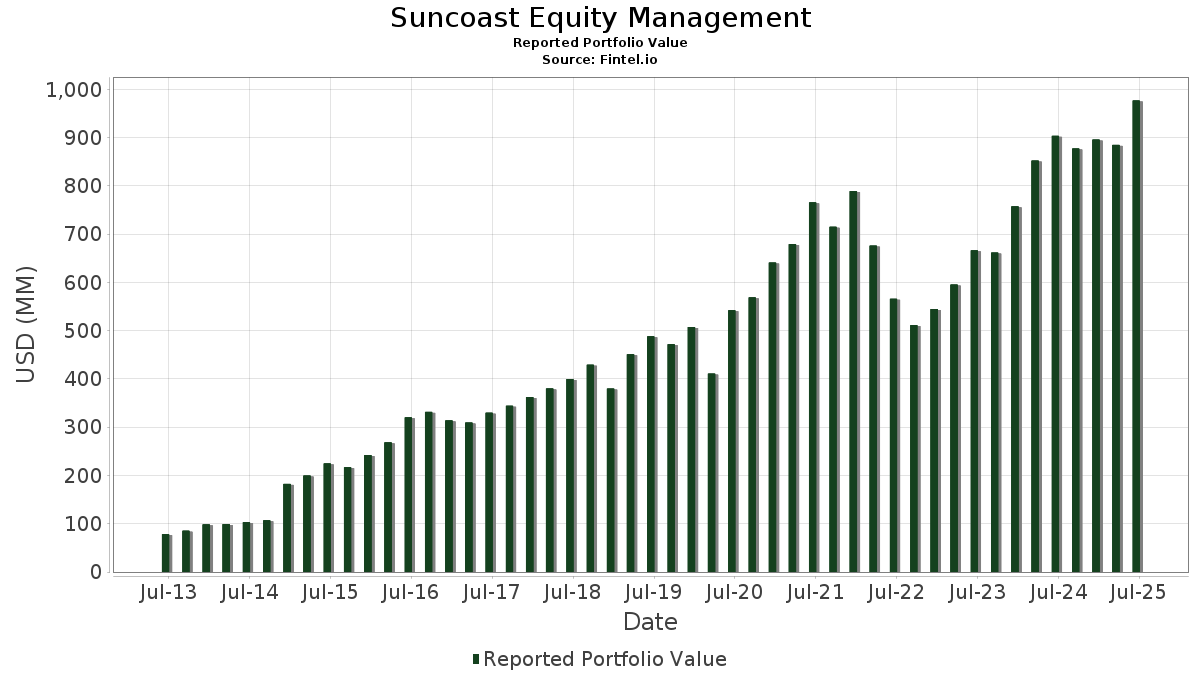
| Nilai Portofolio | $ 976,786,789 |
| Posisi Saat Ini | 85 |
Kepemilikan Terbaru, Kinerja, AUM (dari 13F, 13D)
Suncoast Equity Management telah mengungkapkan total kepemilikan 85 dalam pengajuan SEC terbaru mereka. Nilai portofolio terbaru dihitung sebesar $ 976,786,789 USD. Aset yang Dikelola (AUM) sebenarnya adalah nilai ini ditambah kas (yang tidak diungkapkan). Aset-aset utama Suncoast Equity Management adalah NVIDIA Corporation (US:NVDA) , Microsoft Corporation (US:MSFT) , Booking Holdings Inc. (US:BKNG) , Intuit Inc. (US:INTU) , and Visa Inc. (US:V) . Posisi baru Suncoast Equity Management meliputi: EA Series Trust - Suncoast Select Growth ETF (US:SEMG) , Monolithic Power Systems, Inc. (US:MPWR) , Huron Consulting Group Inc. (US:HURN) , iShares Bitcoin Trust ETF (US:IBIT) , and Broadcom Inc. (US:AVGO) .
Peningkatan Tertinggi Kuartal Ini
Kami menggunakan perubahan dalam alokasi portofolio karena ini adalah metrik yang paling bermakna. Perubahan dapat disebabkan oleh perdagangan atau perubahan harga saham.
| Keamanan | Saham (MM) |
Nilai (Juta Dolar AS) |
Portfolio % | ΔPorsyento ng Portfolio |
|---|---|---|---|---|
| 0.56 | 88.16 | 9.0258 | 2.1663 | |
| 0.18 | 87.33 | 8.9404 | 1.3905 | |
| 0.07 | 56.74 | 5.8093 | 0.7876 | |
| 0.01 | 63.43 | 6.4940 | 0.7865 | |
| 0.05 | 34.19 | 3.5005 | 0.5171 | |
| 0.07 | 24.69 | 2.5275 | 0.4038 | |
| 0.18 | 31.58 | 3.2328 | 0.2512 | |
| 0.08 | 3.48 | 0.3567 | 0.2216 | |
| 0.01 | 2.03 | 0.2080 | 0.2080 | |
| 0.01 | 4.14 | 0.4240 | 0.1857 |
Penurunan Tertinggi Kuartal Ini
Kami menggunakan perubahan dalam alokasi portofolio karena ini adalah metrik yang paling bermakna. Perubahan dapat disebabkan oleh perdagangan atau perubahan harga saham.
| Keamanan | Saham (MM) |
Nilai (Juta Dolar AS) |
Portfolio % | ΔPorsyento ng Portfolio |
|---|---|---|---|---|
| 0.22 | 37.35 | 3.8234 | -1.5987 | |
| 0.17 | 35.41 | 3.6254 | -0.9555 | |
| 0.13 | 38.16 | 3.9069 | -0.5955 | |
| 0.04 | 33.90 | 3.4702 | -0.5804 | |
| 0.05 | 23.37 | 2.3927 | -0.5178 | |
| 0.15 | 53.86 | 5.5137 | -0.4964 | |
| 0.13 | 36.37 | 3.7235 | -0.3369 | |
| 0.06 | 36.33 | 3.7190 | -0.3083 | |
| 0.10 | 31.22 | 3.1960 | -0.2945 | |
| 0.07 | 25.85 | 2.6463 | -0.2621 |
Pengajuan 13F dan Dana
Formulir ini diajukan pada 2025-08-11 untuk periode pelaporan 2025-06-30. Klik ikon tautan untuk melihat riwayat transaksi selengkapnya.
Tingkatkan ke versi premium untuk membuka data premium dan ekspor ke Excel. ![]() .
.
| Keamanan | Ketik | Harga Saham Rata-rata | Saham (MM) |
ΔSaham (%) |
ΔSaham (%) |
Nilai ($MM) |
Portpolyo (%) |
ΔPortofolio (%) |
|
|---|---|---|---|---|---|---|---|---|---|
| NVDA / NVIDIA Corporation | 0.56 | -0.36 | 88.16 | 45.24 | 9.0258 | 2.1663 | |||
| MSFT / Microsoft Corporation | 0.18 | -1.35 | 87.33 | 30.71 | 8.9404 | 1.3905 | |||
| BKNG / Booking Holdings Inc. | 0.01 | -0.05 | 63.43 | 25.60 | 6.4940 | 0.7865 | |||
| INTU / Intuit Inc. | 0.07 | -0.46 | 56.74 | 27.70 | 5.8093 | 0.7876 | |||
| V / Visa Inc. | 0.15 | -0.04 | 53.86 | 1.27 | 5.5137 | -0.4964 | |||
| SYK / Stryker Corporation | 0.12 | -0.03 | 49.09 | 6.25 | 5.0258 | -0.1957 | |||
| GOOG / Alphabet Inc. | 0.23 | -3.73 | 41.58 | 9.30 | 4.2565 | -0.0421 | |||
| ACN / Accenture plc | 0.13 | -0.00 | 38.16 | -4.21 | 3.9069 | -0.5955 | |||
| FI / Fiserv, Inc. | 0.22 | -0.30 | 37.35 | -22.16 | 3.8234 | -1.5987 | |||
| CRM / Salesforce, Inc. | 0.13 | -0.38 | 36.37 | 1.22 | 3.7235 | -0.3369 | |||
| MA / Mastercard Incorporated | 0.06 | -0.57 | 36.33 | 1.93 | 3.7190 | -0.3083 | |||
| AAPL / Apple Inc. | 0.17 | -5.42 | 35.41 | -12.64 | 3.6254 | -0.9555 | |||
| META / Meta Platforms, Inc. | 0.05 | 1.14 | 34.19 | 29.52 | 3.5005 | 0.5171 | |||
| LLY / Eli Lilly and Company | 0.04 | 0.19 | 33.90 | -5.43 | 3.4702 | -0.5804 | |||
| GOOGL / Alphabet Inc. | 0.18 | 5.02 | 31.58 | 19.69 | 3.2328 | 0.2512 | |||
| ADP / Automatic Data Processing, Inc. | 0.10 | 0.13 | 31.22 | 1.07 | 3.1960 | -0.2945 | |||
| GWW / W.W. Grainger, Inc. | 0.03 | 0.39 | 31.07 | 5.71 | 3.1810 | -0.1406 | |||
| ADBE / Adobe Inc. | 0.07 | -0.43 | 25.85 | 0.44 | 2.6463 | -0.2621 | |||
| ETN / Eaton Corporation plc | 0.07 | 0.03 | 24.69 | 31.38 | 2.5275 | 0.4038 | |||
| BRK.B / Berkshire Hathaway Inc. | 0.05 | -0.51 | 23.37 | -9.26 | 2.3927 | -0.5178 | |||
| MCK / McKesson Corporation | 0.03 | -0.43 | 21.43 | 8.42 | 2.1936 | -0.0397 | |||
| COR / Cencora, Inc. | 0.03 | 2.57 | 8.63 | 10.59 | 0.8833 | 0.0017 | |||
| BR / Broadridge Financial Solutions, Inc. | 0.03 | 2.72 | 6.83 | 2.97 | 0.6996 | -0.0504 | |||
| SHW / The Sherwin-Williams Company | 0.01 | 1.93 | 4.72 | 0.21 | 0.4836 | -0.0490 | |||
| TJX / The TJX Companies, Inc. | 0.04 | 0.19 | 4.70 | 1.58 | 0.4808 | -0.0417 | |||
| MMC / Marsh & McLennan Companies, Inc. | 0.02 | 1.77 | 4.39 | -8.83 | 0.4495 | -0.0946 | |||
| ROL / Rollins, Inc. | 0.08 | 2.35 | 4.34 | 6.87 | 0.4446 | -0.0146 | |||
| TT / Trane Technologies plc | 0.01 | 51.27 | 4.14 | 96.44 | 0.4240 | 0.1857 | |||
| FAST / Fastenal Company | 0.08 | 437.95 | 3.48 | 191.55 | 0.3567 | 0.2216 | |||
| CTAS / Cintas Corporation | 0.02 | 4.74 | 3.35 | 13.56 | 0.3430 | 0.0096 | |||
| IWF / iShares Trust - iShares Russell 1000 Growth ETF | 0.01 | 0.00 | 3.06 | 17.58 | 0.3130 | 0.0192 | |||
| TSCO / Tractor Supply Company | 0.05 | 1.92 | 2.64 | -2.40 | 0.2701 | -0.0354 | |||
| FICO / Fair Isaac Corporation | 0.00 | 7.57 | 2.41 | 6.63 | 0.2472 | -0.0087 | |||
| SPY / SPDR S&P 500 ETF | 0.00 | 11.28 | 2.26 | 22.89 | 0.2314 | 0.0236 | |||
| ITT / ITT Inc. | 0.01 | 3.60 | 2.21 | 25.87 | 0.2262 | 0.0277 | |||
| BRK.A / Berkshire Hathaway Inc. | 0.00 | 0.00 | 2.19 | -8.73 | 0.2238 | -0.0469 | |||
| PAYX / Paychex, Inc. | 0.01 | 2.03 | 0.2080 | 0.2080 | |||||
| ZTS / Zoetis Inc. | 0.01 | 3.96 | 1.91 | -1.55 | 0.1957 | -0.0237 | |||
| CPRT / Copart, Inc. | 0.04 | 4.63 | 1.83 | -9.27 | 0.1874 | -0.0406 | |||
| CPAY / Corpay, Inc. | 0.01 | 4.68 | 1.80 | -0.39 | 0.1840 | -0.0199 | |||
| NICE / NICE Ltd. - Depositary Receipt (Common Stock) | 0.01 | 4.37 | 1.46 | 14.34 | 0.1494 | 0.0052 | |||
| CHKP / Check Point Software Technologies Ltd. | 0.01 | 3.16 | 1.44 | 0.14 | 0.1478 | -0.0151 | |||
| BRO / Brown & Brown, Inc. | 0.01 | -32.66 | 1.37 | -40.00 | 0.1404 | -0.1179 | |||
| HUBB / Hubbell Incorporated | 0.00 | 3.99 | 1.32 | 28.33 | 0.1350 | 0.0189 | |||
| VEEV / Veeva Systems Inc. | 0.00 | 4.49 | 1.31 | 29.92 | 0.1338 | 0.0201 | |||
| MCD / McDonald's Corporation | 0.00 | 0.53 | 1.21 | -5.98 | 0.1239 | -0.0216 | |||
| CLS / Celestica Inc. | 0.01 | 7.06 | 1.16 | 111.88 | 0.1187 | 0.0569 | |||
| AMZN / Amazon.com, Inc. | 0.01 | 31.59 | 1.12 | 51.83 | 0.1146 | 0.0312 | |||
| G / Genpact Limited | 0.02 | 5.02 | 1.07 | -8.25 | 0.1093 | -0.0222 | |||
| ROP / Roper Technologies, Inc. | 0.00 | 3.66 | 1.06 | -0.38 | 0.1084 | -0.0117 | |||
| STE / STERIS plc | 0.00 | 4.98 | 1.05 | 11.26 | 0.1073 | 0.0009 | |||
| EW / Edwards Lifesciences Corporation | 0.01 | 4.20 | 1.04 | 12.45 | 0.1064 | 0.0019 | |||
| IDXX / IDEXX Laboratories, Inc. | 0.00 | 3.60 | 0.99 | 32.31 | 0.1011 | 0.0168 | |||
| SEMG / EA Series Trust - Suncoast Select Growth ETF | 0.04 | 0.93 | 0.0952 | 0.0952 | |||||
| USFD / US Foods Holding Corp. | 0.01 | 3.26 | 0.87 | 21.49 | 0.0887 | 0.0081 | |||
| MPWR / Monolithic Power Systems, Inc. | 0.00 | 0.78 | 0.0802 | 0.0802 | |||||
| HURN / Huron Consulting Group Inc. | 0.01 | 0.77 | 0.0784 | 0.0784 | |||||
| YELP / Yelp Inc. | 0.02 | 3.81 | 0.76 | -3.94 | 0.0773 | -0.0115 | |||
| MTD / Mettler-Toledo International Inc. | 0.00 | 5.12 | 0.72 | 4.48 | 0.0741 | -0.0041 | |||
| NTAP / NetApp, Inc. | 0.01 | 4.08 | 0.71 | 26.12 | 0.0723 | 0.0091 | |||
| PLTR / Palantir Technologies Inc. | 0.01 | 0.00 | 0.68 | 61.37 | 0.0698 | 0.0221 | |||
| HD / The Home Depot, Inc. | 0.00 | -0.26 | 0.57 | -0.18 | 0.0579 | -0.0062 | |||
| FDX / FedEx Corporation | 0.00 | -9.54 | 0.47 | -15.61 | 0.0477 | -0.0147 | |||
| WMT / Walmart Inc. | 0.00 | 0.07 | 0.45 | 11.63 | 0.0462 | 0.0004 | |||
| QQQ / Invesco QQQ Trust, Series 1 | 0.00 | 5.54 | 0.43 | 24.28 | 0.0441 | 0.0049 | |||
| TXN / Texas Instruments Incorporated | 0.00 | 0.00 | 0.43 | 15.49 | 0.0435 | 0.0019 | |||
| VOO / Vanguard Index Funds - Vanguard S&P 500 ETF | 0.00 | 0.00 | 0.41 | 10.51 | 0.0420 | 0.0001 | |||
| ETHE / Grayscale Ethereum Trust | 0.02 | 0.00 | 0.41 | 37.16 | 0.0416 | 0.0081 | |||
| HIG / The Hartford Insurance Group, Inc. | 0.00 | 0.00 | 0.36 | 2.56 | 0.0369 | -0.0028 | |||
| IBIT / iShares Bitcoin Trust ETF | 0.01 | 0.34 | 0.0344 | 0.0344 | |||||
| VIG / Vanguard Specialized Funds - Vanguard Dividend Appreciation ETF | 0.00 | 0.00 | 0.30 | 5.67 | 0.0305 | -0.0014 | |||
| JNJ / Johnson & Johnson | 0.00 | 0.22 | 0.28 | -7.69 | 0.0283 | -0.0055 | |||
| HCI / HCI Group, Inc. | 0.00 | 0.00 | 0.27 | 1.87 | 0.0280 | -0.0023 | |||
| UPS / United Parcel Service, Inc. | 0.00 | 0.00 | 0.27 | -8.25 | 0.0274 | -0.0056 | |||
| DNP / DNP Select Income Fund Inc. | 0.03 | 1.36 | 0.27 | 0.38 | 0.0272 | -0.0027 | |||
| DHI / D.R. Horton, Inc. | 0.00 | 0.00 | 0.26 | 1.54 | 0.0270 | -0.0024 | |||
| TSLA / Tesla, Inc. | 0.00 | -0.12 | 0.26 | 22.49 | 0.0263 | 0.0026 | |||
| PEP / PepsiCo, Inc. | 0.00 | -87.93 | 0.24 | -89.39 | 0.0250 | -0.2349 | |||
| HURA / TuHURA Biosciences, Inc. | 0.10 | 4.41 | 0.23 | -27.95 | 0.0238 | -0.0127 | |||
| SOUN / SoundHound AI, Inc. | 0.02 | 0.00 | 0.22 | 32.74 | 0.0228 | 0.0038 | |||
| AVGO / Broadcom Inc. | 0.00 | 0.21 | 0.0216 | 0.0216 | |||||
| MIRA / MIRA Pharmaceuticals, Inc. | 0.10 | 0.00 | 0.12 | 22.77 | 0.0128 | 0.0014 | |||
| HIO / Western Asset High Income Opportunity Fund Inc. | 0.02 | 2.75 | 0.07 | 2.94 | 0.0072 | -0.0005 | |||
| TELO / Telomir Pharmaceuticals, Inc. | 0.05 | 0.00 | 0.06 | -61.82 | 0.0066 | -0.0121 | |||
| PNBK / Patriot National Bancorp, Inc. | 0.02 | 0.03 | 0.0028 | 0.0028 | |||||
| DECK / Deckers Outdoor Corporation | 0.00 | -100.00 | 0.00 | 0.0000 | |||||
| CMPO.W / CompoSecure, Inc. - Equity Warrant | 0.00 | -100.00 | 0.00 | 0.0000 | |||||
| OMEX / Odyssey Marine Exploration, Inc. | 0.00 | -100.00 | 0.00 | -100.00 | -0.0007 | ||||
| PRMB / Primo Brands Corporation | 0.00 | -100.00 | 0.00 | 0.0000 |