Mga Batayang Estadistika
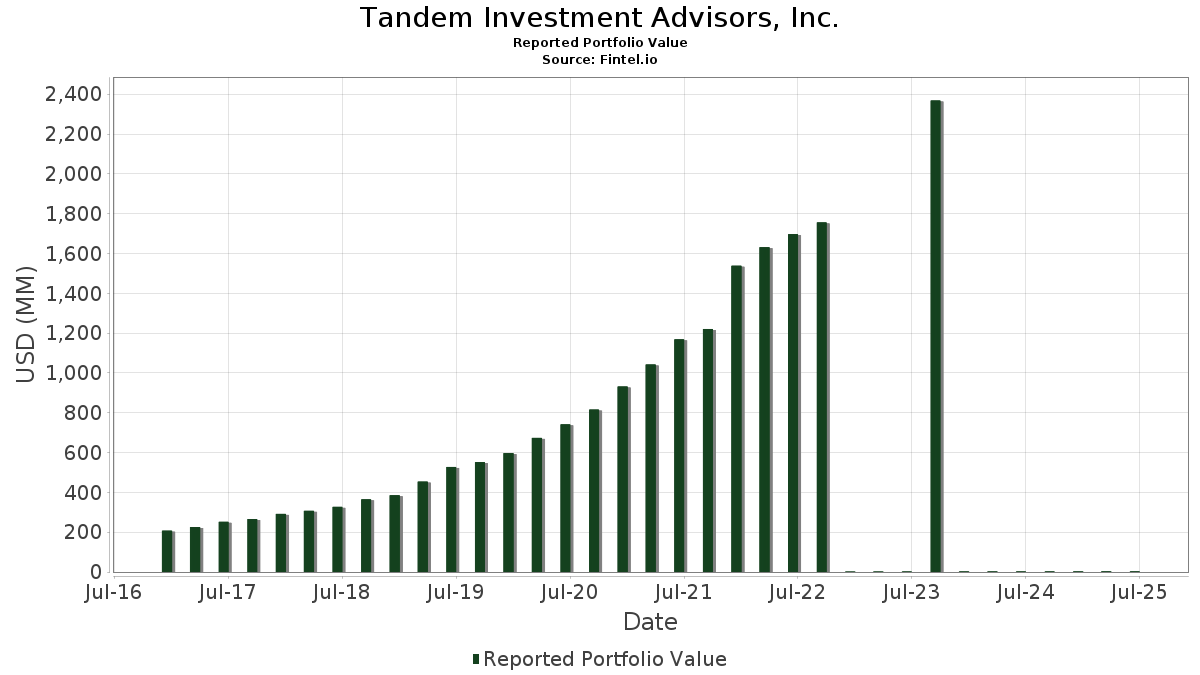
| Nilai Portofolio | $ 2,855,748 |
| Posisi Saat Ini | 69 |
Kepemilikan Terbaru, Kinerja, AUM (dari 13F, 13D)
Tandem Investment Advisors, Inc. telah mengungkapkan total kepemilikan 69 dalam pengajuan SEC terbaru mereka. Nilai portofolio terbaru dihitung sebesar $ 2,855,748 USD. Aset yang Dikelola (AUM) sebenarnya adalah nilai ini ditambah kas (yang tidak diungkapkan). Aset-aset utama Tandem Investment Advisors, Inc. adalah Visa Inc. (US:V) , Intercontinental Exchange, Inc. (US:ICE) , Abbott Laboratories (US:ABT) , ResMed Inc. (US:RMD) , and Amphenol Corporation (US:APH) . Posisi baru Tandem Investment Advisors, Inc. meliputi: Gartner, Inc. (US:IT) , .
Peningkatan Tertinggi Kuartal Ini
Kami menggunakan perubahan dalam alokasi portofolio karena ini adalah metrik yang paling bermakna. Perubahan dapat disebabkan oleh perdagangan atau perubahan harga saham.
| Keamanan | Saham (MM) |
Nilai (Juta Dolar AS) |
Portfolio % | ΔPorsyento ng Portfolio |
|---|---|---|---|---|
| 0.79 | 0.12 | 4.3200 | 2.0473 | |
| 0.24 | 0.12 | 4.2327 | 1.0331 | |
| 1.30 | 0.13 | 4.4795 | 0.8246 | |
| 0.38 | 0.11 | 3.9894 | 0.8202 | |
| 0.24 | 0.07 | 2.5404 | 0.7021 | |
| 0.20 | 0.11 | 4.0029 | 0.6418 | |
| 0.50 | 0.13 | 4.4982 | 0.5544 | |
| 0.71 | 0.07 | 2.3935 | 0.4974 | |
| 0.43 | 0.15 | 5.3602 | 0.4594 | |
| 0.81 | 0.15 | 5.1929 | 0.4474 |
Penurunan Tertinggi Kuartal Ini
Kami menggunakan perubahan dalam alokasi portofolio karena ini adalah metrik yang paling bermakna. Perubahan dapat disebabkan oleh perdagangan atau perubahan harga saham.
| Keamanan | Saham (MM) |
Nilai (Juta Dolar AS) |
Portfolio % | ΔPorsyento ng Portfolio |
|---|---|---|---|---|
| 0.01 | 0.00 | 0.1211 | -6.3092 | |
| 0.28 | 0.05 | 1.6588 | -1.2558 | |
| 0.20 | 0.09 | 3.1496 | -0.8226 | |
| 0.28 | 0.03 | 0.9693 | -0.7219 | |
| 0.00 | 0.00 | -0.2438 | ||
| 0.29 | 0.04 | 1.5494 | -0.1506 | |
| 0.82 | 0.09 | 3.1687 | -0.1503 | |
| 2.07 | 0.08 | 2.6923 | -0.1282 | |
| 0.36 | 0.04 | 1.4451 | -0.0728 | |
| 0.10 | 0.06 | 1.9600 | -0.0606 |
Pengajuan 13F dan Dana
Formulir ini diajukan pada 2025-07-31 untuk periode pelaporan 2025-06-30. Klik ikon tautan untuk melihat riwayat transaksi selengkapnya.
Tingkatkan ke versi premium untuk membuka data premium dan ekspor ke Excel. ![]() .
.
| Keamanan | Ketik | Harga Saham Rata-rata | Saham (MM) |
ΔSaham (%) |
ΔSaham (%) |
Nilai ($MM) |
Portpolyo (%) |
ΔPortofolio (%) |
|
|---|---|---|---|---|---|---|---|---|---|
| V / Visa Inc. | 0.43 | 7.57 | 0.15 | 9.29 | 5.3602 | 0.4594 | |||
| ICE / Intercontinental Exchange, Inc. | 0.81 | 2.51 | 0.15 | 8.82 | 5.1929 | 0.4474 | |||
| ABT / Abbott Laboratories | 0.99 | 0.53 | 0.14 | 3.05 | 4.7282 | 0.1577 | |||
| RMD / ResMed Inc. | 0.50 | -1.40 | 0.13 | 13.27 | 4.4982 | 0.5544 | |||
| APH / Amphenol Corporation | 1.30 | -18.89 | 0.13 | 22.12 | 4.4795 | 0.8246 | |||
| ZTS / Zoetis Inc. | 0.79 | 99.95 | 0.12 | 89.23 | 4.3200 | 2.0473 | |||
| JKHY / Jack Henry & Associates, Inc. | 0.67 | 3.74 | 0.12 | 2.54 | 4.2492 | 0.1131 | |||
| MSFT / Microsoft Corporation | 0.24 | -0.53 | 0.12 | 31.87 | 4.2327 | 1.0331 | |||
| MA / Mastercard Incorporated | 0.20 | 15.74 | 0.11 | 18.75 | 4.0029 | 0.6418 | |||
| ACN / Accenture plc | 0.38 | 30.94 | 0.11 | 25.56 | 3.9894 | 0.8202 | |||
| G / Genpact Limited | 2.58 | 13.84 | 0.11 | -0.88 | 3.9827 | -0.0076 | |||
| STE / STERIS plc | 0.46 | 1.56 | 0.11 | 6.86 | 3.8518 | 0.2865 | |||
| SYK / Stryker Corporation | 0.27 | 0.06 | 0.11 | 6.93 | 3.7824 | 0.2385 | |||
| NEE / NextEra Energy, Inc. | 1.42 | 3.21 | 0.10 | 1.03 | 3.4459 | 0.0489 | |||
| BRO / Brown & Brown, Inc. | 0.82 | 6.73 | 0.09 | -5.26 | 3.1687 | -0.1503 | |||
| FDS / FactSet Research Systems Inc. | 0.20 | -19.70 | 0.09 | -21.24 | 3.1496 | -0.8226 | |||
| CMCSA / Comcast Corporation | 2.39 | 3.90 | 0.09 | 1.19 | 2.9818 | 0.0256 | |||
| TRNO / Terreno Realty Corporation | 1.41 | 28.22 | 0.08 | 13.04 | 2.7661 | 0.3427 | |||
| C.WSA / Citigroup, Inc. | 0.07 | -0.64 | 0.08 | 10.00 | 2.7085 | 0.2586 | |||
| WTRG / Essential Utilities, Inc. | 2.07 | 1.23 | 0.08 | -5.00 | 2.6923 | -0.1282 | |||
| ADP / Automatic Data Processing, Inc. | 0.24 | 36.41 | 0.07 | 38.46 | 2.5404 | 0.7021 | |||
| WCN / Waste Connections, Inc. | 0.37 | 5.68 | 0.07 | 1.45 | 2.4512 | 0.0354 | |||
| CHD / Church & Dwight Co., Inc. | 0.71 | 44.06 | 0.07 | 25.93 | 2.3935 | 0.4974 | |||
| ROP / Roper Technologies, Inc. | 0.10 | 0.53 | 0.06 | -3.51 | 1.9600 | -0.0606 | |||
| RSG / Republic Services, Inc. | 0.22 | -1.99 | 0.05 | 0.00 | 1.9019 | 0.0034 | |||
| VRSK / Verisk Analytics, Inc. | 0.17 | 3.13 | 0.05 | 8.51 | 1.8143 | 0.1397 | |||
| BDX / Becton, Dickinson and Company | 0.28 | -24.59 | 0.05 | -43.37 | 1.6588 | -1.2558 | |||
| JNJ / Johnson & Johnson | 0.29 | -1.41 | 0.04 | -8.33 | 1.5494 | -0.1506 | |||
| COST / Costco Wholesale Corporation | 0.04 | 0.14 | 0.04 | 5.00 | 1.4875 | 0.0736 | |||
| EXPD / Expeditors International of Washington, Inc. | 0.36 | -0.16 | 0.04 | -4.65 | 1.4451 | -0.0728 | |||
| SJM / The J. M. Smucker Company | 0.28 | -31.14 | 0.03 | -43.75 | 0.9693 | -0.7219 | |||
| IDXX / IDEXX Laboratories, Inc. | 0.01 | 0.27 | 0.01 | 50.00 | 0.2206 | 0.0490 | |||
| ANSS / ANSYS, Inc. | 0.02 | 21.12 | 0.01 | 50.00 | 0.2182 | 0.0564 | |||
| QLYS / Qualys, Inc. | 0.04 | 0.51 | 0.01 | 0.00 | 0.2080 | 0.0263 | |||
| ORLY / O'Reilly Automotive, Inc. | 0.06 | 1,361.27 | 0.01 | -16.67 | 0.2008 | -0.0168 | |||
| TYL / Tyler Technologies, Inc. | 0.01 | -0.41 | 0.01 | 0.00 | 0.1818 | 0.0034 | |||
| ISRG / Intuitive Surgical, Inc. | 0.01 | 0.97 | 0.00 | 0.00 | 0.1679 | 0.0169 | |||
| MEDP / Medpace Holdings, Inc. | 0.01 | 27.36 | 0.00 | 33.33 | 0.1636 | 0.0394 | |||
| ADBE / Adobe Inc. | 0.01 | 158.72 | 0.00 | 300.00 | 0.1569 | 0.0970 | |||
| CBOE / Cboe Global Markets, Inc. | 0.01 | -98.18 | 0.00 | -98.37 | 0.1211 | -6.3092 | |||
| AKAM / Akamai Technologies, Inc. | 0.03 | -5.06 | 0.00 | 0.00 | 0.0834 | -0.0049 | |||
| ABBV / AbbVie Inc. | 0.01 | 7.31 | 0.00 | 0.00 | 0.0618 | -0.0029 | |||
| PG / The Procter & Gamble Company | 0.01 | -30.28 | 0.00 | -50.00 | 0.0603 | -0.0319 | |||
| AAPL / Apple Inc. | 0.01 | -6.91 | 0.00 | 0.00 | 0.0467 | -0.0074 | |||
| WMT / Walmart Inc. | 0.01 | -8.63 | 0.00 | 0.00 | 0.0375 | 0.0008 | |||
| HD / The Home Depot, Inc. | 0.00 | -7.49 | 0.00 | 0.0290 | -0.0022 | ||||
| TJX / The TJX Companies, Inc. | 0.01 | 1.59 | 0.00 | 0.0248 | 0.0008 | ||||
| RY / Royal Bank of Canada | 0.01 | -26.74 | 0.00 | 0.0240 | -0.0040 | ||||
| BX / Blackstone Inc. | 0.00 | -8.33 | 0.00 | 0.0220 | -0.0003 | ||||
| KO / The Coca-Cola Company | 0.01 | -15.58 | 0.00 | 0.0194 | -0.0038 | ||||
| FAST / Fastenal Company | 0.01 | 21.51 | 0.00 | 0.0179 | -0.0092 | ||||
| EXLS / ExlService Holdings, Inc. | 0.01 | -0.94 | 0.00 | 0.0157 | -0.0013 | ||||
| GOOG / Alphabet Inc. | 0.00 | 1.39 | 0.00 | 0.0136 | 0.0018 | ||||
| PM / Philip Morris International Inc. | 0.00 | 1.20 | 0.00 | 0.0134 | 0.0019 | ||||
| AMZN / Amazon.com, Inc. | 0.00 | -11.62 | 0.00 | 0.0131 | 0.0003 | ||||
| MO / Altria Group, Inc. | 0.01 | -6.21 | 0.00 | 0.0129 | -0.0011 | ||||
| ETN / Eaton Corporation plc | 0.00 | 0.00 | 0.0110 | 0.0110 | |||||
| META / Meta Platforms, Inc. | 0.00 | -68.01 | 0.00 | 0.0096 | -0.0069 | ||||
| JPM / JPMorgan Chase & Co. | 0.00 | -23.57 | 0.00 | 0.0095 | -0.0010 | ||||
| CTVA / Corteva, Inc. | 0.00 | -0.22 | 0.00 | 0.0093 | 0.0015 | ||||
| WEC / WEC Energy Group, Inc. | 0.00 | 4.09 | 0.00 | 0.0089 | -0.0000 | ||||
| GOOGL / Alphabet Inc. | 0.00 | -7.28 | 0.00 | 0.0089 | 0.0005 | ||||
| IT / Gartner, Inc. | 0.00 | 0.00 | 0.0085 | 0.0085 | |||||
| DD / DuPont de Nemours, Inc. | 0.00 | -9.71 | 0.00 | 0.0085 | -0.0017 | ||||
| QDEL / QuidelOrtho Corporation | 0.01 | -11.82 | 0.00 | 0.0075 | -0.0028 | ||||
| BRK.B / Berkshire Hathaway Inc. | 0.00 | -27.27 | 0.00 | 0.0075 | -0.0037 | ||||
| MRK / Merck & Co., Inc. | 0.00 | 0.00 | 0.0074 | 0.0074 | |||||
| AMGN / Amgen Inc. | 0.00 | 0.00 | 0.0073 | 0.0073 | |||||
| CVX / Chevron Corporation | 0.00 | 0.64 | 0.00 | 0.0070 | -0.0011 | ||||
| NVDA / NVIDIA Corporation | 0.00 | -100.00 | 0.00 | 0.0000 | -0.0080 | ||||
| UNH / UnitedHealth Group Incorporated | 0.00 | -100.00 | 0.00 | 0.0000 | |||||
| FI / Fiserv, Inc. | 0.00 | -100.00 | 0.00 | -100.00 | -0.2438 | ||||
| TFC / Truist Financial Corporation | 0.00 | -100.00 | 0.00 | 0.0000 | |||||
| UPS / United Parcel Service, Inc. | 0.00 | -100.00 | 0.00 | 0.0000 |