Mga Batayang Estadistika
| Nilai Portofolio | $ 178,958,799 |
| Posisi Saat Ini | 87 |
Kepemilikan Terbaru, Kinerja, AUM (dari 13F, 13D)
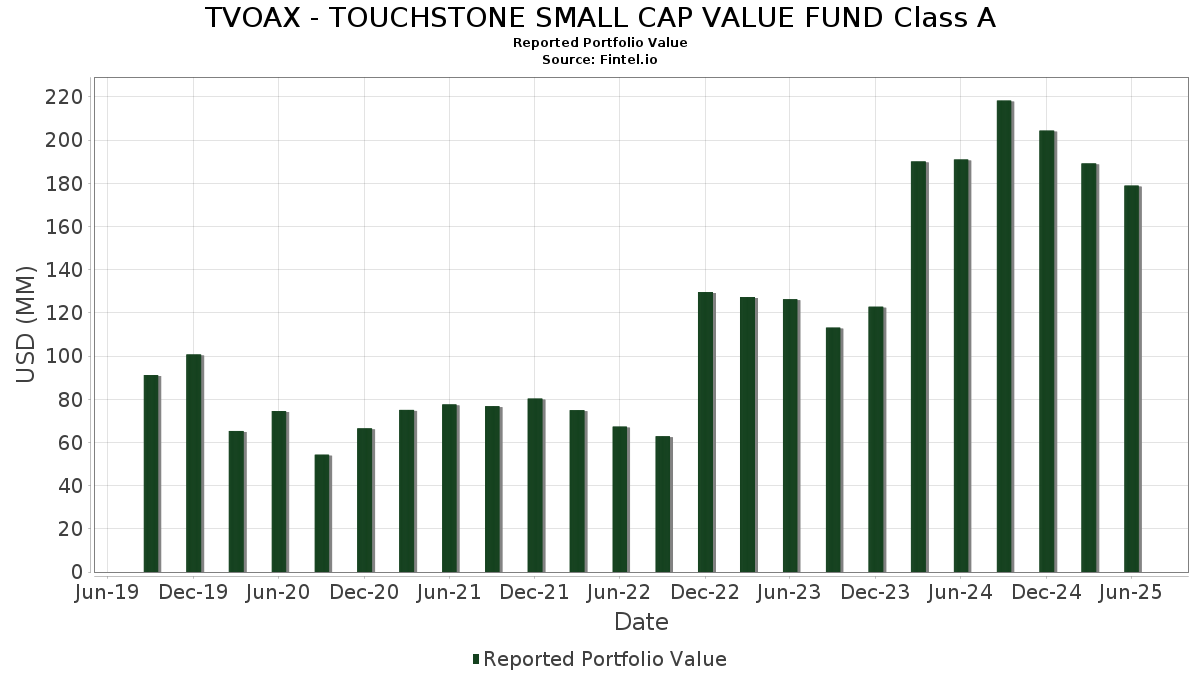
TVOAX - TOUCHSTONE SMALL CAP VALUE FUND Class A telah mengungkapkan total kepemilikan 87 dalam pengajuan SEC terbaru mereka. Nilai portofolio terbaru dihitung sebesar $ 178,958,799 USD. Aset yang Dikelola (AUM) sebenarnya adalah nilai ini ditambah kas (yang tidak diungkapkan). Aset-aset utama TVOAX - TOUCHSTONE SMALL CAP VALUE FUND Class A adalah Lumentum Holdings Inc. (US:LITE) , Wintrust Financial Corporation (US:WTFC) , Encompass Health Corporation (US:EHC) , Gates Industrial Corporation plc (US:GTES) , and Prestige Consumer Healthcare Inc. (US:PBH) . Posisi baru TVOAX - TOUCHSTONE SMALL CAP VALUE FUND Class A meliputi: Addus HomeCare Corporation (US:ADUS) , .
Peningkatan Tertinggi Kuartal Ini
Kami menggunakan perubahan dalam alokasi portofolio karena ini adalah metrik yang paling bermakna. Perubahan dapat disebabkan oleh perdagangan atau perubahan harga saham.
| Keamanan | Saham (MM) |
Nilai (Juta Dolar AS) |
Portfolio % | ΔPorsyento ng Portfolio |
|---|---|---|---|---|
| 0.05 | 5.21 | 2.9109 | 1.1085 | |
| 1.96 | 1.96 | 1.0970 | 0.8461 | |
| 0.01 | 1.37 | 0.7662 | 0.7662 | |
| 0.02 | 2.60 | 1.4542 | 0.5455 | |
| 0.11 | 2.80 | 1.5625 | 0.5357 | |
| 0.03 | 2.98 | 1.6631 | 0.4816 | |
| 0.17 | 3.97 | 2.2155 | 0.3838 | |
| 0.01 | 3.13 | 1.7507 | 0.3556 | |
| 0.01 | 2.97 | 1.6578 | 0.3551 | |
| 0.04 | 2.72 | 1.5178 | 0.2929 |
Penurunan Tertinggi Kuartal Ini
Kami menggunakan perubahan dalam alokasi portofolio karena ini adalah metrik yang paling bermakna. Perubahan dapat disebabkan oleh perdagangan atau perubahan harga saham.
| Keamanan | Saham (MM) |
Nilai (Juta Dolar AS) |
Portfolio % | ΔPorsyento ng Portfolio |
|---|---|---|---|---|
| 0.04 | 1.50 | 0.8364 | -1.2247 | |
| 0.01 | 2.47 | 1.3814 | -0.6030 | |
| 0.05 | 3.85 | 2.1480 | -0.4423 | |
| 0.00 | 1.98 | 1.1083 | -0.4325 | |
| 0.04 | 1.01 | 0.5615 | -0.4144 | |
| 0.03 | 3.61 | 2.0187 | -0.3505 | |
| 0.06 | 0.69 | 0.3858 | -0.3293 | |
| 0.03 | 0.83 | 0.4646 | -0.3230 | |
| 0.06 | 1.99 | 1.1130 | -0.3076 | |
| 0.04 | 2.94 | 1.6428 | -0.2484 |
Pengajuan 13F dan Dana
Formulir ini diajukan pada 2025-08-27 untuk periode pelaporan 2025-06-30. Klik ikon tautan untuk melihat riwayat transaksi selengkapnya.
Tingkatkan ke versi premium untuk membuka data premium dan ekspor ke Excel. ![]() .
.
| Keamanan | Ketik | Harga Saham Rata-rata | Saham (MM) |
ΔSaham (%) |
ΔSaham (%) |
Nilai ($MM) |
Portpolyo (%) |
ΔPortofolio (%) |
|
|---|---|---|---|---|---|---|---|---|---|
| LITE / Lumentum Holdings Inc. | 0.05 | 0.14 | 5.21 | 52.70 | 2.9109 | 1.1085 | |||
| WTFC / Wintrust Financial Corporation | 0.04 | -8.59 | 4.41 | 0.78 | 2.4617 | 0.1520 | |||
| EHC / Encompass Health Corporation | 0.03 | -25.80 | 4.13 | -10.16 | 2.3064 | -0.1210 | |||
| GTES / Gates Industrial Corporation plc | 0.17 | -8.58 | 3.97 | 14.36 | 2.2155 | 0.3838 | |||
| PBH / Prestige Consumer Healthcare Inc. | 0.05 | -15.58 | 3.85 | -21.58 | 2.1480 | -0.4423 | |||
| HURN / Huron Consulting Group Inc. | 0.03 | -15.97 | 3.61 | -19.44 | 2.0187 | -0.3505 | |||
| FHN / First Horizon Corporation | 0.16 | -8.58 | 3.46 | -0.20 | 1.9349 | 0.1018 | |||
| PNFP / Pinnacle Financial Partners, Inc. | 0.03 | -8.59 | 3.40 | -4.81 | 1.9012 | 0.0124 | |||
| NMRK / Newmark Group, Inc. | 0.28 | 3.35 | 3.36 | 3.19 | 1.8788 | 0.1571 | |||
| NPO / Enpro Inc. | 0.02 | -8.60 | 3.28 | 8.19 | 1.8311 | 0.2311 | |||
| COLB / Columbia Banking System, Inc. | 0.14 | -8.58 | 3.26 | -14.30 | 1.8217 | -0.1881 | |||
| CACI / CACI International Inc | 0.01 | -8.67 | 3.13 | 18.63 | 1.7507 | 0.3556 | |||
| ONB / Old National Bancorp | 0.14 | -8.58 | 3.06 | -7.94 | 1.7101 | -0.0462 | |||
| IDA / IDACORP, Inc. | 0.03 | 33.99 | 2.98 | 33.14 | 1.6631 | 0.4816 | |||
| VMI / Valmont Industries, Inc. | 0.01 | 5.15 | 2.97 | 20.32 | 1.6578 | 0.3551 | |||
| ADC / Agree Realty Corporation | 0.04 | -13.22 | 2.94 | -17.88 | 1.6428 | -0.2484 | |||
| FIBK / First Interstate BancSystem, Inc. | 0.10 | 8.25 | 2.88 | 8.92 | 1.6106 | 0.2120 | |||
| CLH / Clean Harbors, Inc. | 0.01 | -8.73 | 2.81 | 7.06 | 1.5670 | 0.1830 | |||
| ASB / Associated Banc-Corp | 0.11 | 32.91 | 2.80 | 43.90 | 1.5625 | 0.5357 | |||
| PR / Permian Resources Corporation | 0.20 | -8.58 | 2.74 | -10.11 | 1.5301 | -0.0791 | |||
| VOYA / Voya Financial, Inc. | 0.04 | 11.82 | 2.72 | 17.21 | 1.5178 | 0.2929 | |||
| IWN / iShares Trust - iShares Russell 2000 Value ETF | 0.02 | -8.87 | 2.69 | -4.78 | 1.5014 | 0.0105 | |||
| SXI / Standex International Corporation | 0.02 | -8.60 | 2.66 | -11.37 | 1.4844 | -0.0994 | |||
| INDB / Independent Bank Corp. | 0.04 | -9.12 | 2.65 | -8.78 | 1.4809 | -0.0541 | |||
| ITT / ITT Inc. | 0.02 | -8.70 | 2.65 | 10.89 | 1.4788 | 0.2175 | |||
| SLAB / Silicon Laboratories Inc. | 0.02 | 15.59 | 2.60 | 51.34 | 1.4542 | 0.5455 | |||
| NBHC / National Bank Holdings Corporation | 0.07 | 10.22 | 2.55 | 8.30 | 1.4221 | 0.1807 | |||
| STAG / STAG Industrial, Inc. | 0.07 | -8.58 | 2.52 | -8.16 | 1.4090 | -0.0419 | |||
| MTG / MGIC Investment Corporation | 0.09 | -8.58 | 2.50 | 2.72 | 1.3946 | 0.1107 | |||
| THG / The Hanover Insurance Group, Inc. | 0.01 | -32.60 | 2.47 | -34.19 | 1.3814 | -0.6030 | |||
| PFGC / Performance Food Group Company | 0.03 | -20.16 | 2.44 | -11.20 | 1.3647 | -0.0881 | |||
| HLIT / Harmonic Inc. | 0.25 | -8.58 | 2.40 | -9.70 | 1.3424 | -0.0636 | |||
| IBP / Installed Building Products, Inc. | 0.01 | -9.20 | 2.38 | -4.53 | 1.3305 | 0.0130 | |||
| KFY / Korn Ferry | 0.03 | -8.59 | 2.35 | -1.18 | 1.3143 | 0.0567 | |||
| STWD / Starwood Property Trust, Inc. | 0.11 | -8.58 | 2.30 | -7.19 | 1.2835 | -0.0241 | |||
| CBT / Cabot Corporation | 0.03 | 5.97 | 2.29 | -4.43 | 1.2780 | 0.0139 | |||
| VIAV / Viavi Solutions Inc. | 0.22 | -8.58 | 2.21 | -17.74 | 1.2362 | -0.1845 | |||
| DORM / Dorman Products, Inc. | 0.02 | -8.60 | 2.21 | -7.00 | 1.2322 | -0.0203 | |||
| VLY / Valley National Bancorp | 0.24 | -8.58 | 2.18 | -8.18 | 1.2165 | -0.0360 | |||
| CDP / COPT Defense Properties | 0.07 | -8.58 | 2.07 | -7.56 | 1.1539 | -0.0261 | |||
| EXLS / ExlService Holdings, Inc. | 0.05 | -8.59 | 2.05 | -15.25 | 1.1463 | -0.1320 | |||
| NSA / National Storage Affiliates Trust | 0.06 | -8.76 | 1.99 | -25.92 | 1.1130 | -0.3076 | |||
| MUSA / Murphy USA Inc. | 0.00 | -21.45 | 1.98 | -32.02 | 1.1083 | -0.4325 | |||
| DGCXX / Dreyfus Government Cash Management Funds - Dreyfus Government Cash Management Fund Institutional Shares | 1.96 | 313.41 | 1.96 | 313.26 | 1.0970 | 0.8461 | |||
| WHD / Cactus, Inc. | 0.04 | 7.75 | 1.89 | 2.77 | 1.0563 | 0.0847 | |||
| INGR / Ingredion Incorporated | 0.01 | -8.95 | 1.87 | -8.68 | 1.0469 | -0.0370 | |||
| FAF / First American Financial Corporation | 0.03 | -8.60 | 1.83 | -14.51 | 1.0207 | -0.1081 | |||
| OPCH / Option Care Health, Inc. | 0.06 | -8.58 | 1.81 | -15.02 | 1.0112 | -0.1143 | |||
| VVV / Valvoline Inc. | 0.05 | -8.58 | 1.76 | -0.56 | 0.9858 | 0.0486 | |||
| SLGN / Silgan Holdings Inc. | 0.03 | -8.77 | 1.76 | -3.30 | 0.9827 | 0.0217 | |||
| RRX / Regal Rexnord Corporation | 0.01 | -8.61 | 1.71 | 16.36 | 0.9537 | 0.1788 | |||
| NMIH / NMI Holdings, Inc. | 0.04 | -8.59 | 1.66 | 7.01 | 0.9292 | 0.1079 | |||
| EPAC / Enerpac Tool Group Corp. | 0.04 | -8.59 | 1.57 | -17.36 | 0.8750 | -0.1260 | |||
| UVSP / Univest Financial Corporation | 0.05 | -8.58 | 1.56 | -3.16 | 0.8739 | 0.0206 | |||
| POR / Portland General Electric Company | 0.04 | -57.88 | 1.50 | -61.64 | 0.8364 | -1.2247 | |||
| GPI / Group 1 Automotive, Inc. | 0.00 | -8.66 | 1.44 | 4.42 | 0.8053 | 0.0762 | |||
| HXL / Hexcel Corporation | 0.03 | -8.60 | 1.43 | -5.66 | 0.8005 | -0.0022 | |||
| CHCO / City Holding Company | 0.01 | -8.61 | 1.40 | -4.77 | 0.7811 | 0.0056 | |||
| GMED / Globus Medical, Inc. | 0.02 | -8.74 | 1.39 | -26.43 | 0.7745 | -0.2208 | |||
| ADUS / Addus HomeCare Corporation | 0.01 | 1.37 | 0.7662 | 0.7662 | |||||
| CIVI / Civitas Resources, Inc. | 0.05 | -8.58 | 1.34 | -27.91 | 0.7479 | -0.2328 | |||
| BDC / Belden Inc. | 0.01 | -9.06 | 1.32 | 5.01 | 0.7384 | 0.0738 | |||
| COHU / Cohu, Inc. | 0.07 | 1.07 | 1.31 | 32.29 | 0.7302 | 0.2080 | |||
| GNTX / Gentex Corporation | 0.06 | -8.58 | 1.31 | -13.74 | 0.7297 | -0.0700 | |||
| ROG / Rogers Corporation | 0.02 | 14.41 | 1.27 | 16.03 | 0.7083 | 0.1311 | |||
| OI / O-I Glass, Inc. | 0.08 | -8.58 | 1.24 | 17.47 | 0.6952 | 0.1357 | |||
| URBN / Urban Outfitters, Inc. | 0.02 | -8.98 | 1.23 | 25.94 | 0.6892 | 0.1720 | |||
| BKH / Black Hills Corporation | 0.02 | -8.60 | 1.23 | -15.45 | 0.6850 | -0.0811 | |||
| SR / Spire Inc. | 0.02 | -8.60 | 1.16 | -14.71 | 0.6480 | -0.0707 | |||
| MZTI / The Marzetti Company | 0.01 | -8.65 | 1.15 | -9.85 | 0.6445 | -0.0312 | |||
| NGVT / Ingevity Corporation | 0.03 | -8.59 | 1.13 | -0.53 | 0.6314 | 0.0314 | |||
| XPRO / Expro Group Holdings N.V. | 0.13 | -8.78 | 1.08 | -21.21 | 0.6043 | -0.1205 | |||
| WABC / Westamerica Bancorporation | 0.02 | -8.59 | 1.06 | -12.52 | 0.5933 | -0.0482 | |||
| CAKE / The Cheesecake Factory Incorporated | 0.02 | -40.75 | 1.05 | -23.73 | 0.5892 | -0.1410 | |||
| CIM / Chimera Investment Corporation | 0.08 | -8.58 | 1.05 | -1.13 | 0.5843 | 0.0253 | |||
| NVRI / Enviri Corporation | 0.12 | -8.58 | 1.02 | 19.41 | 0.5672 | 0.1178 | |||
| CHX / ChampionX Corporation | 0.04 | -34.74 | 1.01 | -45.59 | 0.5615 | -0.4144 | |||
| THS / TreeHouse Foods, Inc. | 0.05 | -8.58 | 0.99 | -34.51 | 0.5518 | -0.2443 | |||
| CTO / CTO Realty Growth, Inc. | 0.06 | -9.78 | 0.98 | -19.34 | 0.5454 | -0.0941 | |||
| SHOO / Steven Madden, Ltd. | 0.04 | -8.58 | 0.96 | -17.78 | 0.5379 | -0.0802 | |||
| IOSP / Innospec Inc. | 0.01 | -8.62 | 0.93 | -18.92 | 0.5198 | -0.0862 | |||
| NVST / Envista Holdings Corporation | 0.05 | -8.58 | 0.92 | 3.48 | 0.5148 | 0.0445 | |||
| QDEL / QuidelOrtho Corporation | 0.03 | -8.59 | 0.85 | -24.65 | 0.4766 | -0.1216 | |||
| AXTA / Axalta Coating Systems Ltd. | 0.03 | -37.68 | 0.83 | -44.27 | 0.4646 | -0.3230 | |||
| IART / Integra LifeSciences Holdings Corporation | 0.06 | -8.58 | 0.69 | -49.00 | 0.3858 | -0.3293 | |||
| YETI / YETI Holdings, Inc. | 0.02 | -8.59 | 0.50 | -12.95 | 0.2820 | -0.0243 | |||
| MGPI / MGP Ingredients, Inc. | 0.01 | -8.61 | 0.33 | -6.61 | 0.1816 | -0.0026 |