Mga Batayang Estadistika
| Nilai Portofolio | $ 566,203 |
| Posisi Saat Ini | 32 |
Kepemilikan Terbaru, Kinerja, AUM (dari 13F, 13D)
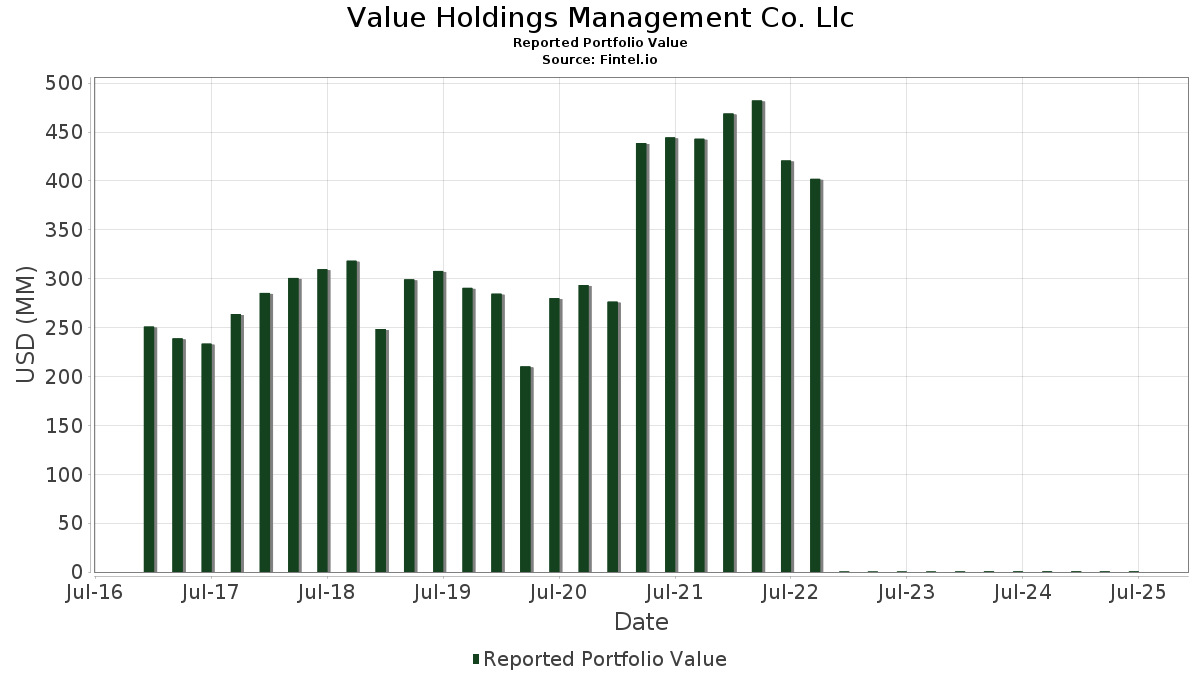
Value Holdings Management Co. Llc telah mengungkapkan total kepemilikan 32 dalam pengajuan SEC terbaru mereka. Nilai portofolio terbaru dihitung sebesar $ 566,203 USD. Aset yang Dikelola (AUM) sebenarnya adalah nilai ini ditambah kas (yang tidak diungkapkan). Aset-aset utama Value Holdings Management Co. Llc adalah EMCOR Group, Inc. (US:EME) , Rollins, Inc. (DE:RLS) , Westinghouse Air Brake Technologies Corporation (US:WAB) , Primoris Services Corporation (US:PRIM) , and Exxon Mobil Corporation (US:XOM) .
Peningkatan Tertinggi Kuartal Ini
Kami menggunakan perubahan dalam alokasi portofolio karena ini adalah metrik yang paling bermakna. Perubahan dapat disebabkan oleh perdagangan atau perubahan harga saham.
| Keamanan | Saham (MM) |
Nilai (Juta Dolar AS) |
Portfolio % | ΔPorsyento ng Portfolio |
|---|---|---|---|---|
| 0.11 | 0.06 | 10.6439 | 2.8344 | |
| 0.46 | 0.04 | 6.3551 | 1.3849 | |
| 0.91 | 0.03 | 5.7624 | 0.7858 | |
| 0.30 | 0.03 | 5.2245 | 0.7498 | |
| 0.23 | 0.05 | 8.6114 | 0.6911 | |
| 0.20 | 0.02 | 3.0662 | 0.2872 | |
| 0.04 | 0.00 | 0.5023 | 0.2525 | |
| 0.07 | 0.00 | 0.6111 | 0.1894 | |
| 0.03 | 0.01 | 1.9034 | 0.1373 | |
| 0.10 | 0.00 | 0.7294 | 0.1292 |
Penurunan Tertinggi Kuartal Ini
Kami menggunakan perubahan dalam alokasi portofolio karena ini adalah metrik yang paling bermakna. Perubahan dapat disebabkan oleh perdagangan atau perubahan harga saham.
| Keamanan | Saham (MM) |
Nilai (Juta Dolar AS) |
Portfolio % | ΔPorsyento ng Portfolio |
|---|---|---|---|---|
| 0.24 | 0.01 | 2.5291 | -1.4564 | |
| 0.31 | 0.03 | 5.9563 | -1.0207 | |
| 0.27 | 0.02 | 3.8437 | -0.9104 | |
| 0.69 | 0.03 | 5.8408 | -0.7985 | |
| 0.33 | 0.02 | 2.6992 | -0.7161 | |
| 0.15 | 0.02 | 2.7163 | -0.4550 | |
| 0.03 | 0.01 | 1.0049 | -0.4444 | |
| 0.44 | 0.01 | 1.9887 | -0.4155 | |
| 0.14 | 0.02 | 2.9046 | -0.4019 | |
| 0.94 | 0.05 | 9.3585 | -0.2583 |
Pengajuan 13F dan Dana
Formulir ini diajukan pada 2025-08-08 untuk periode pelaporan 2025-06-30. Klik ikon tautan untuk melihat riwayat transaksi selengkapnya.
Tingkatkan ke versi premium untuk membuka data premium dan ekspor ke Excel. ![]() .
.
| Keamanan | Ketik | Harga Saham Rata-rata | Saham (MM) |
ΔSaham (%) |
ΔSaham (%) |
Nilai ($MM) |
Portpolyo (%) |
ΔPortofolio (%) |
|
|---|---|---|---|---|---|---|---|---|---|
| EME / EMCOR Group, Inc. | 0.11 | 0.00 | 0.06 | 46.34 | 10.6439 | 2.8344 | |||
| RLS / Rollins, Inc. | 0.94 | -1.05 | 0.05 | 1.96 | 9.3585 | -0.2583 | |||
| WAB / Westinghouse Air Brake Technologies Corporation | 0.23 | 0.00 | 0.05 | 14.29 | 8.6114 | 0.6911 | |||
| PRIM / Primoris Services Corporation | 0.46 | 0.00 | 0.04 | 34.62 | 6.3551 | 1.3849 | |||
| XOM / Exxon Mobil Corporation | 0.31 | 0.00 | 0.03 | -10.81 | 5.9563 | -1.0207 | |||
| MTDR / Matador Resources Company | 0.69 | 0.00 | 0.03 | -5.71 | 5.8408 | -0.7985 | |||
| TTEK / Tetra Tech, Inc. | 0.91 | 0.00 | 0.03 | 23.08 | 5.7624 | 0.7858 | |||
| MKSI / MKS Inc. | 0.30 | 0.00 | 0.03 | 26.09 | 5.2245 | 0.7498 | |||
| CSGS / CSG Systems International, Inc. | 0.34 | 0.00 | 0.02 | 10.00 | 3.9007 | 0.0659 | |||
| 1GPN / Global Payments Inc. | 0.27 | 5.02 | 0.02 | -16.00 | 3.8437 | -0.9104 | |||
| AIT / Applied Industrial Technologies, Inc. | 0.09 | 0.00 | 0.02 | 5.00 | 3.8055 | -0.1116 | |||
| THO / THOR Industries, Inc. | 0.20 | 0.00 | 0.02 | 21.43 | 3.0662 | 0.2872 | |||
| EOG / EOG Resources, Inc. | 0.14 | 0.00 | 0.02 | -5.88 | 2.9046 | -0.4019 | |||
| ONTO / Onto Innovation Inc. | 0.15 | 9.33 | 0.02 | -6.25 | 2.7163 | -0.4550 | |||
| ACIW / ACI Worldwide, Inc. | 0.33 | 0.00 | 0.02 | -16.67 | 2.6992 | -0.7161 | |||
| NSP / Insperity, Inc. | 0.24 | 0.00 | 0.01 | -33.33 | 2.5291 | -1.4564 | |||
| FIS / Fidelity National Information Services, Inc. | 0.16 | -3.57 | 0.01 | 8.33 | 2.3709 | -0.0239 | |||
| CTRA / Coterra Energy Inc. | 0.44 | 0.00 | 0.01 | -8.33 | 1.9887 | -0.4155 | |||
| VMI / Valmont Industries, Inc. | 0.03 | 0.00 | 0.01 | 11.11 | 1.9034 | 0.1373 | |||
| MSM / MSC Industrial Direct Co., Inc. | 0.10 | 0.00 | 0.01 | 14.29 | 1.4528 | 0.0438 | |||
| EEFT / Euronet Worldwide, Inc. | 0.06 | 0.00 | 0.01 | 0.00 | 1.1194 | -0.1334 | |||
| AYI / Acuity Inc. | 0.02 | 0.00 | 0.01 | 20.00 | 1.1065 | 0.0693 | |||
| XPRO / Expro Group Holdings N.V. | 0.03 | -5.71 | 0.01 | -28.57 | 1.0049 | -0.4444 | |||
| COP / ConocoPhillips | 0.05 | 0.00 | 0.00 | -20.00 | 0.8163 | -0.1982 | |||
| DOX / Amdocs Limited | 0.05 | 0.00 | 0.00 | 0.00 | 0.7988 | -0.0520 | |||
| KFY / Korn Ferry | 0.06 | 0.00 | 0.00 | 33.33 | 0.7577 | 0.0136 | |||
| JNPR / Juniper Networks, Inc. | 0.10 | 16.96 | 0.00 | 33.33 | 0.7294 | 0.1292 | |||
| DVN / Devon Energy Corporation | 0.12 | 50.31 | 0.00 | 50.00 | 0.6713 | 0.1136 | |||
| TDW / Tidewater Inc. | 0.07 | 40.98 | 0.00 | 50.00 | 0.6111 | 0.1894 | |||
| VC / Visteon Corporation | 0.03 | 0.00 | 0.00 | 0.00 | 0.5191 | 0.0606 | |||
| TNC / Tennant Company | 0.04 | 119.76 | 0.00 | 100.00 | 0.5023 | 0.2525 | |||
| CBT / Cabot Corporation | 0.03 | 0.00 | 0.00 | 0.00 | 0.4290 | -0.0758 | |||
| CW / Curtiss-Wright Corporation | 0.00 | -100.00 | 0.00 | 0.0000 | |||||
| NVEE / NV5 Global, Inc. | 0.00 | -100.00 | 0.00 | 0.0000 |