Mga Batayang Estadistika
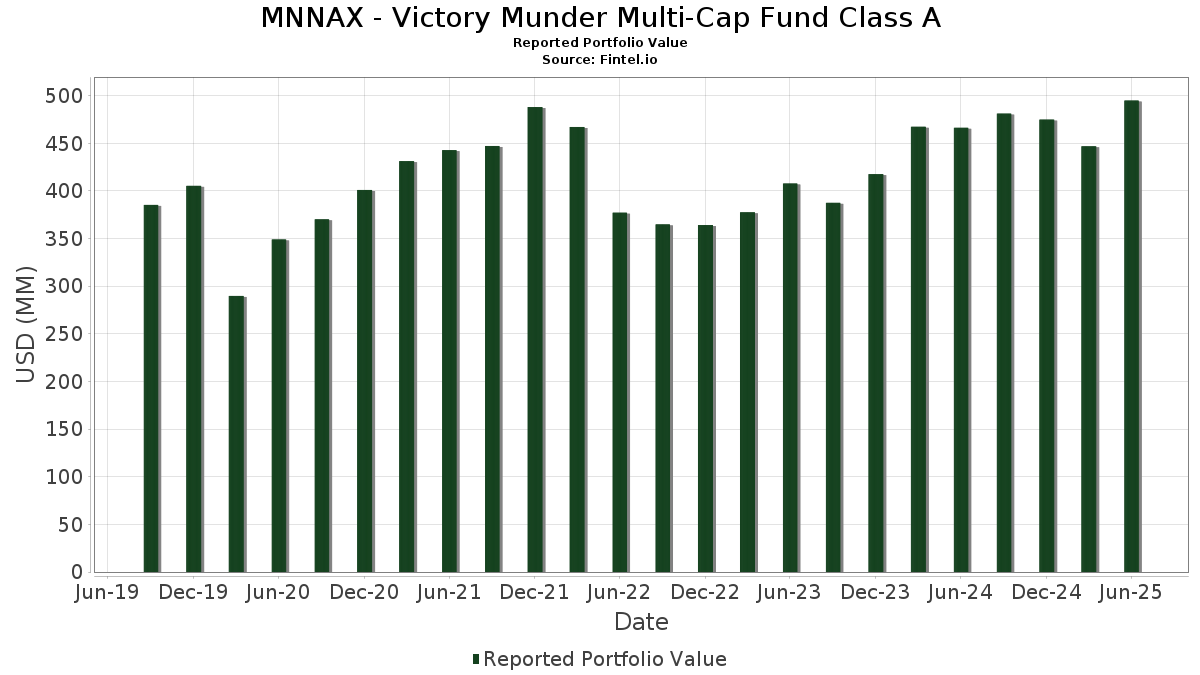
| Nilai Portofolio | $ 494,816,527 |
| Posisi Saat Ini | 75 |
Kepemilikan Terbaru, Kinerja, AUM (dari 13F, 13D)
MNNAX - Victory Munder Multi-Cap Fund Class A telah mengungkapkan total kepemilikan 75 dalam pengajuan SEC terbaru mereka. Nilai portofolio terbaru dihitung sebesar $ 494,816,527 USD. Aset yang Dikelola (AUM) sebenarnya adalah nilai ini ditambah kas (yang tidak diungkapkan). Aset-aset utama MNNAX - Victory Munder Multi-Cap Fund Class A adalah Microsoft Corporation (US:MSFT) , NVIDIA Corporation (US:NVDA) , Apple Inc. (US:AAPL) , Alphabet Inc. (US:GOOGL) , and Amazon.com, Inc. (US:AMZN) . Posisi baru MNNAX - Victory Munder Multi-Cap Fund Class A meliputi: Royal Caribbean Cruises Ltd. (US:RCL) , Universal Health Services, Inc. (US:UHS) , Ralph Lauren Corporation (US:RL) , Autodesk, Inc. (US:ADSK) , and Urban Outfitters, Inc. (US:URBN) .
Peningkatan Tertinggi Kuartal Ini
Kami menggunakan perubahan dalam alokasi portofolio karena ini adalah metrik yang paling bermakna. Perubahan dapat disebabkan oleh perdagangan atau perubahan harga saham.
| Keamanan | Saham (MM) |
Nilai (Juta Dolar AS) |
Portfolio % | ΔPorsyento ng Portfolio |
|---|---|---|---|---|
| 0.17 | 27.25 | 5.4767 | 1.9650 | |
| 0.03 | 8.14 | 1.6361 | 1.6361 | |
| 0.06 | 15.68 | 3.1519 | 1.5556 | |
| 0.03 | 6.05 | 1.2159 | 1.2159 | |
| 0.04 | 8.96 | 1.8013 | 1.2056 | |
| 0.07 | 32.86 | 6.6032 | 1.1923 | |
| 0.02 | 5.05 | 1.0142 | 1.0142 | |
| 0.02 | 5.02 | 1.0078 | 1.0078 | |
| 0.01 | 4.78 | 0.9612 | 0.9612 | |
| 0.02 | 16.61 | 3.3373 | 0.8396 |
Penurunan Tertinggi Kuartal Ini
Kami menggunakan perubahan dalam alokasi portofolio karena ini adalah metrik yang paling bermakna. Perubahan dapat disebabkan oleh perdagangan atau perubahan harga saham.
| Keamanan | Saham (MM) |
Nilai (Juta Dolar AS) |
Portfolio % | ΔPorsyento ng Portfolio |
|---|---|---|---|---|
| 0.12 | 25.48 | 5.1199 | -1.2471 | |
| 0.01 | 9.74 | 1.9581 | -0.8501 | |
| 0.10 | 3.14 | 0.6310 | -0.7233 | |
| 0.01 | 3.62 | 0.7268 | -0.7224 | |
| 0.01 | 5.34 | 1.0736 | -0.7149 | |
| 0.16 | 3.04 | 0.6118 | -0.6202 | |
| 0.07 | 4.68 | 0.9409 | -0.5978 | |
| 0.04 | 5.14 | 1.0335 | -0.5645 | |
| 0.01 | 5.05 | 1.0152 | -0.5475 | |
| 0.10 | 5.25 | 1.0548 | -0.4314 |
Pengajuan 13F dan Dana
Formulir ini diajukan pada 2025-08-28 untuk periode pelaporan 2025-06-30. Klik ikon tautan untuk melihat riwayat transaksi selengkapnya.
Tingkatkan ke versi premium untuk membuka data premium dan ekspor ke Excel. ![]() .
.
| Keamanan | Ketik | Harga Saham Rata-rata | Saham (MM) |
ΔSaham (%) |
ΔSaham (%) |
Nilai ($MM) |
Portpolyo (%) |
ΔPortofolio (%) |
|
|---|---|---|---|---|---|---|---|---|---|
| MSFT / Microsoft Corporation | 0.07 | 1.85 | 32.86 | 34.96 | 6.6032 | 1.1923 | |||
| NVDA / NVIDIA Corporation | 0.17 | 18.31 | 27.25 | 72.48 | 5.4767 | 1.9650 | |||
| AAPL / Apple Inc. | 0.12 | -3.72 | 25.48 | -11.07 | 5.1199 | -1.2471 | |||
| GOOGL / Alphabet Inc. | 0.11 | 6.08 | 19.06 | 20.89 | 3.8304 | 0.3265 | |||
| AMZN / Amazon.com, Inc. | 0.08 | 3.40 | 18.01 | 19.23 | 3.6196 | 0.2624 | |||
| META / Meta Platforms, Inc. | 0.02 | 15.38 | 16.61 | 47.76 | 3.3373 | 0.8396 | |||
| AVGO / Broadcom Inc. | 0.06 | 32.63 | 15.68 | 118.38 | 3.1519 | 1.5556 | |||
| V / Visa Inc. | 0.03 | 16.12 | 11.26 | 17.64 | 2.2618 | 0.1355 | |||
| LLY / Eli Lilly and Company | 0.01 | -18.30 | 9.74 | -22.89 | 1.9581 | -0.8501 | |||
| JBL / Jabil Inc. | 0.04 | 108.63 | 8.96 | 234.44 | 1.8013 | 1.2056 | |||
| JPM / JPMorgan Chase & Co. | 0.03 | -3.88 | 8.61 | 13.60 | 1.7303 | 0.0458 | |||
| IBKR / Interactive Brokers Group, Inc. | 0.16 | 476.95 | 8.60 | 93.06 | 1.7281 | 0.7382 | |||
| RCL / Royal Caribbean Cruises Ltd. | 0.03 | 8.14 | 1.6361 | 1.6361 | |||||
| KLAC / KLA Corporation | 0.01 | 32.81 | 7.61 | 75.01 | 1.5300 | 0.5632 | |||
| APH / Amphenol Corporation | 0.07 | -21.17 | 7.21 | 18.69 | 1.4486 | 0.0989 | |||
| DIS / The Walt Disney Company | 0.06 | -3.69 | 7.12 | 21.01 | 1.4304 | 0.1231 | |||
| FSS / Federal Signal Corporation | 0.07 | -3.62 | 7.09 | 39.45 | 1.4243 | 0.2948 | |||
| WRB / W. R. Berkley Corporation | 0.10 | -3.65 | 6.98 | -0.53 | 1.4026 | -0.1567 | |||
| PWR / Quanta Services, Inc. | 0.02 | -22.55 | 6.88 | 15.20 | 1.3828 | 0.0553 | |||
| FN / Fabrinet | 0.02 | -3.72 | 6.87 | 43.67 | 1.3798 | 0.3176 | |||
| MCK / McKesson Corporation | 0.01 | 121.43 | 6.81 | 141.12 | 1.3695 | 0.7413 | |||
| EBAY / eBay Inc. | 0.09 | 30.03 | 6.74 | 42.94 | 1.3542 | 0.3066 | |||
| TT / Trane Technologies plc | 0.02 | -19.05 | 6.69 | 5.10 | 1.3449 | -0.0703 | |||
| BGC / BGC Group, Inc. | 0.65 | -3.73 | 6.64 | 7.40 | 1.3352 | -0.0397 | |||
| COR / Cencora, Inc. | 0.02 | -22.14 | 6.54 | -16.05 | 1.3136 | -0.4168 | |||
| HCA / HCA Healthcare, Inc. | 0.02 | -4.02 | 6.40 | 6.40 | 1.2857 | -0.0505 | |||
| INGR / Ingredion Incorporated | 0.05 | 28.90 | 6.17 | 29.30 | 1.2400 | 0.1793 | |||
| UHS / Universal Health Services, Inc. | 0.03 | 6.05 | 1.2159 | 1.2159 | |||||
| IWV / iShares Trust - iShares Russell 3000 ETF | 0.02 | -21.76 | 5.93 | -13.55 | 1.1920 | -0.3327 | |||
| KEX / Kirby Corporation | 0.05 | -3.65 | 5.69 | 8.19 | 1.1441 | -0.0255 | |||
| CRBG / Corebridge Financial, Inc. | 0.16 | -3.74 | 5.58 | 8.25 | 1.1207 | -0.0243 | |||
| EME / EMCOR Group, Inc. | 0.01 | 60.32 | 5.40 | 88.95 | 1.0856 | 0.4969 | |||
| FIX / Comfort Systems USA, Inc. | 0.01 | -36.31 | 5.36 | -12.50 | 1.0775 | -0.1824 | |||
| VRTX / Vertex Pharmaceuticals Incorporated | 0.01 | -27.71 | 5.34 | -33.62 | 1.0736 | -0.7149 | |||
| TSM / Taiwan Semiconductor Manufacturing Company Limited - Depositary Receipt (Common Stock) | 0.02 | -3.70 | 5.30 | 31.39 | 1.0650 | 0.1686 | |||
| HALO / Halozyme Therapeutics, Inc. | 0.10 | -3.72 | 5.25 | -21.52 | 1.0548 | -0.4314 | |||
| NVS / Novartis AG - Depositary Receipt (Common Stock) | 0.04 | -34.11 | 5.14 | -28.48 | 1.0335 | -0.5645 | |||
| CASY / Casey's General Stores, Inc. | 0.01 | -38.89 | 5.05 | -28.16 | 1.0152 | -0.5475 | |||
| RL / Ralph Lauren Corporation | 0.02 | 5.05 | 1.0142 | 1.0142 | |||||
| ADSK / Autodesk, Inc. | 0.02 | 5.02 | 1.0078 | 1.0078 | |||||
| ENSG / The Ensign Group, Inc. | 0.03 | -21.27 | 4.97 | -6.14 | 0.9982 | -0.1780 | |||
| CHTR / Charter Communications, Inc. | 0.01 | 4.78 | 0.9612 | 0.9612 | |||||
| AMG / Affiliated Managers Group, Inc. | 0.02 | -3.95 | 4.78 | 12.47 | 0.9609 | 0.0161 | |||
| RJF / Raymond James Financial, Inc. | 0.03 | -29.13 | 4.74 | -21.75 | 0.9524 | -0.3936 | |||
| AZN / AstraZeneca PLC - Depositary Receipt (Common Stock) | 0.07 | -28.87 | 4.68 | -32.38 | 0.9409 | -0.5978 | |||
| RGLD / Royal Gold, Inc. | 0.03 | 83.80 | 4.64 | 99.96 | 0.9328 | 0.4168 | |||
| AMP / Ameriprise Financial, Inc. | 0.01 | -4.44 | 4.59 | 5.37 | 0.9224 | -0.0459 | |||
| EXPE / Expedia Group, Inc. | 0.03 | -3.64 | 4.47 | -3.29 | 0.8983 | -0.1291 | |||
| TXRH / Texas Roadhouse, Inc. | 0.02 | -33.33 | 4.46 | -25.02 | 0.8963 | -0.4257 | |||
| TSLA / Tesla, Inc. | 0.01 | -3.70 | 4.13 | 18.04 | 0.8299 | 0.0523 | |||
| LIN / Linde plc | 0.01 | -3.41 | 3.99 | -2.66 | 0.8014 | -0.1092 | |||
| NFLX / Netflix, Inc. | 0.00 | -3.33 | 3.88 | 38.83 | 0.7804 | 0.1587 | |||
| URBN / Urban Outfitters, Inc. | 0.05 | 3.76 | 0.7551 | 0.7551 | |||||
| CPAY / Corpay, Inc. | 0.01 | -41.71 | 3.62 | -44.55 | 0.7268 | -0.7224 | |||
| GS / The Goldman Sachs Group, Inc. | 0.00 | -40.51 | 3.33 | -22.92 | 0.6685 | -0.2906 | |||
| JD / JD.com, Inc. - Depositary Receipt (Common Stock) | 0.10 | -35.09 | 3.14 | -48.48 | 0.6310 | -0.7233 | |||
| ORCL / Oracle Corporation | 0.01 | 3.08 | 0.6195 | 0.6195 | |||||
| RMD / ResMed Inc. | 0.01 | -43.00 | 3.04 | -34.30 | 0.6118 | -0.4180 | |||
| TME / Tencent Music Entertainment Group - Depositary Receipt (Common Stock) | 0.16 | -59.40 | 3.04 | -45.08 | 0.6118 | -0.6202 | |||
| FCFS / FirstCash Holdings, Inc. | 0.02 | 2.99 | 0.6002 | 0.6002 | |||||
| NCLH / Norwegian Cruise Line Holdings Ltd. | 0.15 | 2.99 | 0.5999 | 0.5999 | |||||
| PFGC / Performance Food Group Company | 0.03 | -3.71 | 2.95 | 7.09 | 0.5924 | -0.0192 | |||
| BKR / Baker Hughes Company | 0.08 | -3.88 | 2.94 | -16.15 | 0.5917 | -0.1887 | |||
| GEN / Gen Digital Inc. | 0.10 | -3.67 | 2.93 | 6.74 | 0.5890 | -0.0214 | |||
| CBRE / CBRE Group, Inc. | 0.02 | -3.38 | 2.80 | 3.51 | 0.5632 | -0.0385 | |||
| EXLS / ExlService Holdings, Inc. | 0.06 | 2.67 | 0.5368 | 0.5368 | |||||
| AVY / Avery Dennison Corporation | 0.01 | -3.23 | 2.63 | -4.57 | 0.5289 | -0.0841 | |||
| AROC / Archrock, Inc. | 0.10 | -3.86 | 2.60 | -9.00 | 0.5219 | -0.1125 | |||
| EOG / EOG Resources, Inc. | 0.02 | -3.60 | 2.56 | -10.08 | 0.5144 | -0.1183 | |||
| FANG / Diamondback Energy, Inc. | 0.02 | -3.70 | 2.50 | -17.25 | 0.5025 | -0.1690 | |||
| OKE / ONEOK, Inc. | 0.03 | -3.52 | 2.24 | -20.62 | 0.4495 | -0.1767 | |||
| TBBK / The Bancorp, Inc. | 0.04 | -3.96 | 2.21 | 3.56 | 0.4442 | -0.0302 | |||
| VICI / VICI Properties Inc. | 0.07 | -3.75 | 2.18 | -3.80 | 0.4376 | -0.0655 | |||
| ADBE / Adobe Inc. | 0.01 | -5.08 | 2.17 | -4.24 | 0.4354 | -0.0675 | |||
| SPG / Simon Property Group, Inc. | 0.01 | -2.90 | 2.15 | -5.98 | 0.4329 | -0.0764 |