Mga Batayang Estadistika
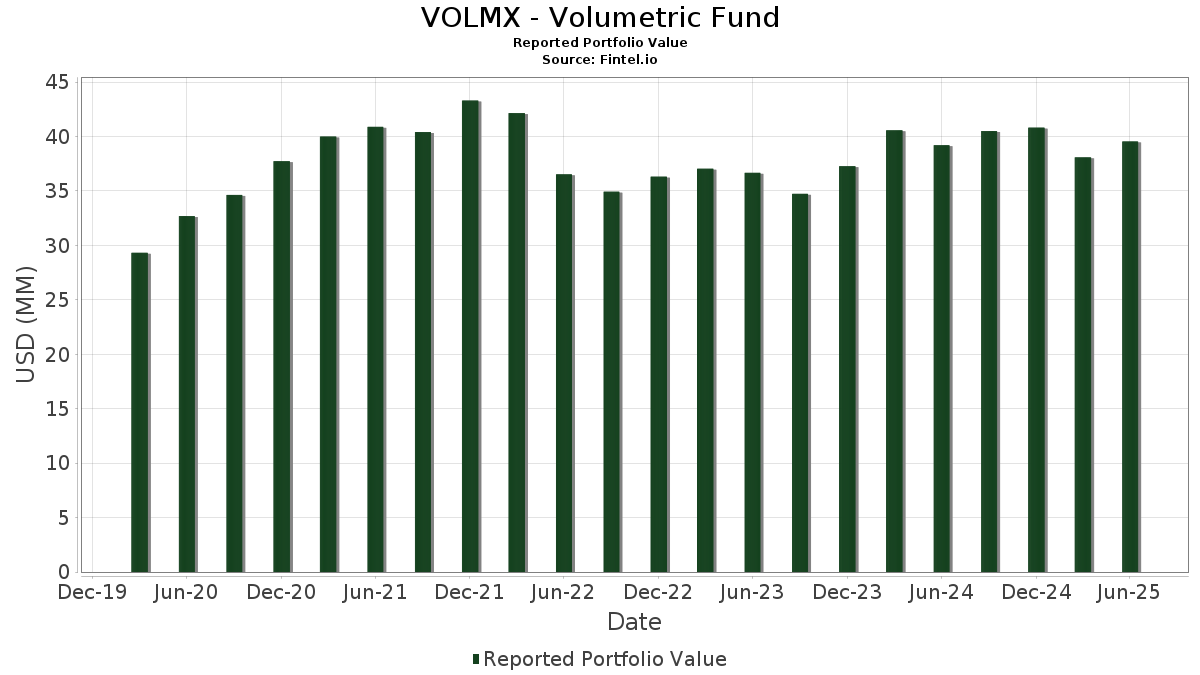
| Nilai Portofolio | $ 39,538,190 |
| Posisi Saat Ini | 57 |
Kepemilikan Terbaru, Kinerja, AUM (dari 13F, 13D)
VOLMX - Volumetric Fund telah mengungkapkan total kepemilikan 57 dalam pengajuan SEC terbaru mereka. Nilai portofolio terbaru dihitung sebesar $ 39,538,190 USD. Aset yang Dikelola (AUM) sebenarnya adalah nilai ini ditambah kas (yang tidak diungkapkan). Aset-aset utama VOLMX - Volumetric Fund adalah Fidelity Colchester Street Trust - Fidelity Institutional Money Market Funds Government Portfolio Class I (US:FIGXX) , SPDR S&P 500 ETF (US:SPY) , Waste Connections, Inc. (US:WCN) , Meta Platforms, Inc. (US:META) , and ServiceNow, Inc. (US:NOW) . Posisi baru VOLMX - Volumetric Fund meliputi: Netflix, Inc. (US:NFLX) , Parker-Hannifin Corporation (US:PH) , NetApp, Inc. (US:NTAP) , Hyatt Hotels Corporation (US:H) , and Knight-Swift Transportation Holdings Inc. (US:KNX) .
Peningkatan Tertinggi Kuartal Ini
Kami menggunakan perubahan dalam alokasi portofolio karena ini adalah metrik yang paling bermakna. Perubahan dapat disebabkan oleh perdagangan atau perubahan harga saham.
| Keamanan | Saham (MM) |
Nilai (Juta Dolar AS) |
Portfolio % | ΔPorsyento ng Portfolio |
|---|---|---|---|---|
| 3.35 | 3.35 | 8.4209 | 8.2115 | |
| 0.01 | 3.09 | 7.8181 | 7.7454 | |
| 0.01 | 1.23 | 3.1188 | 3.0853 | |
| 0.00 | 1.03 | 2.6151 | 2.5941 | |
| 0.00 | 0.00 | 2.5305 | 2.5255 | |
| 0.00 | 0.98 | 2.4717 | 2.4521 | |
| 0.00 | 0.82 | 2.0669 | 2.0466 | |
| 0.02 | 0.82 | 2.0718 | 2.0460 | |
| 0.01 | 0.81 | 2.0583 | 2.0409 | |
| 0.00 | 0.76 | 1.9304 | 1.9129 |
Penurunan Tertinggi Kuartal Ini
Kami menggunakan perubahan dalam alokasi portofolio karena ini adalah metrik yang paling bermakna. Perubahan dapat disebabkan oleh perdagangan atau perubahan harga saham.
| Keamanan | Saham (MM) |
Nilai (Juta Dolar AS) |
Portfolio % | ΔPorsyento ng Portfolio |
|---|---|---|---|---|
| 0.00 | 0.00 | -0.0133 | ||
| 0.00 | 0.00 | -0.0133 | ||
| 0.00 | 0.00 | -0.0111 |
Pengajuan 13F dan Dana
Formulir ini diajukan pada 2025-08-11 untuk periode pelaporan 2025-06-30. Klik ikon tautan untuk melihat riwayat transaksi selengkapnya.
Tingkatkan ke versi premium untuk membuka data premium dan ekspor ke Excel. ![]() .
.
| Keamanan | Ketik | Harga Saham Rata-rata | Saham (MM) |
ΔSaham (%) |
ΔSaham (%) |
Nilai ($MM) |
Portpolyo (%) |
ΔPortofolio (%) |
|
|---|---|---|---|---|---|---|---|---|---|
| FIGXX / Fidelity Colchester Street Trust - Fidelity Institutional Money Market Funds Government Portfolio Class I | 3.35 | -56.16 | 3.35 | -56.16 | 8.4209 | 8.2115 | |||
| SPY / SPDR S&P 500 ETF | 0.01 | 0.00 | 3.09 | 10.48 | 7.8181 | 7.7454 | |||
| WCN / Waste Connections, Inc. | 0.01 | 0.00 | 1.23 | -4.35 | 3.1188 | 3.0853 | |||
| META / Meta Platforms, Inc. | 0.00 | 0.00 | 1.03 | 28.16 | 2.6151 | 2.5941 | |||
| NOW / ServiceNow, Inc. | 0.00 | 0.00 | 0.98 | 29.10 | 2.4717 | 2.4521 | |||
| PPC / Pilgrim's Pride Corporation | 0.02 | 0.00 | 0.82 | -17.54 | 2.0718 | 2.0460 | |||
| COST / Costco Wholesale Corporation | 0.00 | 0.00 | 0.82 | 4.62 | 2.0669 | 2.0466 | |||
| EMR / Emerson Electric Co. | 0.01 | 0.00 | 0.81 | 21.71 | 2.0583 | 2.0409 | |||
| GOOG / Alphabet Inc. | 0.00 | 0.00 | 0.76 | 13.56 | 1.9304 | 1.9129 | |||
| ECL / Ecolab Inc. | 0.00 | 0.00 | 0.73 | 6.29 | 1.8411 | 1.8233 | |||
| INTU / Intuit Inc. | 0.00 | 0.00 | 0.72 | 28.37 | 1.8338 | 1.8192 | |||
| RJF / Raymond James Financial, Inc. | 0.00 | 0.00 | 0.69 | 10.40 | 1.7466 | 1.7304 | |||
| PKG / Packaging Corporation of America | 0.00 | 0.00 | 0.68 | -4.78 | 1.7169 | 1.6984 | |||
| WAB / Westinghouse Air Brake Technologies Corporation | 0.00 | 0.00 | 0.67 | 15.34 | 1.6954 | 1.6803 | |||
| CASY / Casey's General Stores, Inc. | 0.00 | 0.00 | 0.66 | 17.55 | 1.6788 | 1.6641 | |||
| AMZN / Amazon.com, Inc. | 0.00 | -40.00 | 0.66 | -30.81 | 1.6657 | 1.6409 | |||
| PNC / The PNC Financial Services Group, Inc. | 0.00 | 0.00 | 0.65 | 6.02 | 1.6512 | 1.6353 | |||
| MSFT / Microsoft Corporation | 0.00 | 0.00 | 0.65 | 32.38 | 1.6365 | 1.6238 | |||
| BAC / Bank of America Corporation | 0.01 | 0.00 | 0.64 | 13.40 | 1.6287 | 1.6139 | |||
| COF / Capital One Financial Corporation | 0.00 | 0.00 | 0.64 | 18.81 | 1.6153 | 1.6014 | |||
| RRC / Range Resources Corporation | 0.02 | 0.00 | 0.63 | 1.94 | 1.5953 | 1.5793 | |||
| AIT / Applied Industrial Technologies, Inc. | 0.00 | 0.00 | 0.63 | 3.13 | 1.5883 | 1.5725 | |||
| AAPL / Apple Inc. | 0.00 | 0.00 | 0.62 | -7.66 | 1.5577 | 1.5404 | |||
| AJG / Arthur J. Gallagher & Co. | 0.00 | 0.00 | 0.61 | -7.18 | 1.5393 | 1.5222 | |||
| NFLX / Netflix, Inc. | 0.00 | 0.60 | 1.5250 | 1.5250 | |||||
| BK / The Bank of New York Mellon Corporation | 0.01 | 0.00 | 0.60 | 8.68 | 1.5218 | 1.5074 | |||
| AMP / Ameriprise Financial, Inc. | 0.00 | 0.00 | 0.59 | 10.34 | 1.4858 | 1.4720 | |||
| AMAT / Applied Materials, Inc. | 0.00 | 0.00 | 0.59 | 26.08 | 1.4826 | 1.4705 | |||
| ITT / ITT Inc. | 0.00 | 0.00 | 0.58 | 21.59 | 1.4685 | 1.4561 | |||
| FCX / Freeport-McMoRan Inc. | 0.01 | 0.00 | 0.56 | 14.43 | 1.4262 | 1.4134 | |||
| USFD / US Foods Holding Corp. | 0.01 | 0.00 | 0.56 | 17.82 | 1.4227 | 1.4103 | |||
| AFL / Aflac Incorporated | 0.01 | 0.00 | 0.56 | -5.26 | 1.4145 | 1.3992 | |||
| NDAQ / Nasdaq, Inc. | 0.01 | 0.00 | 0.55 | 17.87 | 1.4031 | 1.3908 | |||
| JPM / JPMorgan Chase & Co. | 0.00 | -24.00 | 0.55 | -8.18 | 1.3940 | 1.3793 | |||
| EXPD / Expeditors International of Washington, Inc. | 0.00 | 0.00 | 0.55 | -5.03 | 1.3879 | 1.3729 | |||
| CRM / Salesforce, Inc. | 0.00 | 0.00 | 0.55 | 1.68 | 1.3802 | 1.3663 | |||
| PH / Parker-Hannifin Corporation | 0.00 | 0.54 | 1.3699 | 1.3699 | |||||
| J / Jacobs Solutions Inc. | 0.00 | 0.00 | 0.54 | 8.69 | 1.3639 | 1.3511 | |||
| PGR / The Progressive Corporation | 0.00 | 0.00 | 0.53 | -5.83 | 1.3507 | 1.3360 | |||
| NTAP / NetApp, Inc. | 0.01 | 0.53 | 1.3483 | 1.3483 | |||||
| CBRE / CBRE Group, Inc. | 0.00 | 0.00 | 0.53 | 7.26 | 1.3475 | 1.3346 | |||
| H / Hyatt Hotels Corporation | 0.00 | 0.53 | 1.3430 | 1.3430 | |||||
| AME / AMETEK, Inc. | 0.00 | -53.23 | 0.52 | -42.48 | 1.3281 | 1.3071 | |||
| FLS / Flowserve Corporation | 0.01 | 0.00 | 0.52 | -9.04 | 1.3248 | 1.3107 | |||
| D / Dominion Energy, Inc. | 0.01 | 0.00 | 0.51 | 0.79 | 1.2873 | 1.2742 | |||
| CMG / Chipotle Mexican Grill, Inc. | 0.01 | 0.51 | 1.2789 | 1.2789 | |||||
| BSX / Boston Scientific Corporation | 0.00 | 0.50 | 1.2776 | 1.2776 | |||||
| TXRH / Texas Roadhouse, Inc. | 0.00 | 0.00 | 0.49 | 12.47 | 1.2331 | 1.2219 | |||
| KNX / Knight-Swift Transportation Holdings Inc. | 0.01 | 0.49 | 1.2313 | 1.2313 | |||||
| DGX / Quest Diagnostics Incorporated | 0.00 | -10.00 | 0.49 | 21.86 | 1.2274 | 1.2165 | |||
| UNM / Unum Group | 0.01 | 0.00 | 0.48 | -0.83 | 1.2059 | 1.1934 | |||
| GWW / W.W. Grainger, Inc. | 0.00 | 0.47 | 1.1847 | 1.1847 | |||||
| 0IUX / Genuine Parts Company | 0.00 | 0.46 | 1.1666 | 1.1666 | |||||
| BKR / Baker Hughes Company | 0.01 | 0.00 | 0.43 | -12.70 | 1.0964 | 1.0835 | |||
| FI / Fiserv, Inc. | 0.00 | 0.00 | 0.43 | -21.92 | 1.0908 | 1.0765 | |||
| EW / Edwards Lifesciences Corporation | 0.01 | 0.00 | 0.42 | 7.93 | 1.0688 | 1.0587 | |||
| AMTM / Amentum Holdings, Inc. | 0.00 | -100.00 | 0.00 | -100.00 | 2.5305 | 2.5255 | |||
| MPLX / MPLX LP - Limited Partnership | 0.00 | -100.00 | 0.00 | -100.00 | -0.0133 | ||||
| LRCX / Lam Research Corporation | 0.00 | -100.00 | 0.00 | -100.00 | -0.0111 | ||||
| MPLX / MPLX LP - Limited Partnership | 0.00 | -100.00 | 0.00 | -100.00 | -0.0133 |