Mga Batayang Estadistika
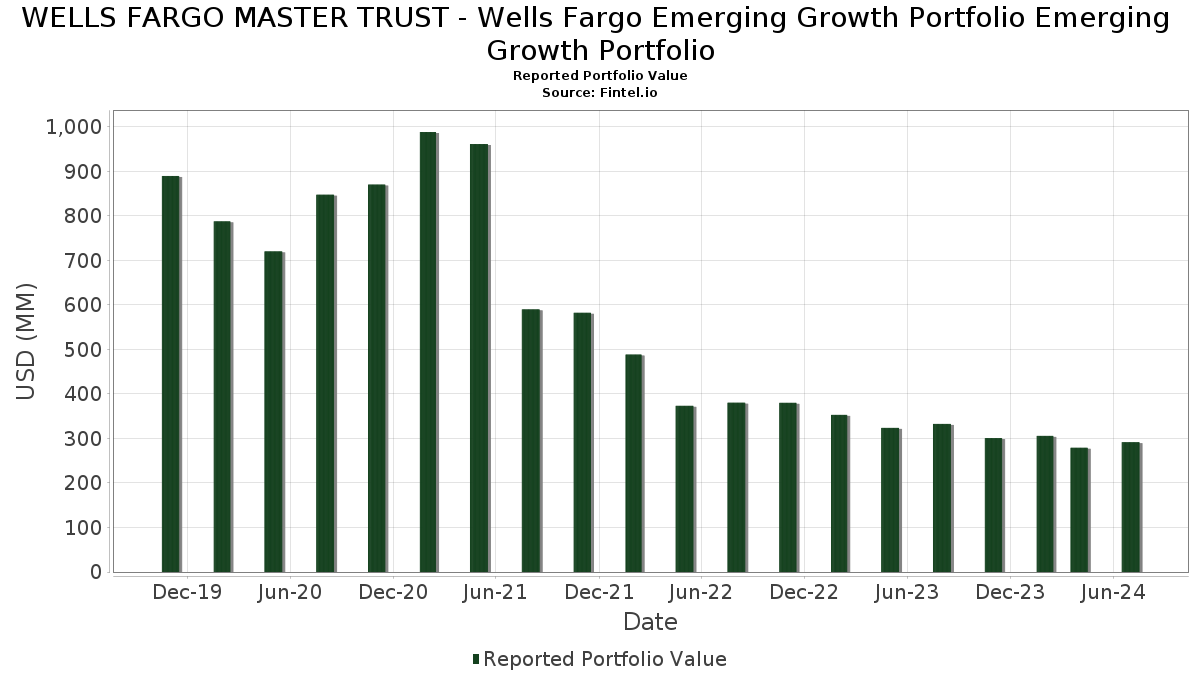
| Nilai Portofolio | $ 291,667,862 |
| Posisi Saat Ini | 83 |
Kepemilikan Terbaru, Kinerja, AUM (dari 13F, 13D)
WELLS FARGO MASTER TRUST - Wells Fargo Emerging Growth Portfolio Emerging Growth Portfolio telah mengungkapkan total kepemilikan 83 dalam pengajuan SEC terbaru mereka. Nilai portofolio terbaru dihitung sebesar $ 291,667,862 USD. Aset yang Dikelola (AUM) sebenarnya adalah nilai ini ditambah kas (yang tidak diungkapkan). Aset-aset utama WELLS FARGO MASTER TRUST - Wells Fargo Emerging Growth Portfolio Emerging Growth Portfolio adalah TransMedics Group, Inc. (US:TMDX) , RadNet, Inc. (US:RDNT) , Casella Waste Systems, Inc. (US:CWST) , CyberArk Software Ltd. (US:CYBR) , and SPS Commerce, Inc. (US:SPSC) . Posisi baru WELLS FARGO MASTER TRUST - Wells Fargo Emerging Growth Portfolio Emerging Growth Portfolio meliputi: Parsons Corporation (US:PSN) , AAR Corp. (US:AIR) , Taylor Morrison Home Corporation (US:TMHC) , CECO Environmental Corp. (US:CECO) , and AAON, Inc. (US:AAON) .
Peningkatan Tertinggi Kuartal Ini
Kami menggunakan perubahan dalam alokasi portofolio karena ini adalah metrik yang paling bermakna. Perubahan dapat disebabkan oleh perdagangan atau perubahan harga saham.
| Keamanan | Saham (MM) |
Nilai (Juta Dolar AS) |
Portfolio % | ΔPorsyento ng Portfolio |
|---|---|---|---|---|
| 0.06 | 5.08 | 1.7430 | 1.7430 | |
| 0.06 | 4.06 | 1.3919 | 1.3919 | |
| 0.06 | 3.99 | 1.3694 | 1.3694 | |
| 0.04 | 4.25 | 1.4570 | 1.3070 | |
| 0.11 | 3.36 | 1.1511 | 1.1511 | |
| 0.03 | 2.99 | 1.0266 | 1.0266 | |
| 0.02 | 2.99 | 1.0245 | 1.0245 | |
| 0.02 | 2.96 | 1.0144 | 1.0144 | |
| 0.26 | 2.67 | 0.9174 | 0.9174 | |
| 0.03 | 2.40 | 0.8227 | 0.8227 |
Penurunan Tertinggi Kuartal Ini
Kami menggunakan perubahan dalam alokasi portofolio karena ini adalah metrik yang paling bermakna. Perubahan dapat disebabkan oleh perdagangan atau perubahan harga saham.
| Keamanan | Saham (MM) |
Nilai (Juta Dolar AS) |
Portfolio % | ΔPorsyento ng Portfolio |
|---|---|---|---|---|
| 0.03 | 1.32 | 0.4538 | -1.0660 | |
| 0.04 | 5.57 | 1.9101 | -0.9683 | |
| 0.03 | 5.50 | 1.8856 | -0.8966 | |
| 0.02 | 3.20 | 1.0968 | -0.7607 | |
| 0.02 | 2.94 | 1.0079 | -0.7384 | |
| 0.15 | 2.37 | 0.8128 | -0.6647 | |
| 0.15 | 3.71 | 1.2740 | -0.5823 | |
| 0.00 | 0.00 | -0.5772 | ||
| 0.00 | 0.00 | -0.4986 | ||
| 0.00 | 0.00 | -0.4937 |
Pengajuan 13F dan Dana
Formulir ini diajukan pada 2024-09-25 untuk periode pelaporan 2024-07-31. Klik ikon tautan untuk melihat riwayat transaksi selengkapnya.
Tingkatkan ke versi premium untuk membuka data premium dan ekspor ke Excel. ![]() .
.
| Keamanan | Ketik | Harga Saham Rata-rata | Saham (MM) |
ΔSaham (%) |
ΔSaham (%) |
Nilai ($MM) |
Portpolyo (%) |
ΔPortofolio (%) |
|
|---|---|---|---|---|---|---|---|---|---|
| TMDX / TransMedics Group, Inc. | 0.07 | -35.11 | 9.88 | -1.93 | 3.3915 | -0.2376 | |||
| RDNT / RadNet, Inc. | 0.15 | -3.15 | 9.01 | 19.33 | 3.0906 | 0.3725 | |||
| CWST / Casella Waste Systems, Inc. | 0.08 | -5.08 | 8.71 | 8.73 | 2.9876 | 0.1044 | |||
| CYBR / CyberArk Software Ltd. | 0.03 | -11.87 | 8.37 | -5.56 | 2.8733 | -0.3194 | |||
| SPSC / SPS Commerce, Inc. | 0.03 | -24.74 | 7.47 | -6.76 | 2.5633 | -0.3214 | |||
| GKOS / Glaukos Corporation | 0.06 | -3.71 | 6.70 | 17.54 | 2.2976 | 0.2462 | |||
| BOOT / Boot Barn Holdings, Inc. | 0.05 | -20.03 | 6.61 | 0.24 | 2.2668 | -0.1059 | |||
| FIX / Comfort Systems USA, Inc. | 0.02 | -9.48 | 6.35 | -2.76 | 2.1776 | -0.1721 | |||
| AIT / Applied Industrial Technologies, Inc. | 0.03 | -9.58 | 6.18 | 7.65 | 2.1191 | 0.0535 | |||
| BRBR / BellRing Brands, Inc. | 0.12 | -2.84 | 6.14 | -9.70 | 2.1051 | -0.3410 | |||
| VCEL / Vericel Corporation | 0.12 | -2.91 | 6.08 | 6.94 | 2.0843 | 0.0390 | |||
| FROG / JFrog Ltd. | 0.15 | -5.00 | 5.64 | -8.15 | 1.9343 | -0.2755 | |||
| US78473E1038 / COMMON STOCK | 0.04 | -42.51 | 5.57 | -30.36 | 1.9101 | -0.9683 | |||
| ELF / e.l.f. Beauty, Inc. | 0.03 | -33.02 | 5.50 | -28.89 | 1.8856 | -0.8966 | |||
| VRNS / Varonis Systems, Inc. | 0.10 | 4.58 | 5.41 | 31.79 | 1.8564 | 0.3782 | |||
| PSN / Parsons Corporation | 0.06 | 5.08 | 1.7430 | 1.7430 | |||||
| DSGX / The Descartes Systems Group Inc. | 0.05 | -4.82 | 5.01 | 4.26 | 1.7205 | -0.0111 | |||
| BFAM / Bright Horizons Family Solutions Inc. | 0.04 | -19.70 | 4.95 | -6.90 | 1.6981 | -0.2159 | |||
| SKWD / Skyward Specialty Insurance Group, Inc. | 0.12 | -5.35 | 4.83 | 7.24 | 1.6563 | 0.0357 | |||
| NOVT / Novanta Inc. | 0.03 | 24.34 | 4.81 | 43.93 | 1.6515 | 0.4475 | |||
| MOD / Modine Manufacturing Company | 0.04 | 17.43 | 4.76 | 49.17 | 1.6322 | 0.4839 | |||
| FRPT / Freshpet, Inc. | 0.04 | -13.03 | 4.63 | -0.22 | 1.5881 | -0.0820 | |||
| KNSL / Kinsale Capital Group, Inc. | 0.01 | -29.32 | 4.52 | -11.07 | 1.5498 | -0.2789 | |||
| CWAN / Clearwater Analytics Holdings, Inc. | 0.23 | 44.97 | 4.41 | 79.60 | 1.5136 | 0.6293 | |||
| BROS / Dutch Bros Inc. | 0.12 | 23.60 | 4.41 | 67.89 | 1.5122 | 0.5670 | |||
| STRL / Sterling Infrastructure, Inc. | 0.04 | 790.12 | 4.25 | 920.67 | 1.4570 | 1.3070 | |||
| HQY / HealthEquity, Inc. | 0.05 | -3.48 | 4.13 | -4.02 | 1.4183 | -0.1322 | |||
| AIR / AAR Corp. | 0.06 | 4.06 | 1.3919 | 1.3919 | |||||
| TMHC / Taylor Morrison Home Corporation | 0.06 | 3.99 | 1.3694 | 1.3694 | |||||
| PLMR / Palomar Holdings, Inc. | 0.04 | 64.48 | 3.92 | 92.39 | 1.3448 | 0.6112 | |||
| PRCT / PROCEPT BioRobotics Corporation | 0.06 | -4.96 | 3.76 | 13.60 | 1.2895 | 0.0982 | |||
| ONTO / Onto Innovation Inc. | 0.02 | 0.00 | 3.76 | 3.13 | 1.2891 | -0.0226 | |||
| KRYS / Krystal Biotech, Inc. | 0.02 | -4.78 | 3.74 | 29.66 | 1.2826 | 0.2444 | |||
| FN / Fabrinet | 0.02 | 7.63 | 3.73 | 37.18 | 1.2813 | 0.3010 | |||
| ALGM / Allegro MicroSystems, Inc. | 0.15 | -11.06 | 3.71 | -27.99 | 1.2740 | -0.5823 | |||
| AZEK / The AZEK Company Inc. | 0.08 | 3.43 | 3.65 | 1.73 | 1.2536 | -0.0395 | |||
| ATI / ATI Inc. | 0.05 | 0.00 | 3.59 | 13.40 | 1.2313 | 0.0921 | |||
| LGND / Ligand Pharmaceuticals Incorporated | 0.03 | 0.00 | 3.55 | 55.95 | 1.2185 | 0.3986 | |||
| W / Wayfair Inc. | 0.06 | 31.80 | 3.43 | 43.05 | 1.1765 | 0.3134 | |||
| CECO / CECO Environmental Corp. | 0.11 | 3.36 | 1.1511 | 1.1511 | |||||
| BRZE / Braze, Inc. | 0.07 | -22.82 | 3.23 | -18.85 | 1.1093 | -0.3250 | |||
| WIX / Wix.com Ltd. | 0.02 | -52.76 | 3.20 | -38.05 | 1.0968 | -0.7607 | |||
| ROAD / Construction Partners, Inc. | 0.05 | 0.00 | 3.03 | 25.20 | 1.0385 | 0.1680 | |||
| PACS / PACS Group, Inc. | 0.08 | 0.00 | 3.02 | 43.43 | 1.0369 | 0.2780 | |||
| AAON / AAON, Inc. | 0.03 | 2.99 | 1.0266 | 1.0266 | |||||
| KEX / Kirby Corporation | 0.02 | 2.99 | 1.0245 | 1.0245 | |||||
| ICFI / ICF International, Inc. | 0.02 | 2.96 | 1.0144 | 1.0144 | |||||
| DUOL / Duolingo, Inc. | 0.02 | -20.48 | 2.94 | -39.44 | 1.0079 | -0.7384 | |||
| CLS / Celestica Inc. | 0.06 | 194.65 | 2.89 | 256.67 | 0.9914 | 0.6996 | |||
| SAIA / Saia, Inc. | 0.01 | 218.25 | 2.68 | 235.00 | 0.9198 | 0.6318 | |||
| ACVA / ACV Auctions Inc. | 0.16 | -35.92 | 2.68 | -17.03 | 0.9194 | 0.2423 | |||
| CCCS / CCC Intelligent Solutions Holdings Inc. | 0.26 | 2.67 | 0.9174 | 0.9174 | |||||
| RXST / RxSight, Inc. | 0.06 | 0.00 | 2.66 | -12.20 | 0.9142 | -0.1784 | |||
| SITE / SiteOne Landscape Supply, Inc. | 0.02 | -21.31 | 2.60 | -26.44 | 0.8919 | -0.3803 | |||
| IRTC / iRhythm Technologies, Inc. | 0.03 | 2.40 | 0.8227 | 0.8227 | |||||
| FWRG / First Watch Restaurant Group, Inc. | 0.15 | -9.45 | 2.37 | -42.26 | 0.8128 | -0.6647 | |||
| ESAB / ESAB Corporation | 0.02 | 2.29 | 0.7843 | 0.7843 | |||||
| GLOB / Globant S.A. | 0.01 | -4.20 | 2.22 | 4.43 | 0.7612 | -0.0036 | |||
| SG / Sweetgreen, Inc. | 0.08 | 2.18 | 0.7467 | 0.7467 | |||||
| SLNO / Soleno Therapeutics, Inc. | 0.04 | 36.26 | 2.14 | 47.14 | 0.7338 | 0.2105 | |||
| ACMR / ACM Research, Inc. | 0.11 | 0.00 | 1.98 | -29.68 | 0.6782 | -0.3336 | |||
| PCVX / Vaxcyte, Inc. | 0.02 | 75.51 | 1.93 | 128.62 | 0.6606 | 0.3574 | |||
| ENSG / The Ensign Group, Inc. | 0.01 | 0.00 | 1.85 | 18.91 | 0.6345 | 0.0746 | |||
| AVAV / AeroVironment, Inc. | 0.01 | 0.00 | 1.59 | 11.80 | 0.5462 | 0.0332 | |||
| CYTK / Cytokinetics, Incorporated | 0.03 | 54.34 | 1.58 | 48.58 | 0.5406 | 0.1586 | |||
| WING / Wingstop Inc. | 0.00 | 0.00 | 1.53 | -2.85 | 0.5264 | -0.0421 | |||
| CHEF / The Chefs' Warehouse, Inc. | 0.04 | 0.00 | 1.51 | 25.79 | 0.5188 | 0.0858 | |||
| TTEK * / Tetra Tech, Inc. | 0.01 | 1.47 | 0.5048 | 0.5048 | |||||
| TWST / Twist Bioscience Corporation | 0.03 | 1.47 | 0.5036 | 0.5036 | |||||
| EVER / EverQuote, Inc. | 0.05 | 23.98 | 1.43 | 60.38 | 0.4905 | 0.1696 | |||
| AMSC / American Superconductor Corporation | 0.06 | 1.42 | 0.4874 | 0.4874 | |||||
| CRDO / Credo Technology Group Holding Ltd | 0.05 | -55.30 | 1.41 | -30.61 | 0.4833 | -0.2473 | |||
| NTRA / Natera, Inc. | 0.01 | -73.86 | 1.37 | -59.29 | 0.4707 | -0.2361 | |||
| TARS / Tarsus Pharmaceuticals, Inc. | 0.06 | -8.54 | 1.35 | -29.31 | 0.4642 | -0.2250 | |||
| SPT / Sprout Social, Inc. | 0.03 | -59.54 | 1.32 | -68.68 | 0.4538 | -1.0660 | |||
| CORT / Corcept Therapeutics Incorporated | 0.03 | 1.31 | 0.4498 | 0.4498 | |||||
| ESE / ESCO Technologies Inc. | 0.01 | -33.11 | 1.14 | -18.95 | 0.3920 | -0.1154 | |||
| SVCO / Silvaco Group, Inc. | 0.06 | 1.08 | 0.3706 | 0.3706 | |||||
| INSP / Inspire Medical Systems, Inc. | 0.01 | 91.67 | 0.97 | 11.97 | 0.3339 | 0.0207 | |||
| CMPR / Cimpress plc | 0.01 | -62.17 | 0.87 | -59.54 | 0.2992 | -0.4761 | |||
| APPF / AppFolio, Inc. | 0.00 | -53.52 | 0.73 | -45.64 | 0.2508 | -0.1977 | |||
| GPCR / Structure Therapeutics Inc. - Depositary Receipt (Common Stock) | 0.02 | 0.00 | 0.58 | -5.10 | 0.1981 | -0.0212 | |||
| ALLSPRING GOVERNMENT MONEY MAR / STIV (000000000) | 0.01 | 0.01 | 0.0037 | 0.0037 | |||||
| APLS / Apellis Pharmaceuticals, Inc. | 0.00 | -100.00 | 0.00 | -100.00 | -0.5772 | ||||
| ITCI / Intra-Cellular Therapies, Inc. | 0.00 | -100.00 | 0.00 | -100.00 | -0.4628 | ||||
| CYRX / Cryoport, Inc. | 0.00 | -100.00 | 0.00 | -100.00 | -0.3004 | ||||
| CELH / Celsius Holdings, Inc. | 0.00 | -100.00 | 0.00 | -100.00 | -0.4937 | ||||
| SUM / Summit Materials, Inc. | 0.00 | -100.00 | 0.00 | -100.00 | -0.4986 |